 🏷️ Likely Rental
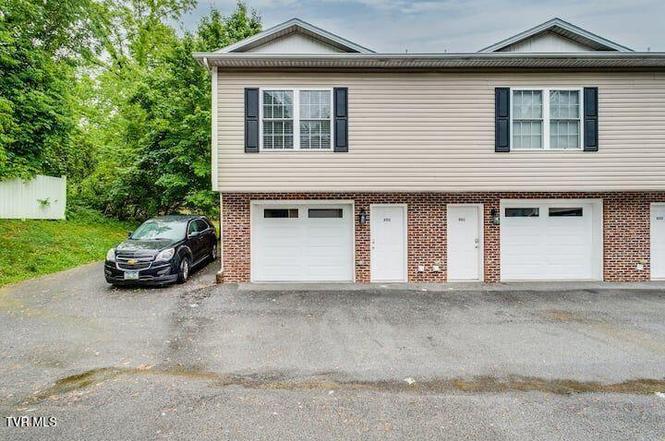
169 Grand Ave #402 · Johnson City, TN
Flood risk 1/10 · Minimal
- FEMA flood zone
- X (unshaded)
- Chance of flooding over 30 yrs
- 0.0%
- Est. flood insurance / yr
- $473 – $860
Fire risk 2/10 · Minimal
- Est. fire insurance / yr
- $949 – $1,763
Heat risk 4/10 · Minor
- Hot days now (above 98°F)
- 7 days/yr
- Hot days in 30 yrs
- 20 days/yr
Wind risk 2/10 · Minimal
- Chance of severe wind over 30 yrs
- —
Air-quality risk 2/10 · Minimal
- Unhealthy air days now
- 1 days/yr
- Unhealthy air days in 30 yrs
- 1 days/yr
Risk factors via First Street. Map © Google.
Why this score? — see what drove the D+ grade
The composite is a weighted blend of 9 inputs, each scored 0–100. Each bar is that input's sub-score; the figure is the points it added to the 100-point composite (weight × sub-score).
- Cash flow +15.0/30.0
- ARV discount +7.5/15.0
- 1% rule +5.0/10.0
- DSCR +5.0/10.0
- Schools +3.9/10.0
- Livability +3.8/5.0
- Rent growth +3.7/5.0
- Condition / age +2.5/5.0
- Appreciation +0.0/10.0
$2,500
🖨 Deal sheet 📄 Offer letter ✓ Due diligence
Listing remarks
Welcome to this fully furnished townhome, available on a convenient month-to-month basis. Featuring two spacious bedrooms, two full baths, and a one-car garage, this home offers both comfort and flexibility. The open floor plan includes a modern, fully stocked kitchen and a living area designed for relaxing or entertaining. Smart TVs are provided in the living space and bedrooms for your enjoyment. All utilities—including electricity, water, internet, and trash service—are included in the monthly rent, along with lawn care, making this a truly turnkey option. The property is located just minutes from vibrant downtown Johnson City, offering easy access to dining, shopping, and en
Key facts
- Turnkey option
- Smart tvs provided
- Garage
Tags
Property features AI
Exterior
- Parking: 1-car garage; Driveway (asphalt); Garage door opener
- Utilities: Public water; Public sewer
- Home design: Townhouse; Two levels; Residential property
- Construction: Brick and vinyl siding construction; Slab foundation; Built as a townhouse
- Exterior features: Level topography; Asphalt shingle roof
Interior
- Kitchen: Dishwasher; Electric range; Microwave; Refrigerator
- Bathrooms: 2 full bathrooms
- Heating & cooling: Central heating (electric); Heat pump; Central air conditioning; Ceiling fans
- Interior features: Open floor plan; Total of 7 rooms
- Laundry & utility: Washer; Dryer
Neighborhood map
What this means for you Summary
Snapshot
- This is a 2-bed/2.0-bath townhouse listed at $2k.
Deal economics
- At list price, monthly cash flow is $1k ($14k/yr) — positive.
- The deal already cash-flows at list — no discount required.
- Meets the 1% rule at list price ($2k rent vs $2k).
- Recommended offer: $2k (12.0% below list) — sets the bar for market timing.
- Cap rate 571.1% vs local median 3.1% in Johnson City — top-decile yield for the area; either an underpriced asset or a hidden risk that comps aren't pricing in. Stress-test before assuming the spread holds.
Location & tenants
- Location reads 76/100 on livability (#8 in TN, #3,349 nationally) — a middle-class / working-renter tenant base. Strengths: amenities A+, cost of living A+, health & safety A; Watch: crime D, commute F, employment F.
- Johnson City (urban): math 46% / reading 47% proficiency, ranked #9 of 139 in TN (top 6%) — families likely to look elsewhere, expect single-tenant / working-renter base with shorter leases.
- Zoned schools: Mountain View Elementary (math 22% / reading 27%, grade F, #546 of 952 statewide, top 61%, 498 students, 0% FRL); Liberty Bell Middle School (math 43% / reading 38%, grade F, #42 of 333 statewide, top 13%, 898 students, 0% FRL); Science Hill High School (math 37% / reading 60%, grade D, #13 of 332 statewide, top 4%, 2,401 students, 0% FRL) — zoned schools average 0% FRL vs 44% district-wide (44 pts lower); this property's tenant base skews higher-income than the district average.
- Market conditions: Rents rising fast (+4.9%/yr); 206 active listings in the ZIP; 32 comparable units currently listed for rent nearby; rentals at typical pace (median 21d on market — plan ~3-4 weeks tenant-placement turnaround); 41% of comp listings sitting > 30 days — soft ceiling on asking rent; 1,155 units permitted in Washington County in 2024 (437 in 5+ unit buildings).
- This rent runs 36% of the median local income ($51k/yr) — at the standard rent-burdened threshold; future hikes will face affordability resistance.
Forward outlook
- Local home prices are declining (-3.0%/yr); year-one equity from $17 of loan paydown is wiped out by about $75 of value loss. Plan a longer hold.
- Washington County population projected at +9% by 2050 — modest demand growth; plan on rents tracking national, not racing it.
- At projected returns (-3.0% appreciation + 4.9% rent growth), your $700 cash investment doubles in ~1 year — after that, you're playing with house money.
Negotiation context
- It's been on market 245 days — a 12% lower offer ($2k) is reasonable based on typical stale-listing flexibility.
- 2 sale attempts; this cycle's ask is 4% above the opening price — seller raised mid-cycle; expect resistance to lowballs.
Questions for the listing agent
- It's been on market 245 days. Have you received any prior offers? Is the seller open to a 12% concession, seller financing, or rate buy-down credit?
- Why hasn't it sold? Are there any deal-killer items the seller is aware of (foundation, flood, title, zoning, code violations)?
- Is there a deadline driving the sale (1031 exchange, divorce, estate, relocation)? That informs how much negotiation room exists.
- Crime grade is D in this area — have there been break-ins, vandalism, or insurance claims at this property in the last 3 years? What carrier currently insures it and at what premium?
- The area grade is low — what's the realistic commute time and amenity access for the typical tenant pool here? Any planned neighborhood developments (good or bad) we should know about?
- What's the average days-on-market for RENTAL listings here right now (not sales)? A rising rental-DOM trend means longer vacancies and softer asking-rent achievability than the comps imply.
- What's the recent tenant-quality profile in this submarket — average credit score on applications, eviction rate, late-payment / NSF rate, and stable-employment percentage? A property-management company in the area should have these aggregated.
- How much new for-sale + rental construction is in the pipeline within 1–3 miles? Heavy new supply typically softens prices + rents 12–24 months out; constrained supply supports both.
Investment metrics
- 1% rule
- 60.46% ✓
- Cap rate
- 571.12%
- Cash-on-cash
- 2017.25%
- DSCR
- 90.76
- GRM
- 0.1
CMA / ARV
- ARV (on-the-fly)
- $165,240
- Comps found
- 1
Show comp detail 1 sale within ~0.75 mi
| Address | Dist | Beds/Ba | Sqft | Sold | Price | $/sf | Match |
|---|---|---|---|---|---|---|---|
| 216 University Parkway Pkwy Unit 21w | 0.59mi | 2/2.0 | 1,081 (+0%) | 18mo | $165,000 | $153 | 57 |
Match score weights: distance 35% · size 25% · config 20% · recency 20%. Top-matched comps best support the ARV.
Projected returns pro-forma
-3.0% appreciation · 4.88% rent growth · sell at horizon
- IRR
- —
- Equity multiple
- 111.68×
- Total profit
- $77,477
- Equity at exit
- $373
- IRR
- —
- Equity multiple
- 253.12×
- Total profit
- $176,483
- Equity at exit
- $216
Cash invested: $700 (down + closing). Projections, not guarantees.
Landlord ↔ Tenant lean methodology
- Overall (STATE)
- 87 Strongly Landlord-Friendly
- State Tennessee
- 87 Strongly Landlord-Friendly · R+13
- County
- — inherits STATE
- City
- — inherits STATE
ZIP-level market 37601
- Home prices YoY
- -21.4%
- Rents YoY
- 4.9%
- Active inventory
- 206
- Price-to-rent
- 0.1×
Monthly cashflow live
- Estimated rent
- $1,511 high interval (Pro) →
- Mortgage (P&I)
- −$13
- Tax est. 1.5%
- −$3 /mo · $38/yr
- Insurance
- −$1
- HOA
- −$0
- Vacancy / Maint / Mgmt
- −$317
- Net cashflow
- $1,177
Break-even live
UW: 25.0% down · 7.5% · 30yr · 1.5% tax · 5.0% vac · 8.0% maint · 8.0% mgmt
Financing live
Cash to close
- Down payment
- $625
- Closing costs
- $75
- Reserves months
- —
- Total cash needed
- —
Loan-product check · same deal, 3 products live
Conventional
25% down · 7.5% · 30yr
- Down + closing
- —
- Monthly P&I
- —
- Monthly cashflow
- —
- DSCR
- —
- Eligible?
- —
Personal DTI + credit; lowest rate.
DSCR
20% down · 8.5% · 30yr
- Down + closing
- —
- Monthly P&I
- —
- Monthly cashflow
- —
- DSCR
- —
- Eligible?
- —
No personal income docs; deal must DSCR.
Hard money
10% down · 12.0% · 12mo
- Down + closing
- —
- Monthly P&I
- —
- Monthly cashflow
- —
- DSCR
- —
- Eligible?
- —
Short-term bridge; refi at stabilization.
Rent comps 32 comps
| Address | Beds | Baths | Sqft | Rent | $/sqft | DOM | Units | Dist |
|---|---|---|---|---|---|---|---|---|
| 169 Grande Ave #100 heuristic Johnson City, TN | 2.0 | 2.0 | 1080 | $2,500 | $2.31 | 25d | 1 | 0.01mi |
| 169 Grand Ave #101 heuristic Johnson City, TN | 2.0 | 2.0 | 1080 | $2,500 | $2.31 | 25d | 1 | 0.01mi |
| 169 Grand Ave #300 heuristic Johnson City, TN | 2.0 | 2.0 | 792 | $2,500 | $3.16 | 25d | 1 | 0.01mi |
| 169 Grande Ave #200 heuristic Johnson City, TN | 2.0 | 2.0 | 1080 | $2,500 | $2.31 | 25d | 1 | 0.01mi |
| 169 Grand Ave #401 heuristic Johnson City, TN | 2.0 | 2.0 | 792 | $2,500 | $3.16 | 25d | 1 | 0.01mi |
| 168 E Grande Ave Unit 04 Johnson City, TN | 2.0 | 2.0 | 800 | $1,350 | $1.69 | 21d | 1 | 0.08mi |
| 1507 Linden St Unit 25 Johnson City, TN | 2.0 | 1.5 | 1150 | $1,125 | $0.98 | 13d | 1 | 0.21mi |
| 716 King Springs Rd #5 Johnson City, TN | 2.0 | 1.5 | 1500 | $1,250 | $0.83 | 44d | 1 | 0.23mi |
| 81 Charleston Sq Johnson City, TN | 1.0–3.0 | 1.0–2.0 | 734 | $1,182 | $1.61 | 13d | 4 | 0.72mi |
| 1010 Buffalo St Unit 3 Johnson City, TN | 2.0 | 1.0 | 861 | $1,300 | $1.51 | 43d | 1 | 0.72mi |
| 1319 Bell Ridge Rd Johnson City, TN | 2.0–4.0 | 2.0 | 1204 | $1,237 | $1.03 | 21d | 6 | 0.80mi |
| 407 S Roan St Johnson City, TN | 1.0 | 1.0 | 716 | $1,250 | $1.74 | 13d | 2 | 0.82mi |
| 704 Swadley Rd Johnson City, TN | 2.0–3.0 | 1.5–3.5 | 1800 | $1,400 | $0.78 | 13d | 2 | 0.82mi |
| 606 Swadley Rd Johnson City, TN | 1.0–2.0 | 1.0–2.5 | 1300 | $1,700 | $1.31 | 13d | 1 | 0.85mi |
| 2560 Plymouth Rd Johnson City, TN | 2.0–3.0 | 2.0 | 1163 | $980 | $0.84 | 13d | 1 | 0.88mi |
| 404 W Maple St Unit 1 Johnson City, TN | 2.0 | 1.0 | 1000 | $1,050 | $1.05 | 43d | 1 | 0.89mi |
| 512 Swadley Rd Johnson City, TN | 2.0–4.0 | 2.0 | 1068 | $1,165 | $1.09 | 13d | 6 | 0.91mi |
| 116 E Market St Johnson City, TN | 2.0 | 2.5 | 1249 | $1,700 | $1.36 | 13d | 1 | 0.93mi |
| 2610 Plymouth Rd Johnson City, TN | 1.0–3.0 | 1.0–2.0 | 855 | $1,288 | $1.50 | 13d | 6 | 0.95mi |
| 1411 Saint Louis St Johnson City, TN | 2.0 | 1.0 | 1100 | $1,125 | $1.02 | 43d | 1 | 0.99mi |
| 1700 Dave Buck Rd Johnson City, TN | 2.0–3.0 | 2.0 | 1041 | $1,370 | $1.32 | 13d | 4 | 1.05mi |
| 616 W Maple St Unit 2 Johnson City, TN | 2.0 | 1.0 | 925 | $1,000 | $1.08 | 43d | 1 | 1.16mi |
| 1400 Virginia St Unit 2 Johnson City, TN | 2.0 | 1.0 | 1000 | $925 | $0.93 | 43d | 1 | 1.16mi |
| 701 W Locust St #22 Johnson City, TN | 2.0 | 1.5 | 1141 | $1,375 | $1.21 | 43d | 1 | 1.17mi |
| 220 Highland Ave Unit 1397973P Johnson City, TN | 2.0 | 1.0 | 925 | $3,993 | $4.32 | 13d | 1 | 1.23mi |
| 250 W Main St Apt 7 Johnson City, TN | 1.0 | 1.0 | 700 | $750 | $1.07 | 13d | 1 | 1.24mi |
| 268 W Main St Unit WM-06 Johnson City, TN | 2.0 | 1.0 | 960 | $1,350 | $1.41 | 13d | 1 | 1.31mi |
| 608 W Watauga Ave Unit 3 Johnson City, TN | 2.0 | 1.5 | 1000 | $1,200 | $1.20 | 43d | 1 | 1.32mi |
| 405 W Watauga Ave Unit WAT-34 Johnson City, TN | 1.0 | 1.0 | 872 | $1,150 | $1.32 | 43d | 1 | 1.33mi |
| 111 W Unaka Ave Apt 2 Johnson City, TN | 2.0 | 1.5 | 1150 | $1,450 | $1.26 | 43d | 1 | 1.37mi |
| 703 E Unaka Ave Unit 1 Johnson City, TN | 2.0 | 1.0 | 1421 | $1,300 | $0.91 | 43d | 1 | 1.45mi |
| 2723 S Roan St Unit 9 Johnson City, TN | 2.0 | 1.5 | 1000 | $1,015 | $1.01 | 21d | 1 | 1.49mi |
Listing history 15 events
-
2026-06-19days on market $2,500 Active 245 DOM
-
2026-06-18days on market $2,500 Active 244 DOM
-
2026-06-17days on market $2,500 Active 243 DOM
-
2026-06-16days on market $2,500 Active 242 DOM
-
2026-06-15days on market $2,500 Active 241 DOM
-
2026-06-14days on market $2,500 Active 239 DOM
-
2026-06-13days on market $2,500 Active 238 DOM
-
2026-06-10days on market $2,500 Active 236 DOM
-
2026-06-09days on market $2,500 Active 235 DOM
-
2026-06-08days on market $2,500 Active 234 DOM
-
2026-06-07days on market $2,500 Active 233 DOM
-
2026-06-02days on market $2,500 Active 228 DOM
-
2026-06-01days on market $2,500 Active 227 DOM
-
2026-05-31days on market $2,500 Active 226 DOM
-
2026-05-30days on market $2,500 Active 225 DOM
ⓘ Source: listings_history table (triggers on properties + properties_extension) + one-shot
backfill from property_details.listing_events for pre-trigger history.
Climate risk First Street
- Flood 1/10 Low FEMA zone X (unshaded) · 0% chance over 30 yrs
- Wildfire 2/10 Low
- Heat 4/10 Moderate 7 d/yr ≥98°F today · 20 d/yr by 30 yrs out
- Wind 2/10 Low
- Air quality 2/10 Low 1 unhealthy d/yr today · 1 by 30 yrs out
Nearby sold comps map
Loading sold comps map…
Walkable amenities ~0.75 mi
Loading nearby amenities…
Taxation est. · year 1
- Rental income
- $18,137
- − Mortgage interest
- −$140
- − Property taxes
- −$38
- − Insurance
- −$12
- − Repairs & maintenance
- −$1,451
- − Management
- −$1,451
- − Depreciation
- −$73
- Taxable income
- $14,972
- Est. tax owed @ 24.0%
- −$3,593
- After-tax cash flow
- $10,527/yr
For passive investors: Depreciation is non-cash, so a rental often shows a tax loss while cash-flowing — sheltering income. Rental losses are passive: they offset passive income freely, and up to $25,000/yr can offset ordinary (W-2) income if you actively participate and your MAGI is under $100k (phasing out to $0 by $150k); unused losses carry forward. On sale, claimed depreciation is recaptured at up to 25%, and gains may owe capital-gains tax (a 1031 exchange can defer both). Figures are a year-1 estimate at your 24.0% rate — not tax advice; consult a CPA.
Schools (NCES district)
- District
- Johnson City
- NCES district ID
- 4702130
- Math proficiency
- 46% ▼ -14.00%
- Reading proficiency
- 47% ▼ -2.00%
- Median HH income
- $37,514
- Composite
- 38.69/100
- National rank
- #4143
- State rank
- #9 of 139 in TN
Livability — Johnson City
- Score
- 76/100
- State rank
- #8
- US rank
- #3349
Category grades
Schools grade is shown separately in the Schools card above.
Census & demographics
- Census place
- Johnson City, TN
- County
- Washington County · 129,006 people
- City population
- 99,926
- Metro
- Johnson City, TN
- Population (ZIP)
- 38,008
- Household income
- $50,686
- Rent vs Own
- Severe rent burden
- 1464.0
Population outlook (Washington County) Hauer SSP2
- Today (2025)
- 132,816 people
- By 2030
- 135,823 · +2.3%
- By 2040
- 140,897 · +6.1%
- By 2050
- 145,073 · +9.2%
- By 2075
- 156,386 · +17.7%
- By 2100
- 159,893 · +20.4%
Race, ethnicity, and origin ACS 2023
- Neighborhood character
- Predominantly White (82%)
- Race & ethnicity
- White 82% Two or more races 7% Black 6% Hispanic / Latino 5% Asian 2%
- Common ancestry
- Serbian 3% Slovak 2% Iranian 1%
- Foreign-born
- 5% · Canada, China
- Languages at home
- 94% English-only · Spanish 3% Arabic 1% Chinese 1%
Political lean MEDSL · Washington
- 2024 margin
- Solid R (+39.5) · D 29.6% · R 69.1% · Other 1.3%
- 2008→2024 swing
- -6.0pp toward R · 2008: -33.5pp · 2024: -39.5pp
- All cycles
- 2024: R+39.5 2020: R+36.2 2016: R+42.9 2012: R+38.5 2008: R+33.5
Not yet ingested
- Civics
- —
Market trends
- HPI YoY
- ▼ -79.16%
- Current HPI
- 290.506
- Rent YoY
- ▲ 4.88%
- Metro
- Johnson City, TN
- State GDP YoY
- ▲ 2.78%
- F500 in state
- 22
Industry mix (Fortune 500 HQ in TN)
| Industry | F500 HQs | Revenue |
|---|---|---|
| Healthcare | 3 | $91B |
|
||
| Retail | 3 | $72B |
|
||
| Transportation / Logistics | 1 | $88B |
|
||
| Paper / Packaging | 1 | $19B |
|
||
| Insurance | 1 | $13B |
|
||
| Energy | 1 | $12B |
|
||
Price history
-99.6% since first listed5 events — show timeline
- 2026-05-29 Relisted — TVRMLS
- 2026-04-24 Delisted — TVRMLS
- 2026-03-26 Price Changed $2,500 TVRMLS
- 2025-09-12 Listed $2,400 TVRMLS
- 2020-04-22 Sold (Public Records) $707,500 Public Records
Property tax history
+1.3%/yrLatest (2025): $841 · +0.0% YoY. Source: county tax records.
Cash-flow waterfall
monthlySold comps — $/sqft
last 12 mo · ≤1 miLoading sold comps…