9573 State Line Rd · Conneaut, OH
Flood risk 1/10 · Minimal
- FEMA flood zone
- X (unshaded)
- Chance of flooding over 30 yrs
- 0.0%
- Est. flood insurance / yr
- $507 – $1,088
Fire risk 1/10 · Minimal
- Est. fire insurance / yr
- $511 – $949
Heat risk 2/10 · Minimal
- Hot days now (above 94°F)
- 7 days/yr
- Hot days in 30 yrs
- 17 days/yr
Wind risk 1/10 · Minimal
- Chance of severe wind over 30 yrs
- —
Air-quality risk 3/10 · Minor
- Unhealthy air days now
- 1 days/yr
- Unhealthy air days in 30 yrs
- 4 days/yr
Risk factors via First Street. Map © Google.
Why this score? — see what drove the D+ grade
The composite is a weighted blend of 9 inputs, each scored 0–100. Each bar is that input's sub-score; the figure is the points it added to the 100-point composite (weight × sub-score).
- Cash flow +11.0/30.0
- Appreciation +10.0/10.0
- ARV discount +7.5/15.0
- Schools +3.6/10.0
- DSCR +3.2/10.0
- Livability +3.2/5.0
- 1% rule +2.9/10.0
- Rent growth +2.5/5.0
- Condition / age +2.5/5.0
$119,900
🖨 Deal sheet (PDF) 📄 Offer letter ✓ Due diligence
Listing remarks MLS
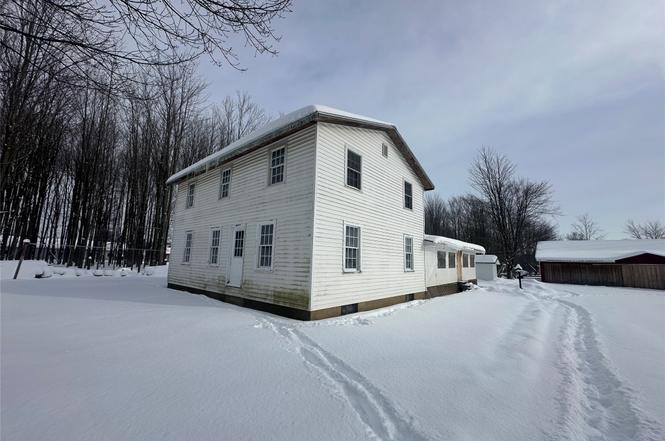
A beautiful setting for this 2788 sq. ft. 6 bedroom house with multiple outbuildings including a new 30' X 48' Pole Barn. Located on 4.581 acres with a wooded area and a fenced in area for horses. Includes 6 horse stalls, a chicken coup, and wonderful gardens. This home is ready for your heating, plumbing, and wiring additions. Priced to sell quickly.
Key facts
- Chicken coup
- Fenced in
- 4.581 acres
Tags
Property features AI
Exterior
- Parking: 10 parking spaces
- Utilities: Well water
- Home design: Single-family residence; One and one-half stories
- Construction: Block and vinyl siding construction; Metal roof
- Exterior features: Landscaped lot; Paved road access; Porch; Screened porch; Outbuilding
Interior
- Flooring: Other
- Heating & cooling: No heating; No cooling
- Interior features: Partial basement; 8 total rooms; Other flooring
Neighborhood map
What this means for you Summary
Snapshot
- This is a 1-bed/?-bath single-family listed at $120k.
Deal economics
- At list price, monthly cash flow is $-50 ($-604/yr) — negative.
- To cash-flow at today's rent, offer at most $111k (7.4% below list).
- To meet the 1% rule (rent ≥ 1% of price), the offer needs to be $95k (21.1% below list).
- Recommended offer: $95k (21.1% below list) — sets the bar for 1% rule.
- Cap rate 5.8% vs local median 4.3% in Conneaut — top-decile yield for the area; either an underpriced asset or a hidden risk that comps aren't pricing in. Stress-test before assuming the spread holds.
Location & tenants
- Location reads 63/100 on livability (#808 in OH) — a middle-class / working-renter tenant base. Strengths: cost of living A+, housing A+; Watch: schools C-, crime C-, health & safety D.
- Northwestern SD (town): math 35% / reading 48% proficiency, ranked #333 of 539 in PA (top 62%) — families likely to look elsewhere, expect single-tenant / working-renter base with shorter leases.
- Market conditions: 364 units permitted in Erie County in 2024 (188 in 5+ unit buildings).
- This rent is only 17% of the median local income ($68k/yr) — well below the 30% rent-burden line; pricing power to push rent on renewal without tenant pushback.
Forward outlook
- In year one you build about $13k of equity ($829 loan paydown + $12k appreciation (10.0% local appreciation)).
- Erie County population projected at -14% by 2050 — secular population decline; favor cash flow + early exit over multi-decade hold.
- At projected returns (10.0% appreciation + 3.0% rent growth), your $34k cash investment doubles in ~3 years — after that, you're playing with house money.
- By year 3, paydown + projected appreciation supports a ~$32k cash-out refi (75% LTV) — recoverable capital for the next deal without selling this one.
Negotiation context
- It's been on market 51 days — a 3% lower offer ($116k) is reasonable based on typical stale-listing flexibility.
- 3 sale attempts since 8y ago with the ask held roughly flat each time — persistent listings suggest the price (not the market) is what's stuck; bring a comps-based counter.
Questions for the listing agent
- What do current leases actually rent for vs. the listed asking? Can we see a recent rent roll and the last 12 months of T-12 income?
- It's been on market 51 days. Have you received any prior offers? Is the seller open to a 21% concession, seller financing, or rate buy-down credit?
- Is there a deadline driving the sale (1031 exchange, divorce, estate, relocation)? That informs how much negotiation room exists.
- The area grade is low — what's the realistic commute time and amenity access for the typical tenant pool here? Any planned neighborhood developments (good or bad) we should know about?
- What's the average days-on-market for RENTAL listings here right now (not sales)? A rising rental-DOM trend means longer vacancies and softer asking-rent achievability than the comps imply.
- What's the recent tenant-quality profile in this submarket — average credit score on applications, eviction rate, late-payment / NSF rate, and stable-employment percentage? A property-management company in the area should have these aggregated.
- How much new for-sale + rental construction is in the pipeline within 1–3 miles? Heavy new supply typically softens prices + rents 12–24 months out; constrained supply supports both.
Investment metrics
- 1% rule
- 0.79% ✗
- Cap rate
- 5.79%
- Cash-on-cash
- -1.80%
- DSCR
- 0.92
- GRM
- 10.6
CMA / ARV
No comps found within radius.
Projected returns pro-forma
10.0% appreciation · 3.0% rent growth · sell at horizon
- IRR
- 23.0%
- Equity multiple
- 2.85×
- Total profit
- $62,092
- Equity at exit
- $108,015
- IRR
- 20.5%
- Equity multiple
- 6.52×
- Total profit
- $185,361
- Equity at exit
- $232,939
Cash invested: $33,572 (down + closing). Projections, not guarantees.
Landlord ↔ Tenant lean methodology
- Overall (STATE)
- 73 Landlord-Friendly
- State Ohio
- 73 Landlord-Friendly · R+6
- County
- — inherits STATE
- City
- — inherits STATE
ZIP-level market 16401
- Home prices YoY
- 18.6%
- Price-to-rent
- 10.6×
Monthly cashflow live
- Estimated rent
- $946 medium interval (Pro) →
- Mortgage (P&I)
- −$629
- Tax from tax record
- −$119 /mo · $1,431/yr
- Insurance
- −$50
- HOA
- −$0
- Vacancy / Maint / Mgmt
- −$199
- Net cashflow
- $-50
Break-even live
Sensitivity live
| Price | -10% $18 | -5% $-16 | +0% $-50 | +5% $-84 | +10% $-118 |
|---|---|---|---|---|---|
| Rent | -10% $-125 | -5% $-88 | +0% $-50 | +5% $-13 | +10% $24 |
| Rate | -1.0pp $10 | -0.5pp $-20 | base $-50 | +0.5pp $-81 | +1.0pp $-113 |
UW: 25.0% down · 7.5% · 30yr · 1.5% tax · 5.0% vac · 8.0% maint · 8.0% mgmt
Financing live
Cash to close
- Down payment
- $29,975
- Closing costs
- $3,597
- Reserves months
- —
- Total cash needed
- —
Loan-product check · same deal, 3 products live
Conventional
25% down · 7.5% · 30yr
- Down + closing
- —
- Monthly P&I
- —
- Monthly cashflow
- —
- DSCR
- —
- Eligible?
- —
Personal DTI + credit; lowest rate.
DSCR
20% down · 8.5% · 30yr
- Down + closing
- —
- Monthly P&I
- —
- Monthly cashflow
- —
- DSCR
- —
- Eligible?
- —
No personal income docs; deal must DSCR.
Hard money
10% down · 12.0% · 12mo
- Down + closing
- —
- Monthly P&I
- —
- Monthly cashflow
- —
- DSCR
- —
- Eligible?
- —
Short-term bridge; refi at stabilization.
Listing history 8 events
-
2026-05-09status Pending
-
2026-04-23historical Active Under Contract
-
2026-04-07status Active
-
2026-02-17status Pending
-
2026-01-29$119,900 Active
-
2019-02-04soldstatus $107,000
-
2019-01-31soldstatus $107,000 353-char remark
Show marketing remark (353 chars)
A beautiful setting for this 2788 sq. ft. 6 bedroom house with multiple outbuildings including a new 30' X 48' Pole Barn. Located on 4.581 acres with a wooded area and a fenced in area for horses. Includes 6 horse stalls, a chicken coup, and wonderful gardens. This home is ready for your heating, plumbing, and wiring additions. Priced to sell quickly.
-
2018-06-05$109,900 353-char remark
Show marketing remark (353 chars)
A beautiful setting for this 2788 sq. ft. 6 bedroom house with multiple outbuildings including a new 30' X 48' Pole Barn. Located on 4.581 acres with a wooded area and a fenced in area for horses. Includes 6 horse stalls, a chicken coup, and wonderful gardens. This home is ready for your heating, plumbing, and wiring additions. Priced to sell quickly.
ⓘ Source: listings_history table (triggers on properties + properties_extension) + one-shot
backfill from property_details.listing_events for pre-trigger history.
Tax reassessment forecast OH · Partial reset (capped growth)
- Current annual tax
- $1,431 · $119/mo
- Projected year-2 tax
- $1,651 · $138/mo
- Expected delta
- +$220/yr (+$18/mo · 15.4%)
ⓘ Screening estimate from a state-policy table — verify with the county assessor before closing.
Climate risk First Street
- Flood 1/10 Low FEMA zone X (unshaded) · 0% chance over 30 yrs
- Wildfire 1/10 Low
- Heat 2/10 Low 7 d/yr ≥94°F today · 17 d/yr by 30 yrs out
- Wind 1/10 Low
- Air quality 3/10 Moderate 1 unhealthy d/yr today · 4 by 30 yrs out
Nearby sold comps map
Loading sold comps map…
Walkable amenities ~0.75 mi
Loading nearby amenities…
Taxation est. · year 1
- Rental income
- $11,357
- − Mortgage interest
- −$6,716
- − Property taxes
- −$1,431
- − Insurance
- −$600
- − Repairs & maintenance
- −$909
- − Management
- −$909
- − Depreciation
- −$3,488
- Taxable loss
- −$2,695
- Est. tax savings @ 24.0%
- +$647
- After-tax cash flow
- $43/yr
For passive investors: Depreciation is non-cash, so a rental often shows a tax loss while cash-flowing — sheltering income. Rental losses are passive: they offset passive income freely, and up to $25,000/yr can offset ordinary (W-2) income if you actively participate and your MAGI is under $100k (phasing out to $0 by $150k); unused losses carry forward. On sale, claimed depreciation is recaptured at up to 25%, and gains may owe capital-gains tax (a 1031 exchange can defer both). Figures are a year-1 estimate at your 24.0% rate — not tax advice; consult a CPA.
Schools (NCES district)
- District
- Northwestern SD
- NCES district ID
- 4217880
- Math proficiency
- 35% ▼ -24.00%
- Reading proficiency
- 48% ▼ -22.00%
- Median HH income
- $48,180
- Composite
- 35.51/100
- National rank
- #4912
- State rank
- #333 of 539 in PA
Livability — Conneaut
- Score
- 63/100
- State rank
- #808
- US rank
- #14907
Category grades
Schools grade is shown separately in the Schools card above.
Census & demographics
- County
- Erie · 78,232 people
- City population
- 16,317
- Metro
- Erie, PA
- Population (ZIP)
- 3,842
- Household income
- $67,976
- Rent vs Own
- Severe rent burden
- 3.3
Population outlook (Erie County) Hauer SSP2
- Today (2025)
- 272,159 people
- By 2030
- 266,299 · -2.2%
- By 2040
- 250,987 · -7.8%
- By 2050
- 234,925 · -13.7%
- By 2075
- 199,164 · -26.8%
- By 2100
- 162,985 · -40.1%
Race, ethnicity, and origin ACS 2023
- Neighborhood character
- Predominantly White (95%)
- Race & ethnicity
- White 95% Two or more races 4%
- Common ancestry
- Romanian 5% Lithuanian 4% Slovak 2%
- Foreign-born
- 2% · Canada
- Languages at home
- 99% English-only · German/W. Germanic 1%
Political lean MEDSL · Erie
- 2024 margin
- Toss-up / Even · D 49.0% · R 50.0%
- 2008→2024 swing
- -20.9pp toward R · 2008: 19.9pp · 2024: -1.0pp
- All cycles
- 2024: R+1.0 2020: D+1.0 2016: R+2.0 2012: D+16.9 2008: D+19.9
Not yet ingested
- Civics
- —
Market trends
- HPI YoY
- ▲ 36.45%
- Current HPI
- 232.9468
- Rent YoY
- —
- Metro
- —
- State GDP YoY
- ▲ 1.98%
- F500 in state
- 48
Industry mix (Fortune 500 HQ in OH)
| Industry | F500 HQs | Revenue |
|---|---|---|
| Insurance | 3 | $145B |
|
||
| Industrial Machinery | 3 | $49B |
|
||
| Financial Services | 3 | $24B |
|
||
| Consumer Goods | 2 | $93B |
|
||
| Aerospace / Defense | 2 | $47B |
|
||
| Utilities | 2 | $33B |
|
||
Price history
+9.1% since first listed8 events — show timeline
- 2026-05-09 Pending — GEBOR
- 2026-04-23 Contingent — GEBOR
- 2026-04-07 Relisted — GEBOR
- 2026-02-17 Pending — GEBOR
- 2026-01-29 Listed $119,900 GEBOR
- 2019-02-04 Sold (Public Records) $107,000 Public Records
- 2019-01-31 Sold (MLS) $107,000 GEBOR
- 2018-06-05 Listed $109,900 GEBOR
Property tax history
+3.2%/yrLatest (2026): $1,431 · +5.0% YoY. Source: county tax records.
Cash-flow waterfall
monthlySold comps — $/sqft
last 12 mo · ≤1 miLoading sold comps…