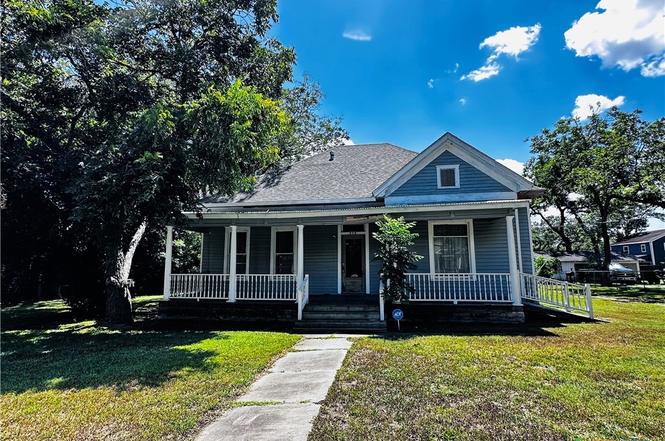
608 Coke St · Yoakum, TX
Flood risk 1/10 · Minimal
- FEMA flood zone
- X (unshaded)
- Chance of flooding over 30 yrs
- 0.0%
- Est. flood insurance / yr
- $507 – $1,088
Fire risk 5/10 · Moderate
- Est. fire insurance / yr
- $1,222 – $2,270
Heat risk 8/10 · Major
- Hot days now (above 110°F)
- 6 days/yr
- Hot days in 30 yrs
- 18 days/yr
Wind risk 8/10 · Major
- Chance of severe wind over 30 yrs
- 99.0%
Air-quality risk 1/10 · Minimal
- Unhealthy air days now
- 0 days/yr
- Unhealthy air days in 30 yrs
- 0 days/yr
Risk factors via First Street. Map © Google.
Why this score? — see what drove the B- grade
The composite is a weighted blend of 9 inputs, each scored 0–100. Each bar is that input's sub-score; the figure is the points it added to the 100-point composite (weight × sub-score).
- Cash flow +30.0/30.0
- 1% rule +10.0/10.0
- DSCR +10.0/10.0
- ARV discount +7.5/15.0
- Schools +3.8/10.0
- Livability +3.4/5.0
- Rent growth +2.5/5.0
- Condition / age +2.5/5.0
- Appreciation +0.0/10.0
$99,000
🖨 Deal sheet 📄 Offer letter ✓ Due diligence
Listing remarks
Step into timeless charm with this beautiful historic home on Yoakum’s iconic Coke Street. Offering 3 bedrooms and 2 baths, this property blends the grace of the past with today’s comforts. Inside, you’ll find a formal dining room perfect for gatherings, a gas range for the home chef, primary suite apart from the other bedrooms, and stunning vintage details such as folding doors between the dining and living room and a built-in china cabinet. The character of yesteryear shines through, creating a warm, welcoming atmosphere. Modern upgrades include a Generac generator to ensure uninterrupted power, wiring for ADT security, and a roof just one year old. Yoakum is perfectly s
Key facts
- Formal dining room
- Vintage details
- Primary suite
Tags
Neighborhood map
What this means for you Summary
Snapshot
- This is a 3-bed/2.0-bath single-family listed at $99k.
Deal economics
- At list price, monthly cash flow is $430 ($5k/yr) — positive.
- The deal already cash-flows at list — no discount required.
- Meets the 1% rule at list price ($2k rent vs $99k).
- Recommended offer: $87k (12.0% below list) — sets the bar for market timing.
- Cap rate 11.5% vs local median 4.3% in Yoakum — top-decile yield for the area; either an underpriced asset or a hidden risk that comps aren't pricing in. Stress-test before assuming the spread holds.
Location & tenants
- Location reads 68/100 on livability (#494 in TX) — a middle-class / working-renter tenant base. Strengths: cost of living A+, housing A+, health & safety A+; Watch: schools D+, amenities F, commute F.
- Yoakum ISD (town): math 48% / reading 42% proficiency, ranked #278 of 826 in TX (top 34%) — families likely to look elsewhere, expect single-tenant / working-renter base with shorter leases; 67% free/reduced lunch — lower-income household profile, screen leases tightly.
- Market conditions: 111 active listings in the ZIP; 1 comparable units currently listed for rent nearby; 9 units permitted in Lavaca County in 2024 (0 in 5+ unit buildings).
Forward outlook
- Local home prices are declining (-3.0%/yr); year-one equity from $684 of loan paydown is wiped out by about $3k of value loss. Plan a longer hold.
- Lavaca County population projected at +22% by 2050 — long-run rental-demand tailwind backs the buy-and-hold thesis.
- At projected returns (-3.0% appreciation + 3.0% rent growth), your $28k cash investment doubles in ~7 years — after that, you're playing with house money.
Negotiation context
- It's been on market 241 days — a 12% lower offer ($87k) is reasonable based on typical stale-listing flexibility.
- Current owner paid $20k; list at $99k implies a 396% gain — meaningful room to come down on a strong offer.
Risks & watch-outs
- Watch-outs: built in 1956 — expect roof / HVAC / electrical / plumbing capex.
- Climate carrying-cost: severe wind risk, 99% chance of damaging wind over 30y; moderate wildfire risk; extreme-heat days projected 6→18/yr by 2055 (HVAC capex compounding) — expect insurance premiums to compound above CPI over the hold.
Questions for the listing agent
- It's been on market 241 days. Have you received any prior offers? Is the seller open to a 12% concession, seller financing, or rate buy-down credit?
- Built in 1956 — when were the roof, HVAC, electrical panel, plumbing, and water heater last replaced?
- Why hasn't it sold? Are there any deal-killer items the seller is aware of (foundation, flood, title, zoning, code violations)?
- Is there a deadline driving the sale (1031 exchange, divorce, estate, relocation)? That informs how much negotiation room exists.
- Schools are D-rated, which usually means shorter tenancies and higher turnover. Who's the typical renter profile here, and what's been the actual vacancy rate?
- What's the average days-on-market for RENTAL listings here right now (not sales)? A rising rental-DOM trend means longer vacancies and softer asking-rent achievability than the comps imply.
- What's the recent tenant-quality profile in this submarket — average credit score on applications, eviction rate, late-payment / NSF rate, and stable-employment percentage? A property-management company in the area should have these aggregated.
- How much new for-sale + rental construction is in the pipeline within 1–3 miles? Heavy new supply typically softens prices + rents 12–24 months out; constrained supply supports both.
Investment metrics
- 1% rule
- 1.52% ✓
- Cap rate
- 11.51%
- Cash-on-cash
- 18.61%
- DSCR
- 1.83
- GRM
- 5.5
CMA / ARV
- ARV (on-the-fly)
- $205,380
- Comps found
- 5
Show comp detail 5 sales within ~0.75 mi
| Address | Dist | Beds/Ba | Sqft | Sold | Price | $/sf | Match |
|---|---|---|---|---|---|---|---|
| 608 Coke St | 0.00mi | 3/2.0 | 1,956 (0%) | 1mo | $99,000 | $51 | 100 |
| 408 Walnut St | 0.11mi | 3/2.0 | 1,892 (-3%) | 2mo | $199,000 | $105 | 88 |
| 212 Coke St | 0.25mi | 3/2.5 | 1,728 (-12%) | 6mo | $243,500 | $141 | 62 |
| 513 Kent St | 0.42mi | 3/1.5 | 1,819 (-7%) | 8mo | $232,000 | $128 | 60 |
| 209 Rose St | 0.62mi | 3/1.0 | 1,798 (-8%) | 4mo | $125,000 | $70 | 50 |
Match score weights: distance 35% · size 25% · config 20% · recency 20%. Top-matched comps best support the ARV.
Projected returns pro-forma
-3.0% appreciation · 3.0% rent growth · sell at horizon
- IRR
- 10.4%
- Equity multiple
- 1.41×
- Total profit
- $11,411
- Equity at exit
- $14,761
- IRR
- 19.5%
- Equity multiple
- 2.64×
- Total profit
- $45,471
- Equity at exit
- $8,560
Cash invested: $27,720 (down + closing). Projections, not guarantees.
Landlord ↔ Tenant lean methodology
- Overall (STATE)
- 87 Strongly Landlord-Friendly
- State Texas
- 87 Strongly Landlord-Friendly · R+5
- County
- — inherits STATE
- City
- — inherits STATE
ZIP-level market 77995
- Home prices YoY
- -20.5%
- Active inventory
- 111
- Price-to-rent
- 5.5×
Monthly cashflow live
- Estimated rent
- $1,500 medium interval (Pro) →
- Mortgage (P&I)
- −$519
- Tax from tax record
- −$195 /mo · $2,335/yr
- Insurance
- −$41
- HOA
- −$0
- Vacancy / Maint / Mgmt
- −$315
- Net cashflow
- $430
Break-even live
UW: 25.0% down · 7.5% · 30yr · 1.5% tax · 5.0% vac · 8.0% maint · 8.0% mgmt
Financing live
Cash to close
- Down payment
- $24,750
- Closing costs
- $2,970
- Reserves months
- —
- Total cash needed
- —
Loan-product check · same deal, 3 products live
Conventional
25% down · 7.5% · 30yr
- Down + closing
- —
- Monthly P&I
- —
- Monthly cashflow
- —
- DSCR
- —
- Eligible?
- —
Personal DTI + credit; lowest rate.
DSCR
20% down · 8.5% · 30yr
- Down + closing
- —
- Monthly P&I
- —
- Monthly cashflow
- —
- DSCR
- —
- Eligible?
- —
No personal income docs; deal must DSCR.
Hard money
10% down · 12.0% · 12mo
- Down + closing
- —
- Monthly P&I
- —
- Monthly cashflow
- —
- DSCR
- —
- Eligible?
- —
Short-term bridge; refi at stabilization.
Rent comps 1 comps
| Address | Beds | Baths | Sqft | Rent | $/sqft | DOM | Units | Dist |
|---|---|---|---|---|---|---|---|---|
| 401 Walnut St Yoakum, TX | 3.0 | 2.0 | 1548 | $1,500 | $0.97 | 43d | 1 | 0.15mi |
Listing history 10 events
-
2026-05-13status Pending
-
2026-04-13status Pending
-
2026-04-13historical
-
2026-03-30price $99,000
-
2026-03-16price $120,000
-
2025-12-08price $134,999
-
2025-10-28price $149,998
-
2025-08-15$149,999 Active
-
2025-07-03soldstatus
-
1990-08-27soldstatus $19,957
ⓘ Source: listings_history table (triggers on properties + properties_extension) + one-shot
backfill from property_details.listing_events for pre-trigger history.
Tax reassessment forecast TX · Resets to sale price
- Current annual tax
- $2,335 · $195/mo
- Projected year-2 tax
- $2,335 · $195/mo
- Expected delta
- $0/yr ($0/mo · 0.0%)
ⓘ Screening estimate from a state-policy table — verify with the county assessor before closing.
Climate risk First Street
- Flood 1/10 Low FEMA zone X (unshaded) · 0% chance over 30 yrs
- Wildfire 5/10 Major
- Heat 8/10 Severe 6 d/yr ≥110°F today · 18 d/yr by 30 yrs out
- Wind 8/10 Severe 99% chance of damaging wind over 30 yrs
- Air quality 1/10 Low 0 unhealthy d/yr today · 0 by 30 yrs out
Nearby sold comps map
Loading sold comps map…
Walkable amenities ~0.75 mi
Loading nearby amenities…
Taxation est. · year 1
- Rental income
- $18,000
- − Mortgage interest
- −$5,546
- − Property taxes
- −$2,335
- − Insurance
- −$495
- − Repairs & maintenance
- −$1,440
- − Management
- −$1,440
- − Depreciation
- −$2,880
- Taxable income
- $3,864
- Est. tax owed @ 24.0%
- −$927
- After-tax cash flow
- $4,233/yr
For passive investors: Depreciation is non-cash, so a rental often shows a tax loss while cash-flowing — sheltering income. Rental losses are passive: they offset passive income freely, and up to $25,000/yr can offset ordinary (W-2) income if you actively participate and your MAGI is under $100k (phasing out to $0 by $150k); unused losses carry forward. On sale, claimed depreciation is recaptured at up to 25%, and gains may owe capital-gains tax (a 1031 exchange can defer both). Figures are a year-1 estimate at your 24.0% rate — not tax advice; consult a CPA.
Schools (NCES district)
- District
- Yoakum ISD
- NCES district ID
- 4846620
- Math proficiency
- 48% ▲ 6.00%
- Reading proficiency
- 42% ▲ 5.00%
- Median HH income
- $41,854
- Composite
- 37.9/100
- National rank
- #4315
- State rank
- #278 of 826 in TX
Livability — Yoakum
- Score
- 68/100
- State rank
- #494
- US rank
- #9889
Category grades
Schools grade is shown separately in the Schools card above.
Census & demographics
- Census place
- Yoakum, TX
- Population (ZIP)
- 10,244
Population outlook (Lavaca County) Hauer SSP2
- Today (2025)
- 21,154 people
- By 2030
- 21,961 · +3.8%
- By 2040
- 23,800 · +12.5%
- By 2050
- 25,908 · +22.5%
- By 2075
- 32,118 · +51.8%
- By 2100
- 35,273 · +66.7%
Race, ethnicity, and origin ACS 2023
- Neighborhood character
- Diverse neighborhood (Simpson 0.57)
- Race & ethnicity
- White 54% Hispanic / Latino 37% Two or more races 14% Black 5%
- Hispanic origin (detail)
- Mexican 33%
- Common ancestry
- Serbian 4% Romanian 1% Lithuanian 1%
- Foreign-born
- 9% · Canada
- Languages at home
- 80% English-only · Spanish 18% Vietnamese 1% Russian/Polish/Slavic 1%
Political lean MEDSL · Lavaca
- 2024 margin
- Solid R (+76.1) · D 11.8% · R 87.9%
- 2008→2024 swing
- -22.3pp toward R · 2008: -53.8pp · 2024: -76.1pp
- All cycles
- 2024: R+76.1 2020: R+73.3 2016: R+71.5 2012: R+64.8 2008: R+53.8
Not yet ingested
- Civics
- —
Market trends
- HPI YoY
- ▼ -46.35%
- Current HPI
- 179.2583
- Rent YoY
- —
- Metro
- —
- State GDP YoY
- ▲ 3.95%
- F500 in state
- 110
Industry mix (Fortune 500 HQ in TX)
| Industry | F500 HQs | Revenue |
|---|---|---|
| Energy | 16 | $1,198B |
|
||
| Technology | 5 | $198B |
|
||
| Engineering / Construction | 4 | $72B |
|
||
| Energy Services | 3 | $60B |
|
||
| Utilities | 3 | $41B |
|
||
| Healthcare | 2 | $330B |
|
||
Price history
+396.1% since first listed10 events — show timeline
- 2026-05-13 Pending — CTXMLS
- 2026-04-13 Pending — CTXMLS
- 2026-04-13 Listing Removed — CTXMLS
- 2026-03-30 Price Changed $99,000 CTXMLS
- 2026-03-16 Price Changed $120,000 CTXMLS
- 2025-12-08 Price Changed $134,999 CTXMLS
- 2025-10-28 Price Changed $149,998 CTXMLS
- 2025-08-15 Listed $149,999 CTXMLS
- 2025-07-03 Sold (Public Records) — Public Records
- 1990-08-27 Sold (Public Records) $19,957 Public Records
Property tax history
+7.9%/yrLatest (2025): $2,335 · +4.6% YoY. Source: county tax records.
Cash-flow waterfall
monthlySold comps — $/sqft
last 12 mo · ≤1 miLoading sold comps…