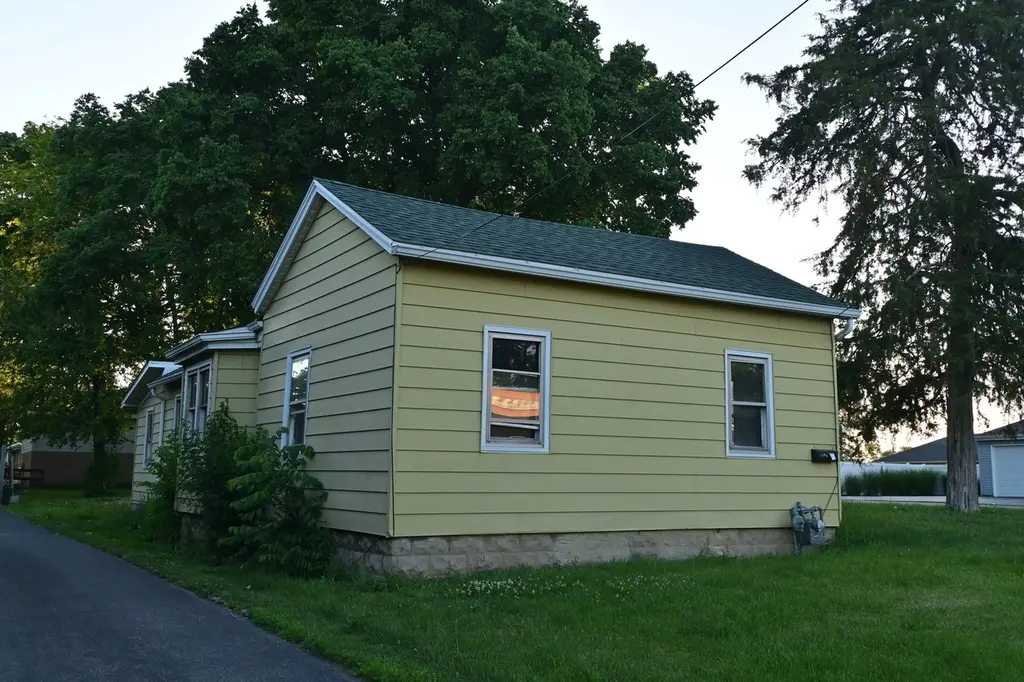
1346 N Division St · Morris, IL
Flood risk 1/10 · Minimal
- FEMA flood zone
- X (unshaded)
- Chance of flooding over 30 yrs
- 0.0%
- Est. flood insurance / yr
- $473 – $860
Fire risk 3/10 · Minor
- Est. fire insurance / yr
- $804 – $1,492
Heat risk 3/10 · Minor
- Hot days now (above 102°F)
- 7 days/yr
- Hot days in 30 yrs
- 16 days/yr
Wind risk 2/10 · Minimal
- Chance of severe wind over 30 yrs
- 1.0%
Air-quality risk 2/10 · Minimal
- Unhealthy air days now
- 1 days/yr
- Unhealthy air days in 30 yrs
- 2 days/yr
Risk factors via First Street. Map © Google.
Why this score? — see what drove the B- grade
The composite is a weighted blend of 9 inputs, each scored 0–100. Each bar is that input's sub-score; the figure is the points it added to the 100-point composite (weight × sub-score).
- Cash flow +30.0/30.0
- DSCR +10.0/10.0
- 1% rule +9.6/10.0
- ARV discount +7.5/15.0
- Livability +3.7/5.0
- Schools +2.7/10.0
- Rent growth +2.5/5.0
- Condition / age +2.5/5.0
- Appreciation +0.0/10.0
$109,000
🖨 Deal sheet 📄 Offer letter ✓ Due diligence
Listing remarks
Fixer upper/ Handy Man Special! Conveniently located right off Route 47 in Morris, this property is ready for some TLC. Featuring 3 beds, 1 bath, and around 1,150 Sq. Feet of potential rehabbed space. New roof in 2025, Water heater 2025. Central ductwork, and a central air furnace in the Cellar area. If you are looking for a great single family rental, and/or investment opportunity in our growing area, don't pass this up! The parcel itself is a deep lot; Aprox 243 Ft. Deep. .. Plenty of back yard space! Contact your favorite agent today to schedule a showing!
Key facts
- Central ductwork
- Back yard space
- Deep lot
Tags
Property features AI
Finance
- Other: Lot dimensions approximately 243 x 46 (lot estimated .25–.49 acre); Living area source: assessor; Directions: turn west into gravel driveway off Rt. 47
- HOA & community: No master association fee required
Exterior
- Parking: Gravel parking for 2 vehicles
- Utilities: Public water; Public sewer; 100 amp electric service
- Home design: Detached single-family home; One-story; Fee simple ownership; Property over 100 years old; Built before 1978
- Construction: Aluminum siding; Asphalt roof; Block foundation
- Exterior features: School bus service
Interior
- Kitchen: Kitchen on the main level (12 x 13)
- Bedrooms: 3 bedrooms (all on the main level); Master bedroom on the main level
- Bathrooms: 1 full bathroom
- Heating & cooling: Natural gas heat
- Interior features: 5 total rooms; Cellar (partial)
- Laundry & utility: Main-level laundry (4 x 5); Gas and electric dryer hookups
Neighborhood map
What this means for you Summary
Snapshot
- This is a 3-bed/1.0-bath single-family listed at $109k.
Deal economics
- At list price, monthly cash flow is $425 ($5k/yr) — positive.
- The deal already cash-flows at list — no discount required.
- Meets the 1% rule at list price ($2k rent vs $109k).
- Cap rate 11.0% vs local median 3.5% in Morris — top-decile yield for the area; either an underpriced asset or a hidden risk that comps aren't pricing in. Stress-test before assuming the spread holds.
Location & tenants
- Location reads 74/100 on livability (#248 in IL, #4,532 nationally) — a middle-class / working-renter tenant base. Strengths: housing A+, health & safety A+, cost of living A; Watch: amenities F, commute F.
- Morris Chsd 101 (town): math 30% / reading 31% proficiency, ranked #230 of 620 in IL (top 37%) — families likely to look elsewhere, expect single-tenant / working-renter base with shorter leases.
- Zoned schools: Morris Community High School (math 30% / reading 31%, grade F, #175 of 693 statewide, top 26%, 946 students, 0% FRL).
- Market conditions: 100 active listings in the ZIP; 5 comparable units currently listed for rent nearby; rentals leasing fast (median 3d on market — plan ~1-2 weeks tenant-placement turnaround); solid renter incomes; 84 units permitted in Grundy County in 2024 (0 in 5+ unit buildings).
Forward outlook
- Local home prices are declining (-3.0%/yr); year-one equity from $754 of loan paydown is wiped out by about $3k of value loss. Plan a longer hold.
- Grundy County population projected to shrink 9% by 2050 — rents likely to lag national; underwrite the cash flow, not the appreciation.
- At projected returns (-3.0% appreciation + 3.0% rent growth), your $31k cash investment doubles in ~8 years — after that, you're playing with house money.
Negotiation context
- Only 4 days on market — expect competitive offers; lowballing is unlikely to land.
Risks & watch-outs
- Watch-outs: built in 1905 — expect roof / HVAC / electrical / plumbing capex.
Questions for the listing agent
- Built in 1905 — when were the roof, HVAC, electrical panel, plumbing, and water heater last replaced?
- Is there a deadline driving the sale (1031 exchange, divorce, estate, relocation)? That informs how much negotiation room exists.
- What's the average days-on-market for RENTAL listings here right now (not sales)? A rising rental-DOM trend means longer vacancies and softer asking-rent achievability than the comps imply.
- What's the recent tenant-quality profile in this submarket — average credit score on applications, eviction rate, late-payment / NSF rate, and stable-employment percentage? A property-management company in the area should have these aggregated.
- How much new for-sale + rental construction is in the pipeline within 1–3 miles? Heavy new supply typically softens prices + rents 12–24 months out; constrained supply supports both.
Investment metrics
- 1% rule
- 1.46% ✓
- Cap rate
- 10.98%
- Cash-on-cash
- 16.73%
- DSCR
- 1.74
- GRM
- 5.7
CMA / ARV
- ARV (on-the-fly)
- $255,302
- Comps found
- 12
Show comp detail 12 sales within ~0.75 mi
| Address | Dist | Beds/Ba | Sqft | Sold | Price | $/sf | Match |
|---|---|---|---|---|---|---|---|
| 1238 Wauponsee St | 0.26mi | 4/1.5 (+1) | 1,120 (-6%) | 1mo | $239,900 | $214 | 70 |
| 1264 Wauponsee St | 0.24mi | 3/1.5 | 1,274 (+7%) | 8mo | $230,000 | $181 | 69 |
| 1122 Grant St | 0.30mi | 3/1.0 | 1,274 (+7%) | 9mo | $230,000 | $181 | 68 |
| 822 Douglas St | 0.62mi | 3/2.0 | 1,208 (+1%) | 0mo | $260,822 | $216 | 65 |
| 1429 Water St | 0.23mi | 3/1.0 | 1,040 (-13%) | 4mo | $222,000 | $213 | 65 |
| 327 Robinson Dr | 0.23mi | 3/1.0 | 1,040 (-13%) | 8mo | $225,000 | $216 | 61 |
| 809 Douglas St | 0.63mi | 3/2.0 | 1,212 (+2%) | 5mo | $256,000 | $211 | 60 |
| 750 E Benton St | 0.62mi | 3/2.0 | 1,245 (+4%) | 7mo | $263,000 | $211 | 54 |
| 1038 Kiersted St | 0.32mi | 3/2.0 | 1,340 (+12%) | 10mo | $300,000 | $224 | 52 |
| 511 Armstrong St | 0.43mi | 4/2.0 (+1) | 1,321 (+11%) | 2mo | $285,000 | $216 | 51 |
| 831 Douglas St | 0.67mi | 2/1.0 (-1) | 1,100 (-8%) | 2mo | $201,000 | $183 | 49 |
| 744 E Benton St | 0.61mi | 3/1.0 | 1,040 (-13%) | 3mo | $227,250 | $219 | 47 |
Match score weights: distance 35% · size 25% · config 20% · recency 20%. Top-matched comps best support the ARV.
Projected returns pro-forma
-3.0% appreciation · 3.0% rent growth · sell at horizon
- IRR
- 7.9%
- Equity multiple
- 1.31×
- Total profit
- $9,504
- Equity at exit
- $16,252
- IRR
- 17.2%
- Equity multiple
- 2.42×
- Total profit
- $43,461
- Equity at exit
- $9,424
Cash invested: $30,520 (down + closing). Projections, not guarantees.
Landlord ↔ Tenant lean methodology
- Overall (STATE)
- 43 Moderately Tenant-Leaning
- State Illinois
- 43 Moderately Tenant-Leaning · D+7
- County
- — inherits STATE
- City
- — inherits STATE
ZIP-level market 60450
- Active inventory
- 100
- Price-to-rent
- 5.7×
Monthly cashflow live
- Estimated rent
- $1,593 high interval (Pro) →
- Mortgage (P&I)
- −$572
- Tax from tax record
- −$216 /mo · $2,597/yr
- Insurance
- −$45
- HOA
- −$0
- Vacancy / Maint / Mgmt
- −$335
- Net cashflow
- $425
Break-even live
UW: 25.0% down · 7.5% · 30yr · 1.5% tax · 5.0% vac · 8.0% maint · 8.0% mgmt
Financing live
Cash to close
- Down payment
- $27,250
- Closing costs
- $3,270
- Reserves months
- —
- Total cash needed
- —
Loan-product check · same deal, 3 products live
Conventional
25% down · 7.5% · 30yr
- Down + closing
- —
- Monthly P&I
- —
- Monthly cashflow
- —
- DSCR
- —
- Eligible?
- —
Personal DTI + credit; lowest rate.
DSCR
20% down · 8.5% · 30yr
- Down + closing
- —
- Monthly P&I
- —
- Monthly cashflow
- —
- DSCR
- —
- Eligible?
- —
No personal income docs; deal must DSCR.
Hard money
10% down · 12.0% · 12mo
- Down + closing
- —
- Monthly P&I
- —
- Monthly cashflow
- —
- DSCR
- —
- Eligible?
- —
Short-term bridge; refi at stabilization.
Rent comps 5 comps
| Address | Beds | Baths | Sqft | Rent | $/sqft | DOM | Units | Dist |
|---|---|---|---|---|---|---|---|---|
| 714 E Jackson St Unit 1 Morris, IL | 2.0 | 1.0 | 868 | $1,700 | $1.96 | 1d | 1 | 0.72mi |
| 416 1/2 W Jackson St Morris, IL | 3.0 | 1.0 | 1230 | $1,600 | $1.30 | 18d | 1 | 0.75mi |
| 2405 Ashland Cir Unit 9 Morris, IL | 2.0 | 1.0 | 900 | $1,400 | $1.56 | 3d | 1 | 0.99mi |
| 2405 Ashland Cir Morris, IL | 2.0 | 1.0 | 900 | $1,400 | $1.56 | 1d | 1 | 0.99mi |
| 241 Ottawa Bend Dr Morris, IL | 2.0 | 1.0 | 900 | $1,425 | $1.58 | 15d | 1 | 1.18mi |
Listing history 4 events
-
2026-06-08statusdays on market $109,000 Pending 4 DOM
-
2026-06-07days on market $109,000 Active 3 DOM
-
2026-06-04remarks 571-char remark
-
2026-06-04$109,000 Active 1 DOM
ⓘ Source: listings_history table (triggers on properties + properties_extension) + one-shot
backfill from property_details.listing_events for pre-trigger history.
Tax reassessment forecast IL · Partial reset (capped growth)
- Current annual tax
- $2,597 · $216/mo
- Projected year-2 tax
- $2,597 · $216/mo
- Expected delta
- $0/yr ($0/mo · 0.0%)
ⓘ Screening estimate from a state-policy table — verify with the county assessor before closing.
Climate risk First Street
- Flood 1/10 Low FEMA zone X (unshaded) · 0% chance over 30 yrs
- Wildfire 3/10 Moderate
- Heat 3/10 Moderate 7 d/yr ≥102°F today · 16 d/yr by 30 yrs out
- Wind 2/10 Low 100% chance of damaging wind over 30 yrs
- Air quality 2/10 Low 1 unhealthy d/yr today · 2 by 30 yrs out
Nearby sold comps map
Loading sold comps map…
Walkable amenities ~0.75 mi
Loading nearby amenities…
Taxation est. · year 1
- Rental income
- $19,122
- − Mortgage interest
- −$6,106
- − Property taxes
- −$2,597
- − Insurance
- −$545
- − Repairs & maintenance
- −$1,530
- − Management
- −$1,530
- − Depreciation
- −$3,171
- Taxable income
- $3,643
- Est. tax owed @ 24.0%
- −$874
- After-tax cash flow
- $4,230/yr
For passive investors: Depreciation is non-cash, so a rental often shows a tax loss while cash-flowing — sheltering income. Rental losses are passive: they offset passive income freely, and up to $25,000/yr can offset ordinary (W-2) income if you actively participate and your MAGI is under $100k (phasing out to $0 by $150k); unused losses carry forward. On sale, claimed depreciation is recaptured at up to 25%, and gains may owe capital-gains tax (a 1031 exchange can defer both). Figures are a year-1 estimate at your 24.0% rate — not tax advice; consult a CPA.
Schools (NCES district)
- District
- Morris Chsd 101
- NCES district ID
- 1726640
- Math proficiency
- 30% ▼ -12.00%
- Reading proficiency
- 31% ▼ -6.00%
- Median HH income
- $57,178
- Composite
- 27.31/100
- National rank
- #6995
- State rank
- #230 of 620 in IL
Livability — Morris
- Score
- 74/100
- State rank
- #248
- US rank
- #4532
Category grades
Schools grade is shown separately in the Schools card above.
Census & demographics
- Census place
- Morris, IL
- County
- Grundy County · 20,783 people
- City population
- 20,783
- Metro
- Chicago-Naperville-Elgin, IL-IN-WI
- Population (ZIP)
- 20,783
- Household income
- $81,777
- Rent vs Own
- Severe rent burden
- 722.0
Population outlook (Grundy County) Hauer SSP2
- Today (2025)
- 50,716 people
- By 2030
- 50,218 · -1.0%
- By 2040
- 48,599 · -4.2%
- By 2050
- 46,212 · -8.9%
- By 2075
- 40,033 · -21.1%
- By 2100
- 32,966 · -35.0%
Race, ethnicity, and origin ACS 2023
- Neighborhood character
- Predominantly White (85%)
- Race & ethnicity
- White 85% Hispanic / Latino 9% Two or more races 7% Black 2%
- Hispanic origin (detail)
- Mexican 8%
- Common ancestry
- Portuguese 10% Romanian 7% Iranian 2%
- Foreign-born
- 4% · Canada
- Languages at home
- 91% English-only · Spanish 6% Tagalog/Filipino 1% Other Indo-European 1%
Political lean MEDSL · Grundy
- 2024 margin
- Strong R (+29.6) · D 34.5% · R 64.0% · Other 1.5%
- 2008→2024 swing
- -31.3pp toward R · 2008: 1.7pp · 2024: -29.6pp
- All cycles
- 2024: R+29.6 2020: R+25.8 2016: R+23.6 2012: R+9.0 2008: D+1.7
Not yet ingested
- Civics
- —
Market trends
- HPI YoY
- ▼ -144.59%
- Current HPI
- 159.5402
- Rent YoY
- —
- Metro
- Chicago-Naperville-Elgin, IL-IN-WI
- State GDP YoY
- ▲ 1.59%
- F500 in state
- 60
Industry mix (Fortune 500 HQ in IL)
| Industry | F500 HQs | Revenue |
|---|---|---|
| Insurance | 4 | $201B |
|
||
| Consumer Goods | 4 | $87B |
|
||
| Industrial Machinery | 3 | $64B |
|
||
| Healthcare | 2 | $55B |
|
||
| Retail / Pharmacy | 1 | $148B |
|
||
| Agriculture / Food | 1 | $86B |
|
||
Price history
1 event — show timeline
- 2026-06-04 Listed $109,000 MRED as Distributed by MLS Grid
Property tax history
+4.0%/yrLatest (2024): $2,597 · +5.9% YoY. Source: county tax records.
Cash-flow waterfall
monthlySold comps — $/sqft
last 12 mo · ≤1 miLoading sold comps…