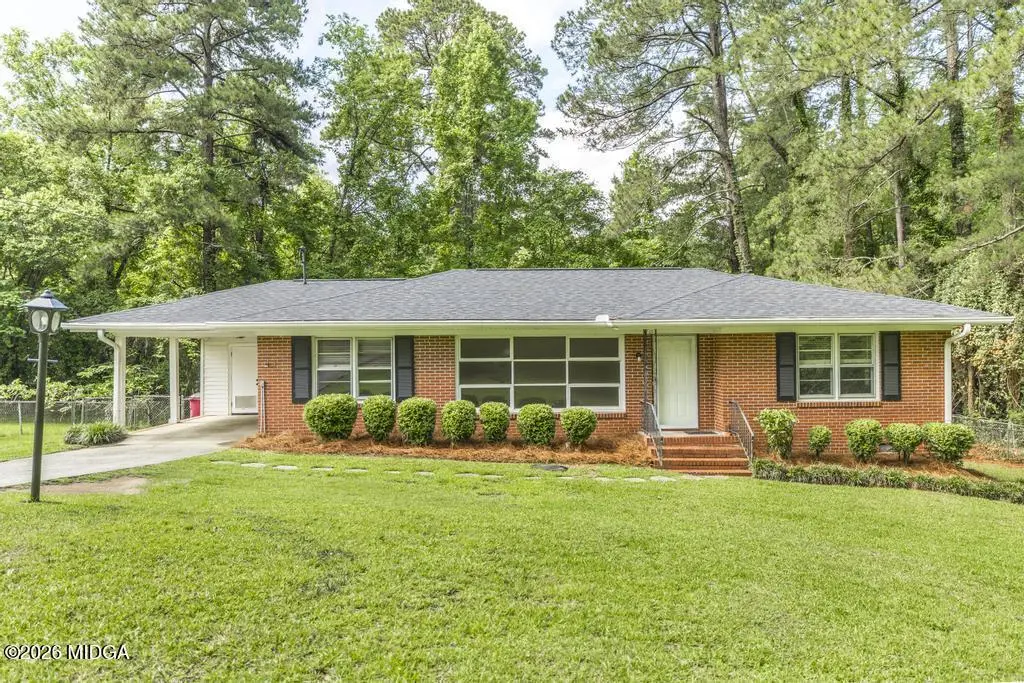
770 Winchester Cir · Macon-Bibb County, GA
Flood risk 1/10 · Minimal
- FEMA flood zone
- X (unshaded)
- Chance of flooding over 30 yrs
- 0.0%
- Est. flood insurance / yr
- $507 – $1,088
Fire risk 1/10 · Minimal
- Est. fire insurance / yr
- $963 – $1,789
Heat risk 7/10 · Major
- Hot days now (above 108°F)
- 7 days/yr
- Hot days in 30 yrs
- 17 days/yr
Wind risk 6/10 · Moderate
- Chance of severe wind over 30 yrs
- 63.0%
Air-quality risk 4/10 · Minor
- Unhealthy air days now
- 3 days/yr
- Unhealthy air days in 30 yrs
- 5 days/yr
Risk factors via First Street. Map © Google.
Why this score? — see what drove the F grade
The composite is a weighted blend of 9 inputs, each scored 0–100. Each bar is that input's sub-score; the figure is the points it added to the 100-point composite (weight × sub-score).
- Cash flow +13.6/30.0
- DSCR +4.1/10.0
- 1% rule +3.0/10.0
- Rent growth +2.9/5.0
- ARV discount +2.7/15.0
- Livability +2.5/5.0
- Condition / age +2.5/5.0
- Schools +1.2/10.0
- Appreciation +0.0/10.0
$169,900
🖨 Deal sheet 📄 Offer letter ✓ Due diligence
Listing remarks MLS
Super cute, affordable, and move-in ready! This all-brick, one-level home is located in the well-established Wimbish Woods neighborhood and offers newly refinished hardwood floors and fresh paint throughout. With 3 bedrooms, 1.5 baths, and 1,280 square feet, there's plenty to love, including carport parking and a fenced backyard. Major updates include a 3-year-old roof, 2021 water heater, and 2014 HVAC. Great curb appeal, solid updates, and exceptional value--schedule your private tour today!
Key facts
- 2021 water heater
- Carport parking
- Fenced backyard
Tags
Property features AI
Finance
- Other: Home warranty included
- HOA & community: No HOA
Exterior
- Parking: Attached carport
- Utilities: Public water; Public sewer (sewer connected)
- Home design: Single-family house; One story; Resale property
- Construction: Built in 1955; Brick construction; Composition roof; Crawl space foundation
- Exterior features: Backyard; Chain-link fencing; Level lot
Interior
- Kitchen: Dishwasher; Garbage disposal
- Bedrooms: 3 bedrooms (all on the main level)
- Flooring: Hardwood
- Bathrooms: 1 full bathroom; 1 half bathroom (1.5 total)
- Heating & cooling: Central heating (natural gas); Central air conditioning
- Interior features: One-level living; Crawl space basement; Dishwasher; Disposal; In-garage laundry; Hardwood flooring; No fireplace
- Laundry & utility: Laundry located in the garage
Neighborhood map
What this means for you Summary
Snapshot
- This is a 2-bed/1.5-bath single-family listed at $170k.
Deal economics
- At list price, monthly cash flow is $8 ($94/yr) — positive.
- The deal already cash-flows at list — no discount required.
- To meet the 1% rule (rent ≥ 1% of price), the offer needs to be $135k (20.5% below list).
- Recommended offer: $135k (20.5% below list) — sets the bar for 1% rule.
Location & tenants
- Location reads: area grade F — affects rentability + tenant quality, not the cash-flow math above.
- Bibb County (urban): math 11% / reading 18% proficiency, ranked #161 of 174 in GA (top 92%) — low school quality limits family demand, transient renter base, plan for 1-2y turnover; 75% free/reduced lunch — lower-income household profile, screen leases tightly.
- Zoned schools: Howard High School (math 2% / reading 5%, grade F, #413 of 424 statewide, top 99%, 1,076 students, 100% FRL) — zoned schools average 100% FRL vs 75% district-wide (25 pts higher); higher-poverty schools than district average — tighter screening recommended.
- Market conditions: Rents rising (+1.7%/yr); 235 active listings in the ZIP; 17 comparable units currently listed for rent nearby; rentals at typical pace (median 21d on market — plan ~3-4 weeks tenant-placement turnaround); 41% of comp listings sitting > 30 days — soft ceiling on asking rent; solid renter incomes; 154 units permitted in Bibb County in 2024 (0 in 5+ unit buildings).
Forward outlook
- Local home prices are declining (-3.0%/yr); year-one equity from $1k of loan paydown is wiped out by about $5k of value loss. Plan a longer hold.
- Bibb County population projected at -12% by 2050 — secular population decline; favor cash flow + early exit over multi-decade hold.
Negotiation context
- Only 3 days on market — expect competitive offers; lowballing is unlikely to land.
- 3 sale attempts with the ask held roughly flat each time — persistent listings suggest the price (not the market) is what's stuck; bring a comps-based counter.
- Current owner paid $80k; list at $170k implies a 113% gain — meaningful room to come down on a strong offer.
Risks & watch-outs
- Watch-outs: built in 1955 — expect roof / HVAC / electrical / plumbing capex.
- Climate carrying-cost: major wind risk, 63% chance of damaging wind over 30y; extreme-heat days projected 7→17/yr by 2055 (HVAC capex compounding) — expect insurance premiums to compound above CPI over the hold.
Questions for the listing agent
- Built in 1955 — when were the roof, HVAC, electrical panel, plumbing, and water heater last replaced?
- Is there a deadline driving the sale (1031 exchange, divorce, estate, relocation)? That informs how much negotiation room exists.
- The area grade is low — what's the realistic commute time and amenity access for the typical tenant pool here? Any planned neighborhood developments (good or bad) we should know about?
- What's the average days-on-market for RENTAL listings here right now (not sales)? A rising rental-DOM trend means longer vacancies and softer asking-rent achievability than the comps imply.
- What's the recent tenant-quality profile in this submarket — average credit score on applications, eviction rate, late-payment / NSF rate, and stable-employment percentage? A property-management company in the area should have these aggregated.
- How much new for-sale + rental construction is in the pipeline within 1–3 miles? Heavy new supply typically softens prices + rents 12–24 months out; constrained supply supports both.
Investment metrics
- 1% rule
- 0.80% ✗
- Cap rate
- 6.35%
- Cash-on-cash
- 0.20%
- DSCR
- 1.01
- GRM
- 10.5
CMA / ARV
- ARV (on-the-fly)
- $153,600
- Comps found
- 12
Show comp detail 12 sales within ~0.75 mi
| Address | Dist | Beds/Ba | Sqft | Sold | Price | $/sf | Match |
|---|---|---|---|---|---|---|---|
| 755 Gay Dr | 0.20mi | 3/1.5 (+1) | 1,398 (+9%) | 18mo | $162,000 | $116 | 55 |
| 711 Forest Hill Rd | 0.35mi | 2/2.0 | 1,420 (+11%) | 15mo | $138,500 | $98 | 51 |
| 4164 Wood Forest Pl | 0.67mi | 3/2.0 (+1) | 1,215 (-5%) | 3mo | $189,900 | $156 | 51 |
| 4230 Wood Forest Pl | 0.72mi | 3/2.0 (+1) | 1,241 (-3%) | 8mo | $183,000 | $147 | 48 |
| 831 Forest Hill Ct | 0.69mi | 3/1.5 (+1) | 1,333 (+4%) | 10mo | $168,000 | $126 | 47 |
| 4227 Wood Forest Pl | 0.69mi | 3/1.5 (+1) | 1,392 (+9%) | 5mo | $167,000 | $120 | 44 |
| 740 Valley Trl | 0.57mi | 3/2.0 (+1) | 1,448 (+13%) | 5mo | $195,000 | $135 | 41 |
| 1106 Darlington Dr | 0.47mi | 3/1.5 (+1) | 1,416 (+11%) | 20mo | $170,000 | $120 | 38 |
| 732 Woodhaven Rd | 0.64mi | 3/2.0 (+1) | 1,350 (+6%) | 20mo | $180,000 | $133 | 37 |
| 4231 Laura Ann Pl | 0.66mi | 3/2.0 (+1) | 1,201 (-6%) | 18mo | $130,000 | $108 | 37 |
| 619 Willow Crk #619 | 0.52mi | 3/2.0 (+1) | 1,428 (+12%) | 16mo | $150,000 | $105 | 36 |
| 954 Lockwood Pl | 0.60mi | 3/1.5 (+1) | 1,444 (+13%) | 16mo | $165,900 | $115 | 32 |
Match score weights: distance 35% · size 25% · config 20% · recency 20%. Top-matched comps best support the ARV.
Projected returns pro-forma
-3.0% appreciation · 1.71% rent growth · sell at horizon
- IRR
- -17.3%
- Equity multiple
- 0.39×
- Total profit
- $-28,815
- Equity at exit
- $25,333
- IRR
- -11.8%
- Equity multiple
- 0.34×
- Total profit
- $-31,576
- Equity at exit
- $14,690
Cash invested: $47,572 (down + closing). Projections, not guarantees.
Landlord ↔ Tenant lean methodology
- Overall (STATE)
- 90 Strongly Landlord-Friendly
- State Georgia
- 90 Strongly Landlord-Friendly · R+3
- County
- — inherits STATE
- City
- — inherits STATE
ZIP-level market 31210
- Rents YoY
- 1.7%
- Active inventory
- 235
- Price-to-rent
- 10.5×
Monthly cashflow live
- Estimated rent
- $1,351 high interval (Pro) →
- Mortgage (P&I)
- −$891
- Tax from tax record
- −$98 /mo · $1,172/yr
- Insurance
- −$71
- HOA
- −$0
- Vacancy / Maint / Mgmt
- −$284
- Net cashflow
- $8
Break-even live
UW: 25.0% down · 7.5% · 30yr · 1.5% tax · 5.0% vac · 8.0% maint · 8.0% mgmt
Financing live
Cash to close
- Down payment
- $42,475
- Closing costs
- $5,097
- Reserves months
- —
- Total cash needed
- —
Loan-product check · same deal, 3 products live
Conventional
25% down · 7.5% · 30yr
- Down + closing
- —
- Monthly P&I
- —
- Monthly cashflow
- —
- DSCR
- —
- Eligible?
- —
Personal DTI + credit; lowest rate.
DSCR
20% down · 8.5% · 30yr
- Down + closing
- —
- Monthly P&I
- —
- Monthly cashflow
- —
- DSCR
- —
- Eligible?
- —
No personal income docs; deal must DSCR.
Hard money
10% down · 12.0% · 12mo
- Down + closing
- —
- Monthly P&I
- —
- Monthly cashflow
- —
- DSCR
- —
- Eligible?
- —
Short-term bridge; refi at stabilization.
Rent comps 17 comps
| Address | Beds | Baths | Sqft | Rent | $/sqft | DOM | Units | Dist |
|---|---|---|---|---|---|---|---|---|
| 101 Village Ln Macon, GA | 2.0 | 2.0 | 1611 | $2,395 | $1.49 | 13d | 1 | 0.44mi |
| 773 Downing St Macon, GA | 2.0 | 1.0 | 1200 | $1,250 | $1.04 | 13d | 1 | 0.58mi |
| 777 Windsor Rd Macon, GA | 3.0 | 2.0 | 1442 | $1,850 | $1.28 | 44d | 1 | 0.59mi |
| 3300 N Ingle Pl Macon, GA | 1.0–3.0 | 1.0–2.0 | 1215 | $1,125 | $0.93 | 21d | 4 | 0.70mi |
| 825 S Forest Lake Dr Unit 2 Macon, GA | 2.0 | 2.0 | 1070 | $1,200 | $1.12 | 44d | 1 | 0.79mi |
| 2962 Thornwood Dr Macon, GA | 3.0 | 2.0 | 1680 | $1,700 | $1.01 | 44d | 1 | 0.82mi |
| 3876 Northside Dr Macon, GA | 1.0–3.0 | 1.0–2.0 | 995 | $950 | $0.95 | 13d | 7 | 1.03mi |
| 200 Charter Ln Macon, GA | 1.0–3.0 | 1.0–2.0 | 1088 | $1,322 | $1.21 | 13d | 18 | 1.07mi |
| 3871 Northside Dr Macon, GA | 1.0–2.0 | 1.0–1.5 | 1087 | $995 | $0.91 | 13d | 3 | 1.11mi |
| 3901 Northside Dr Macon, GA | 2.0 | 2.0 | 1100 | $985 | $0.90 | 13d | 1 | 1.21mi |
| 3901 Northside Dr Macon, GA | 3.0 | 2.0 | 1250 | $1,100 | $0.88 | 21d | 1 | 1.21mi |
| 3901 Northside Dr Macon, GA | 2.0 | 2.0 | 1100 | $985 | $0.90 | 44d | 1 | 1.21mi |
| 2759 Ellenwood Cir S Macon, GA | 3.0 | 1.0 | 1537 | $1,295 | $0.84 | 44d | 1 | 1.27mi |
| 2873 Audubon Cir Unit 2873 Macon, GA | 3.0 | 1.0 | 1200 | $1,195 | $1.00 | 21d | 1 | 1.33mi |
| 230 Roycrest Dr Macon, GA | 3.0 | 2.0 | 1261 | $1,300 | $1.03 | 44d | 1 | 1.36mi |
| 3896 Riverside Dr Macon, GA | 3.0 | 3.0 | 1550 | $1,324 | $0.85 | 21d | 1 | 1.37mi |
| 3896 Riverside Dr Macon, GA | 2.0 | 2.0 | 1305 | $1,024 | $0.78 | 44d | 1 | 1.37mi |
Listing history 3 events
-
2026-06-07statusdays on market $169,900 Under Contract 3 DOM
-
2026-06-03remarks 496-char remark
-
2026-06-03$169,900 New 1 DOM
ⓘ Source: listings_history table (triggers on properties + properties_extension) + one-shot
backfill from property_details.listing_events for pre-trigger history.
Tax reassessment forecast GA · Resets to sale price
- Current annual tax
- $1,172 · $98/mo
- Projected year-2 tax
- $1,563 · $130/mo
- Expected delta
- +$391/yr (+$33/mo · 33.4%)
ⓘ Screening estimate from a state-policy table — verify with the county assessor before closing.
Climate risk First Street
- Flood 1/10 Low FEMA zone X (unshaded) · 0% chance over 30 yrs
- Wildfire 1/10 Low
- Heat 7/10 Severe 7 d/yr ≥108°F today · 17 d/yr by 30 yrs out
- Wind 6/10 Major 63% chance of damaging wind over 30 yrs
- Air quality 4/10 Moderate 3 unhealthy d/yr today · 5 by 30 yrs out
Nearby sold comps map
Loading sold comps map…
Walkable amenities ~0.75 mi
Loading nearby amenities…
Taxation est. · year 1
- Rental income
- $16,211
- − Mortgage interest
- −$9,517
- − Property taxes
- −$1,172
- − Insurance
- −$850
- − Repairs & maintenance
- −$1,297
- − Management
- −$1,297
- − Depreciation
- −$4,943
- Taxable loss
- −$2,864
- Est. tax savings @ 24.0%
- +$687
- After-tax cash flow
- $781/yr
For passive investors: Depreciation is non-cash, so a rental often shows a tax loss while cash-flowing — sheltering income. Rental losses are passive: they offset passive income freely, and up to $25,000/yr can offset ordinary (W-2) income if you actively participate and your MAGI is under $100k (phasing out to $0 by $150k); unused losses carry forward. On sale, claimed depreciation is recaptured at up to 25%, and gains may owe capital-gains tax (a 1031 exchange can defer both). Figures are a year-1 estimate at your 24.0% rate — not tax advice; consult a CPA.
Schools (NCES district)
- District
- Bibb County
- NCES district ID
- 1300420
- Math proficiency
- 11% ▼ -14.00%
- Reading proficiency
- 18% ▼ -11.00%
- Median HH income
- $37,426
- Composite
- 12.13/100
- National rank
- #9654
- State rank
- #161 of 174 in GA
Livability — Macon-Bibb County
No livability data for this city. (Only ~50 U.S. cities are tracked.)
Census & demographics
- Census place
- Macon-Bibb County, GA
- County
- Bibb County · 164,332 people
- City population
- 143,186
- Metro
- Macon-Bibb County, GA
- Population (ZIP)
- 33,288
- Household income
- $78,447
- Rent vs Own
- Severe rent burden
- 1845.0
Population outlook (Bibb County) Hauer SSP2
- Today (2025)
- 148,772 people
- By 2030
- 145,904 · -1.9%
- By 2040
- 139,404 · -6.3%
- By 2050
- 131,603 · -11.5%
- By 2075
- 111,050 · -25.4%
- By 2100
- 83,346 · -44.0%
Race, ethnicity, and origin ACS 2023
- Neighborhood character
- Diverse neighborhood (Simpson 0.62)
- Race & ethnicity
- White 52% Black 32% Two or more races 7% Hispanic / Latino 6% Asian 4%
- Hispanic origin (detail)
- Mexican 2% Cuban 1%
- Common ancestry
- Slovak 3% Serbian 1% Italian 1%
- Foreign-born
- 5% · Canada, China, South Korea
- Languages at home
- 93% English-only · Spanish 3% Other Indo-European 1% Chinese 1%
Political lean MEDSL · Bibb
- 2024 margin
- Strong D (+22.4) · D 61.0% · R 38.5%
- 2008→2024 swing
- +4.4pp toward D · 2008: 18.0pp · 2024: 22.4pp
- All cycles
- 2024: D+22.4 2020: D+23.8 2016: D+20.2 2012: D+20.0 2008: D+18.0
Not yet ingested
- Civics
- —
Market trends
- HPI YoY
- ▼ -144.60%
- Current HPI
- 172.1313
- Rent YoY
- ▲ 1.71%
- Metro
- Macon-Bibb County, GA
- State GDP YoY
- ▲ 2.66%
- F500 in state
- 28
Industry mix (Fortune 500 HQ in GA)
| Industry | F500 HQs | Revenue |
|---|---|---|
| Paper / Packaging | 2 | $29B |
|
||
| Retail | 1 | $160B |
|
||
| Transportation / Logistics | 1 | $91B |
|
||
| Airlines | 1 | $62B |
|
||
| Consumer Goods | 1 | $47B |
|
||
| Utilities | 1 | $25B |
|
||
Price history
+112.6% since first listed4 events — show timeline
- 2026-06-02 Listed $169,900 CGMLS
- 2026-06-02 Listed $169,900 MGMLS
- 2026-06-01 Listed $169,900 GAMLS
- 1998-06-03 Sold (Public Records) $79,900 Public Records
Property tax history
+7.6%/yrLatest (2025): $1,172 · +0.4% YoY. Source: county tax records.
Cash-flow waterfall
monthlySold comps — $/sqft
last 12 mo · ≤1 miLoading sold comps…