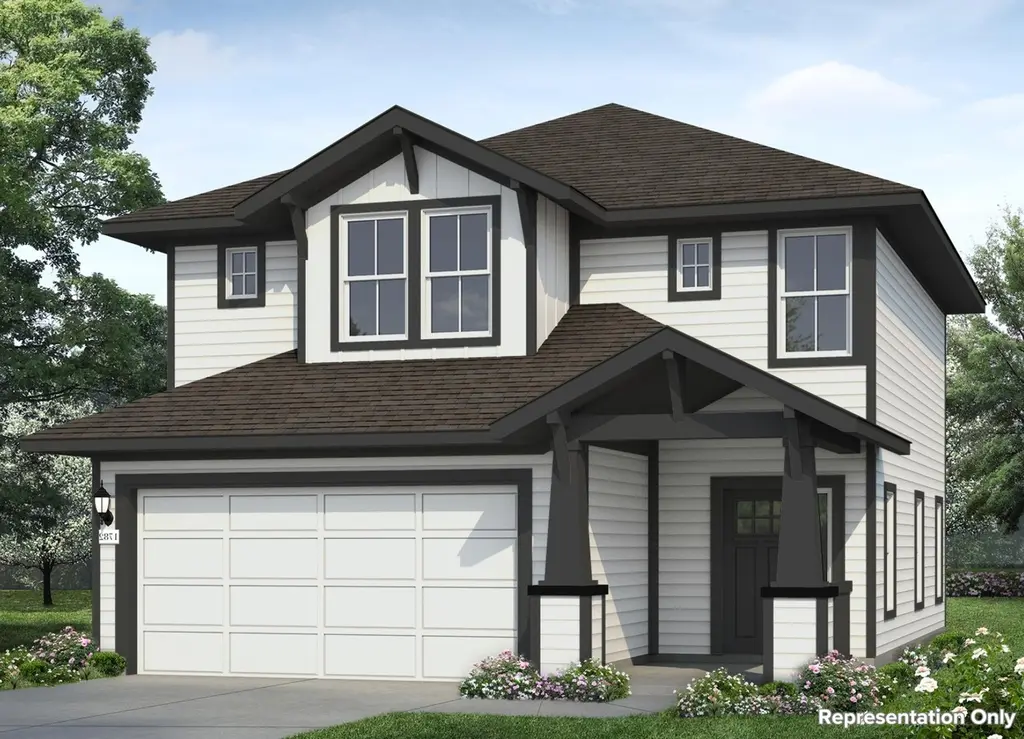
205 Lavender Ln · Elgin, TX
Flood risk No data
- FEMA flood zone
- —
- Chance of flooding over 30 yrs
- —
- Est. flood insurance / yr
- —
Fire risk No data
- Est. fire insurance / yr
- —
Heat risk No data
- Hot days now (above threshold)
- —
- Hot days in 30 yrs
- —
Wind risk No data
- Chance of severe wind over 30 yrs
- —
Air-quality risk No data
- Unhealthy air days now
- —
- Unhealthy air days in 30 yrs
- —
Risk factors via First Street. Map © Google.
Why this score? — see what drove the D grade
The composite is a weighted blend of 9 inputs, each scored 0–100. Each bar is that input's sub-score; the figure is the points it added to the 100-point composite (weight × sub-score).
- Appreciation +10.0/10.0
- Cash flow +9.6/30.0
- ARV discount +7.5/15.0
- Livability +3.7/5.0
- Rent growth +3.3/5.0
- DSCR +2.7/10.0
- Condition / age +2.5/5.0
- 1% rule +2.0/10.0
- Schools +2.0/10.0
$291,670
🖨 Deal sheet 📄 Offer letter ✓ Due diligence
Listing remarks
Welcome to 205 Lavender Lane in Elgin’s premier community, Harvest Ridge! This two-story new build home is alive with natural light throughout, including an open-concept kitchen, dining, and living room with wood-look vinyl flooring. You can find the heart of the home in the kitchen which features 42-inch upper cabinets, durable 3cm granite countertops, a large center island, sleek black appliances with a gas range, and nickel hardware throughout. Relax in the primary suite with a walk-in closet, dual vanity, semi-private water closet and a linen closet. Enjoy other amazing features such as a utility room conveniently located upstairs, coordinating bright white cabinets throughout, an
Key facts
- Large center island
- Upstairs loft
- Open-concept kitchen
Tags
Property features AI
Finance
- HOA & community: Homeowners association with The Neighborhood Company; Monthly association fee of $70; Association covers common area maintenance and grounds maintenance; Community amenities include clubhouse, playground, park, sport courts, trails/paths, fishing, game room, kitchen facilities, planned social activities, curbs
Exterior
- Parking: Attached garage; Garage faces front; Single garage door; Driveway; Two covered parking spaces (2 total)
- Security: Smoke detectors; Carbon monoxide detectors
- Utilities: Electricity available; Natural gas available; Public water (Municipal Utility District); Sewer via Municipal Utility District; Phone available
- Home design: Two-story home; New construction by Brohn Homes; Faces northeast; Slab foundation
- Construction: HardiPlank siding; Blown-in and spray foam insulation; Composition shingle roof
- Exterior features: Private yard; Covered patio; Patio; Back yard with wood fencing; Front yard; Automatic sprinklers (front, rear, side); Level lot; Small trees; Close to clubhouse
Interior
- Kitchen: Dishwasher; Disposal; Gas oven; Gas range; Kitchen island; Pantry; Stone counters; Eat-in kitchen
- Bedrooms: Three main-level bedrooms
- Flooring: Carpet; Vinyl
- Bathrooms: Two full bathrooms; One half bathroom
- Heating & cooling: Central heating (natural gas); Central air
- Interior features: Open floorplan; Entrance foyer; Interior steps; Recessed lighting; Kitchen island; Pantry; Stone counters; Double vanity; Walk-in closet(s); Eat-in kitchen
- Laundry & utility: Laundry room; Washer hookup; Tankless water heater
Neighborhood map
What this means for you Summary
Snapshot
- This is a 3-bed/2.5-bath land listed at $292k.
Deal economics
- At list price, monthly cash flow is $-200 ($-2k/yr) — negative.
- To cash-flow at today's rent, offer at most $256k (12.1% below list).
- To meet the 1% rule (rent ≥ 1% of price), the offer needs to be $204k (30.1% below list).
- Recommended offer: $204k (30.1% below list) — sets the bar for 1% rule.
- Cap rate 5.5% vs local median 4.4% in Elgin — meaningfully above typical; check what's discounted (condition, days-on-market, listing class) to confirm the premium yield is real.
Location & tenants
- Location reads 74/100 on livability (#167 in TX, #4,404 nationally) — a middle-class / working-renter tenant base. Strengths: cost of living A+, housing A+, health & safety A+; Watch: schools F, amenities F, commute F.
- Elgin ISD (rural): math 17% / reading 26% proficiency, ranked #741 of 826 in TX (top 90%) — low school quality limits family demand, transient renter base, plan for 1-2y turnover; 67% free/reduced lunch — lower-income household profile, screen leases tightly.
- Market conditions: Rents rising (+3.1%/yr); 807 active listings in the ZIP; 27 comparable units currently listed for rent nearby; rentals at typical pace (median 18d on market — plan ~3-4 weeks tenant-placement turnaround); solid renter incomes; 1,841 units permitted in Bastrop County in 2024 (150 in 5+ unit buildings).
Forward outlook
- In year one you build about $31k of equity ($2k loan paydown + $29k appreciation (10.0% local appreciation)).
- Bastrop County population projected at +37% by 2050 — long-run rental-demand tailwind backs the buy-and-hold thesis.
- By year 2, paydown + projected appreciation supports a ~$50k cash-out refi (75% LTV) — recoverable capital for the next deal without selling this one.
Negotiation context
- It's been on market 32 days — a 3% lower offer ($283k) is reasonable based on typical stale-listing flexibility.
Questions for the listing agent
- What do current leases actually rent for vs. the listed asking? Can we see a recent rent roll and the last 12 months of T-12 income?
- It's been on market 32 days. Have you received any prior offers? Is the seller open to a 30% concession, seller financing, or rate buy-down credit?
- What does the HOA fee cover, when was the last increase, and are there any pending special assessments or reserve-fund shortfalls?
- Is there a deadline driving the sale (1031 exchange, divorce, estate, relocation)? That informs how much negotiation room exists.
- Schools are F-rated, which usually means shorter tenancies and higher turnover. Who's the typical renter profile here, and what's been the actual vacancy rate?
- The area grade is low — what's the realistic commute time and amenity access for the typical tenant pool here? Any planned neighborhood developments (good or bad) we should know about?
- What's the average days-on-market for RENTAL listings here right now (not sales)? A rising rental-DOM trend means longer vacancies and softer asking-rent achievability than the comps imply.
- What's the recent tenant-quality profile in this submarket — average credit score on applications, eviction rate, late-payment / NSF rate, and stable-employment percentage? A property-management company in the area should have these aggregated.
- How much new for-sale + rental construction is in the pipeline within 1–3 miles? Heavy new supply typically softens prices + rents 12–24 months out; constrained supply supports both.
Investment metrics
- 1% rule
- 0.70% ✗
- Cap rate
- 5.47%
- Cash-on-cash
- -2.94%
- DSCR
- 0.87
- GRM
- 11.9
CMA / ARV
No comps found within radius.
Projected returns pro-forma
10.0% appreciation · 3.12% rent growth · sell at horizon
- IRR
- 22.2%
- Equity multiple
- 2.79×
- Total profit
- $146,277
- Equity at exit
- $262,759
- IRR
- 19.9%
- Equity multiple
- 6.40×
- Total profit
- $441,084
- Equity at exit
- $566,651
Cash invested: $81,668 (down + closing). Projections, not guarantees.
Landlord ↔ Tenant lean methodology
- Overall (STATE)
- 87 Strongly Landlord-Friendly
- State Texas
- 87 Strongly Landlord-Friendly · R+5
- County
- — inherits STATE
- City
- — inherits STATE
ZIP-level market 78621
- Home prices YoY
- 7.6%
- Rents YoY
- 3.1%
- Active inventory
- 807
- Price-to-rent
- 11.9×
Monthly cashflow live
- Estimated rent
- $2,040 high interval (Pro) →
- Mortgage (P&I)
- −$1,530
- Tax from tax record
- −$90 /mo · $1,084/yr
- Insurance
- −$122
- HOA
- −$70
- Vacancy / Maint / Mgmt
- −$428
- Net cashflow
- $-200
Break-even live
UW: 25.0% down · 7.5% · 30yr · 1.5% tax · 5.0% vac · 8.0% maint · 8.0% mgmt
Financing live
Cash to close
- Down payment
- $72,918
- Closing costs
- $8,750
- Reserves months
- —
- Total cash needed
- —
Loan-product check · same deal, 3 products live
Conventional
25% down · 7.5% · 30yr
- Down + closing
- —
- Monthly P&I
- —
- Monthly cashflow
- —
- DSCR
- —
- Eligible?
- —
Personal DTI + credit; lowest rate.
DSCR
20% down · 8.5% · 30yr
- Down + closing
- —
- Monthly P&I
- —
- Monthly cashflow
- —
- DSCR
- —
- Eligible?
- —
No personal income docs; deal must DSCR.
Hard money
10% down · 12.0% · 12mo
- Down + closing
- —
- Monthly P&I
- —
- Monthly cashflow
- —
- DSCR
- —
- Eligible?
- —
Short-term bridge; refi at stabilization.
Rent comps 27 comps
| Address | Beds | Baths | Sqft | Rent | $/sqft | DOM | Units | Dist |
|---|---|---|---|---|---|---|---|---|
| 242 Barley Ln Elgin, TX | 3.0 | 2.5 | 1782 | $2,150 | $1.21 | 2d | 1 | 0.02mi |
| 116 Honeybee Ln Elgin, TX | 3.0 | 2.5 | 1782 | $2,000 | $1.12 | 4d | 1 | 0.06mi |
| 234 Heritage Mill Trl Elgin, TX | 3.0 | 2.0 | 1530 | $1,850 | $1.21 | 2d | 1 | 0.27mi |
| 14521 Gurneys Eagle Dr Elgin, TX | 3.0 | 2.0 | 1878 | $1,895 | $1.01 | 2d | 1 | 0.29mi |
| 107 Tillage Rd Elgin, TX | 3.0 | 2.0 | 1548 | $1,775 | $1.15 | 19d | 1 | 0.36mi |
| 14421 Prairie Sod Ln Elgin, TX | 3.0 | 2.0 | 1525 | $1,650 | $1.08 | 2d | 1 | 0.44mi |
| 11524 Rush Ln Elgin, TX | 4.0 | 3.0 | 2473 | $2,300 | $0.93 | 44d | 1 | 0.58mi |
| 18612 Allen Welch Dr Elgin, TX | 4.0 | 2.0 | 1794 | $1,885 | $1.05 | 4d | 1 | 0.59mi |
| 14300 Boomtown Way Elgin, TX | 4.0 | 2.0 | 1794 | $2,050 | $1.14 | 24d | 1 | 0.60mi |
| 18721 Quiet Range Dr Elgin, TX | 3.0–5.0 | 2.0–3.5 | 1773 | $2,085 | $1.18 | 2d | 1 | 0.65mi |
| 18500 Allen Welch Dr Elgin, TX | 3.0 | 2.0 | 1525 | $1,825 | $1.20 | 4d | 1 | 0.65mi |
| 14141 Prospector Way Elgin, TX | 3.0 | 2.0 | 1520 | $1,650 | $1.09 | 44d | 1 | 0.72mi |
| 14101 Prospector Way Elgin, TX | 4.0 | 2.5 | 2198 | $2,099 | $0.95 | 44d | 1 | 0.72mi |
| 14101 Prospector Way Unit 14101 Elgin, TX | 4.0 | 2.5 | 2198 | $2,099 | $0.95 | 24d | 1 | 0.72mi |
| 19405 Bear Grass Dr Elgin, TX | 3.0 | 2.0 | 1495 | $1,760 | $1.18 | 44d | 1 | 0.73mi |
| 19017 Romano Dr Elgin, TX | 4.0 | 3.0 | 2473 | $2,198 | $0.89 | 4d | 1 | 0.73mi |
| 18525 Quiet Range Dr Elgin, TX | 4.0 | 2.0 | 1794 | $1,725 | $0.96 | 18d | 1 | 0.73mi |
| 18300 Speculator Ln Elgin, TX | 4.0 | 2.0 | 1794 | $1,995 | $1.11 | 24d | 1 | 0.75mi |
| 18224 Speculator Ln Elgin, TX | 3.0 | 2.5 | 1599 | $1,700 | $1.06 | 44d | 1 | 0.76mi |
| 18200 Papuan Cv Elgin, TX | 3.0 | 2.0 | 1402 | $1,900 | $1.36 | 3d | 1 | 0.77mi |
| 18505 Quiet Range Dr Elgin, TX | 4.0 | 2.0 | 1794 | $1,950 | $1.09 | 24d | 1 | 0.78mi |
| 18505 Quiet Range Dr Unit 18505 Elgin, TX | 4.0 | 2.0 | 1794 | $1,785 | $0.99 | 4d | 1 | 0.78mi |
| 722 Lavaca Loop Elgin, TX | 4.0 | 2.5 | 2075 | $1,895 | $0.91 | 18d | 1 | 1.03mi |
| 419 Gettysburg Loop Elgin, TX | 3.0 | 2.0 | 1565 | $1,850 | $1.18 | 12d | 1 | 1.09mi |
| 102 Blanco Woods Blvd Elgin, TX | 3.0 | 2.5 | 2450 | $1,800 | $0.73 | 44d | 1 | 1.11mi |
| 101 Bandara Woods Blvd Elgin, TX | 3.0 | 2.0 | 1499 | $1,769 | $1.18 | 15d | 1 | 1.14mi |
| 401 Bandara Woods Blvd Elgin, TX | 3.0 | 2.0 | 1665 | $1,875 | $1.13 | 44d | 1 | 1.16mi |
HOA detail
- Monthly dues
- $70 · $840/yr
- Likely covers
- watergas
Listing history 2 events
-
2026-05-01status Pending
-
2026-03-30$291,670 Active
ⓘ Source: listings_history table (triggers on properties + properties_extension) + one-shot
backfill from property_details.listing_events for pre-trigger history.
Tax reassessment forecast TX · Resets to sale price
- Current annual tax
- $1,084 · $90/mo
- Projected year-2 tax
- $5,338 · $445/mo
- Expected delta
- +$4,254/yr (+$354/mo · 392.5%)
ⓘ Screening estimate from a state-policy table — verify with the county assessor before closing.
Nearby sold comps map
Loading sold comps map…
Walkable amenities ~0.75 mi
Loading nearby amenities…
Taxation est. · year 1
- Rental income
- $24,480
- − Mortgage interest
- −$16,338
- − Property taxes
- −$1,084
- − Insurance
- −$1,458
- − Repairs & maintenance
- −$1,958
- − Management
- −$1,958
- − HOA
- −$840
- − Depreciation
- −$8,485
- Taxable loss
- −$7,642
- Est. tax savings @ 24.0%
- +$1,834
- After-tax cash flow
- $-564/yr
For passive investors: Depreciation is non-cash, so a rental often shows a tax loss while cash-flowing — sheltering income. Rental losses are passive: they offset passive income freely, and up to $25,000/yr can offset ordinary (W-2) income if you actively participate and your MAGI is under $100k (phasing out to $0 by $150k); unused losses carry forward. On sale, claimed depreciation is recaptured at up to 25%, and gains may owe capital-gains tax (a 1031 exchange can defer both). Figures are a year-1 estimate at your 24.0% rate — not tax advice; consult a CPA.
Schools (NCES district)
- District
- Elgin ISD
- NCES district ID
- 4818360
- Math proficiency
- 17% ▼ -9.00%
- Reading proficiency
- 26% ▼ -5.00%
- Median HH income
- $55,176
- Composite
- 19.62/100
- National rank
- #8749
- State rank
- #741 of 826 in TX
Livability — Elgin
- Score
- 74/100
- State rank
- #167
- US rank
- #4404
Category grades
Schools grade is shown separately in the Schools card above.
Census & demographics
- County
- Bastrop County · 68,601 people
- City population
- 27,860
- Metro
- Austin-Round Rock-Georgetown, TX
- Population (ZIP)
- 30,411
- Household income
- $98,534
- Rent vs Own
- Severe rent burden
- 235.0
Population outlook (Bastrop County) Hauer SSP2
- Today (2025)
- 94,260 people
- By 2030
- 101,355 · +7.5%
- By 2040
- 115,578 · +22.6%
- By 2050
- 129,464 · +37.3%
- By 2075
- 168,068 · +78.3%
- By 2100
- 194,857 · +106.7%
Race, ethnicity, and origin ACS 2023
- Neighborhood character
- Diverse neighborhood (Simpson 0.64)
- Race & ethnicity
- Hispanic / Latino 46% White 38% Two or more races 19% Black 11% Native American 1%
- Hispanic origin (detail)
- Mexican 38%
- Common ancestry
- Slovak 2% Italian 2% Romanian 1%
- Foreign-born
- 17% · Canada, Vietnam
- Languages at home
- 63% English-only · Spanish 36%
Political lean MEDSL · Bastrop
- 2024 margin
- R (+18.4) · D 40.2% · R 58.6% · Other 1.2%
- 2008→2024 swing
- -10.2pp toward R · 2008: -8.2pp · 2024: -18.4pp
- All cycles
- 2024: R+18.4 2020: R+13.8 2016: R+20.4 2012: R+17.0 2008: R+8.2
Not yet ingested
- Civics
- —
Market trends
- HPI YoY
- ▲ 29.47%
- Current HPI
- 416.87
- Rent YoY
- ▲ 3.12%
- Metro
- Austin-Round Rock-Georgetown, TX
- State GDP YoY
- ▲ 3.95%
- F500 in state
- 110
Industry mix (Fortune 500 HQ in TX)
| Industry | F500 HQs | Revenue |
|---|---|---|
| Energy | 16 | $1,198B |
|
||
| Technology | 5 | $198B |
|
||
| Engineering / Construction | 4 | $72B |
|
||
| Energy Services | 3 | $60B |
|
||
| Utilities | 3 | $41B |
|
||
| Healthcare | 2 | $330B |
|
||
Price history
2 events — show timeline
- 2026-05-01 Pending — Unlock MLS
- 2026-03-30 Listed $291,670 Unlock MLS
Property tax history
+23.8%/yrLatest (2025): $1,084 · +6.0% YoY. Source: county tax records.
Cash-flow waterfall
monthlySold comps — $/sqft
last 12 mo · ≤1 miLoading sold comps…