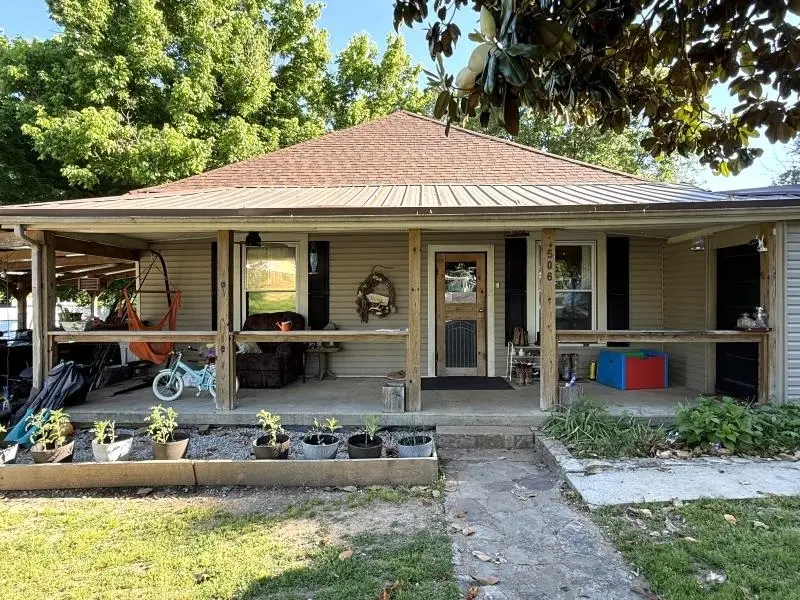
506 W 4th · Imboden, AR
Flood risk No data
- FEMA flood zone
- —
- Chance of flooding over 30 yrs
- —
- Est. flood insurance / yr
- —
Fire risk No data
- Est. fire insurance / yr
- —
Heat risk No data
- Hot days now (above threshold)
- —
- Hot days in 30 yrs
- —
Wind risk No data
- Chance of severe wind over 30 yrs
- —
Air-quality risk No data
- Unhealthy air days now
- —
- Unhealthy air days in 30 yrs
- —
Risk factors via First Street. Map © Google.
Why this score? — see what drove the C+ grade
The composite is a weighted blend of 9 inputs, each scored 0–100. Each bar is that input's sub-score; the figure is the points it added to the 100-point composite (weight × sub-score).
- Cash flow +22.1/30.0
- ARV discount +10.5/15.0
- Appreciation +8.7/10.0
- DSCR +7.1/10.0
- 1% rule +5.8/10.0
- Livability +3.2/5.0
- Rent growth +2.5/5.0
- Condition / age +2.5/5.0
- Schools +2.3/10.0
$115,000
🖨 Deal sheet (PDF) 📄 Offer letter ✓ Due diligence
Listing remarks
4 bedroom, 2 full bath home on approximately a half acre! Some of the key features include: new windows in 2008, new roof in 2022, 200 amp service upgraded in 2024, a custom built smokehouse, chicken coup, and a 20X20 attached workshop on a slab with concrete floors. The home features a cute, country-style front porch, an attached carport, a doggy door that leads out to a fenced area, large living area, a gas log fireplace, separate dining room (but right off of the kitchen), central heat and air, plus mini splits in the newest room additions. The decor is absolutely adorable throughout, and makes you feel right at home the minute you open the door. There is also a storm cellar for those st
Key facts
- Attached workshop
- 200 amp service
- New roof
Tags
Property features AI
Finance
- Financial info: Financing options may include VA, FHA, conventional, rural development, in-house financing, or cash
Exterior
- Parking: Detached garage
- Utilities: Public sewer; Public water; Municipal electric (Entergy); Fiber internet available
- Home design: Metal/vinyl siding exterior
- Construction: Architectural shingle roof; Slab/crawl space combination foundation
- Exterior features: Porch; Outside storage area; Guttering; Playground on site; Paved road access; Sloped, cleared corner lot in a subdivision; Located inside city limits
Interior
- Kitchen: Free-standing stove; Electric range; Dishwasher
- Flooring: Other (see remarks)
- Bathrooms: 2 full bathrooms
- Heating & cooling: Central heating; Central electric cooling; Window units; Mini split system
- Interior features: Walk-in closets; Ceiling fans; Gas logs in fireplace
- Laundry & utility: Dedicated laundry room; Workshop/craft room
Neighborhood map
What this means for you Summary
Snapshot
- This is a 4-bed/1.5-bath single-family listed at $115k.
Deal economics
- At list price, monthly cash flow is $185 ($2k/yr) — positive.
- The deal already cash-flows at list — no discount required.
- Meets the 1% rule at list price ($1k rent vs $115k).
Location & tenants
- Location reads 64/100 on livability (#162 in AR) — a middle-class / working-renter tenant base. Strengths: cost of living A+, housing A+, health & safety A+; Watch: schools D+, crime F, amenities F.
- Sloan-Hendrix School District (rural): math 28% / reading 28% proficiency, ranked #171 of 238 in AR (top 72%) — low school quality limits family demand, transient renter base, plan for 1-2y turnover.
- Market conditions: 12 active listings in the ZIP; 63 units permitted in Lawrence County in 2024 (15 in 5+ unit buildings).
Forward outlook
- In year one you build about $9k of equity ($795 loan paydown + $8k appreciation (7.3% local appreciation)).
- Lawrence County population projected at -23% by 2050 — secular population decline; favor cash flow + early exit over multi-decade hold.
- At projected returns (7.3% appreciation + 3.0% rent growth), your $32k cash investment doubles in ~3 years — after that, you're playing with house money.
- By year 4, paydown + projected appreciation supports a ~$32k cash-out refi (75% LTV) — recoverable capital for the next deal without selling this one.
Negotiation context
- Only 8 days on market — expect competitive offers; lowballing is unlikely to land.
- Current owner paid $30k; list at $115k implies a 283% gain — meaningful room to come down on a strong offer.
Questions for the listing agent
- Is there a deadline driving the sale (1031 exchange, divorce, estate, relocation)? That informs how much negotiation room exists.
- Schools are D-rated, which usually means shorter tenancies and higher turnover. Who's the typical renter profile here, and what's been the actual vacancy rate?
- Crime grade is F in this area — have there been break-ins, vandalism, or insurance claims at this property in the last 3 years? What carrier currently insures it and at what premium?
- What's the average days-on-market for RENTAL listings here right now (not sales)? A rising rental-DOM trend means longer vacancies and softer asking-rent achievability than the comps imply.
- What's the recent tenant-quality profile in this submarket — average credit score on applications, eviction rate, late-payment / NSF rate, and stable-employment percentage? A property-management company in the area should have these aggregated.
- How much new for-sale + rental construction is in the pipeline within 1–3 miles? Heavy new supply typically softens prices + rents 12–24 months out; constrained supply supports both.
Investment metrics
- 1% rule
- 1.08% ✓
- Cap rate
- 8.22%
- Cash-on-cash
- 6.88%
- DSCR
- 1.31
- GRM
- 7.7
CMA / ARV
- ARV (median comp)
- $123,216
- List price
- $115,000
- Delta
- -6.67%
- Verdict
- FAIR
- Comps
- 11 within 1.0 mi
Show comp detail 2 sales within ~0.75 mi
| Address | Dist | Beds/Ba | Sqft | Sold | Price | $/sf | Match |
|---|---|---|---|---|---|---|---|
| 105 Elm St | 0.49mi | 3/2.0 (-1) | 1,352 (-9%) | 17mo | $65,000 | $48 | 41 |
| 105 Elm | 0.49mi | 3/2.0 (-1) | 1,352 (-9%) | 22mo | $53,000 | $39 | 37 |
Match score weights: distance 35% · size 25% · config 20% · recency 20%. Top-matched comps best support the ARV.
Projected returns pro-forma
7.35% appreciation · 3.0% rent growth · sell at horizon
- IRR
- 23.9%
- Equity multiple
- 2.69×
- Total profit
- $54,406
- Equity at exit
- $82,313
- IRR
- 22.0%
- Equity multiple
- 5.63×
- Total profit
- $149,179
- Equity at exit
- $158,791
Cash invested: $32,200 (down + closing). Projections, not guarantees.
Landlord ↔ Tenant lean methodology
- Overall (STATE)
- 92 Strongly Landlord-Friendly
- State Arkansas
- 92 Strongly Landlord-Friendly · R+14
- County
- — inherits STATE
- City
- — inherits STATE
ZIP-level market 72434
- Home prices YoY
- 3.1%
- Active inventory
- 12
- Price-to-rent
- 7.7×
Monthly cashflow live
- Estimated rent
- $1,240 medium interval (Pro) →
- Mortgage (P&I)
- −$603
- Tax est. 1.5%
- −$144 /mo · $1,725/yr
- Insurance
- −$48
- HOA
- −$0
- Vacancy / Maint / Mgmt
- −$260
- Net cashflow
- $185
Break-even live
Sensitivity live
| Price | -10% $264 | -5% $224 | +0% $185 | +5% $145 | +10% $105 |
|---|---|---|---|---|---|
| Rent | -10% $87 | -5% $136 | +0% $185 | +5% $234 | +10% $283 |
| Rate | -1.0pp $243 | -0.5pp $214 | base $185 | +0.5pp $155 | +1.0pp $125 |
UW: 25.0% down · 7.5% · 30yr · 1.5% tax · 5.0% vac · 8.0% maint · 8.0% mgmt
Financing live
Cash to close
- Down payment
- $28,750
- Closing costs
- $3,450
- Reserves months
- —
- Total cash needed
- —
Loan-product check · same deal, 3 products live
Conventional
25% down · 7.5% · 30yr
- Down + closing
- —
- Monthly P&I
- —
- Monthly cashflow
- —
- DSCR
- —
- Eligible?
- —
Personal DTI + credit; lowest rate.
DSCR
20% down · 8.5% · 30yr
- Down + closing
- —
- Monthly P&I
- —
- Monthly cashflow
- —
- DSCR
- —
- Eligible?
- —
No personal income docs; deal must DSCR.
Hard money
10% down · 12.0% · 12mo
- Down + closing
- —
- Monthly P&I
- —
- Monthly cashflow
- —
- DSCR
- —
- Eligible?
- —
Short-term bridge; refi at stabilization.
Listing history 3 events
-
2026-05-11$115,000 New Listing 777-char remark
-
2008-12-04soldstatus $30,000
-
2008-12-04soldstatus $45,000
ⓘ Source: listings_history table (triggers on properties + properties_extension) + one-shot
backfill from property_details.listing_events for pre-trigger history.
Nearby sold comps map
Loading sold comps map…
Walkable amenities ~0.75 mi
Loading nearby amenities…
Taxation est. · year 1
- Rental income
- $14,878
- − Mortgage interest
- −$6,442
- − Property taxes
- −$1,725
- − Insurance
- −$575
- − Repairs & maintenance
- −$1,190
- − Management
- −$1,190
- − Depreciation
- −$3,345
- Taxable income
- $410
- Est. tax owed @ 24.0%
- −$99
- After-tax cash flow
- $2,118/yr
For passive investors: Depreciation is non-cash, so a rental often shows a tax loss while cash-flowing — sheltering income. Rental losses are passive: they offset passive income freely, and up to $25,000/yr can offset ordinary (W-2) income if you actively participate and your MAGI is under $100k (phasing out to $0 by $150k); unused losses carry forward. On sale, claimed depreciation is recaptured at up to 25%, and gains may owe capital-gains tax (a 1031 exchange can defer both). Figures are a year-1 estimate at your 24.0% rate — not tax advice; consult a CPA.
Schools (NCES district)
- District
- Sloan-Hendrix School District
- NCES district ID
- 0512480
- Math proficiency
- 28% ▼ -6.00%
- Reading proficiency
- 28% ▼ -10.00%
- Median HH income
- $30,202
- Composite
- 22.66/100
- National rank
- #8048
- State rank
- #171 of 238 in AR
Livability — Imboden
- Score
- 64/100
- State rank
- #162
- US rank
- #13741
Category grades
Schools grade is shown separately in the Schools card above.
Census & demographics
- Census place
- Imboden, AR
- Population (ZIP)
- 2,206
Population outlook (Lawrence County) Hauer SSP2
- Today (2025)
- 15,453 people
- By 2030
- 14,697 · -4.9%
- By 2040
- 13,247 · -14.3%
- By 2050
- 11,937 · -22.8%
- By 2075
- 9,466 · -38.7%
- By 2100
- 7,441 · -51.8%
Race, ethnicity, and origin ACS 2023
- Neighborhood character
- Predominantly White (90%)
- Race & ethnicity
- White 90% Two or more races 9% Hispanic / Latino 2%
- Common ancestry
- Romanian 3% Serbian 2% Iranian 2%
- Foreign-born
- 2% · Canada
- Languages at home
- 92% English-only · Spanish 5% Other Asian/Pacific 4%
Political lean MEDSL · Lawrence
- 2024 margin
- Solid R (+64.0) · D 16.9% · R 81.0% · Other 2.1%
- 2008→2024 swing
- -43.1pp toward R · 2008: -20.9pp · 2024: -64.0pp
- All cycles
- 2024: R+64.0 2020: R+59.6 2016: R+49.8 2012: R+31.6 2008: R+20.9
Not yet ingested
- Civics
- —
Market trends
- HPI YoY
- ▲ 7.35%
- Current HPI
- 246.9032
- Rent YoY
- —
- Metro
- —
- State GDP YoY
- ▲ 3.80%
- F500 in state
- 10
Industry mix (Fortune 500 HQ in AR)
| Industry | F500 HQs | Revenue |
|---|---|---|
| Retail | 1 | $681B |
|
||
| Food / Agriculture | 1 | $53B |
|
||
| Retail / Energy | 1 | $22B |
|
||
| Transportation / Logistics | 1 | $12B |
|
||
| Energy | 1 | $4B |
|
||
Price history
+283.3% since first listed4 events — show timeline
- 2026-05-19 Pending — CARMLS
- 2026-05-11 Listed $115,000 CARMLS
- 2008-12-04 Sold (Public Records) $45,000 Public Records
- 2008-12-04 Sold (Public Records) $30,000 Public Records
Property tax history
-16.1%/yrLatest (2025): $52 · -28.7% YoY. Source: county tax records.
Cash-flow waterfall
monthlySold comps — $/sqft
last 12 mo · ≤1 miLoading sold comps…