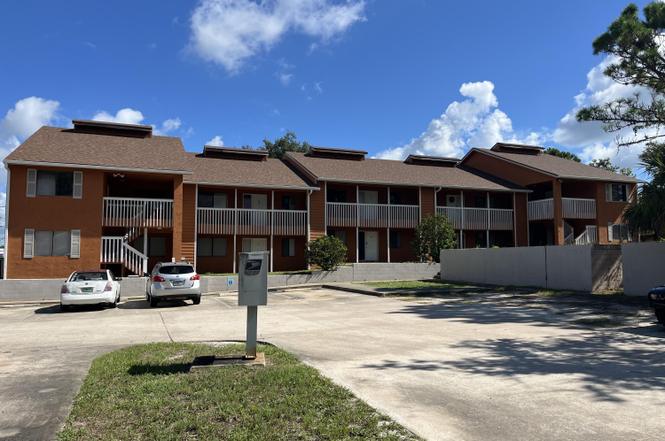
 10-Plex
2755 Barna Ave · Titusville, FL
Flood risk 1/10 · Minimal
- FEMA flood zone
- X (unshaded)
- Chance of flooding over 30 yrs
- 0.0%
- Est. flood insurance / yr
- $507 – $1,088
Fire risk 4/10 · Minor
- Est. fire insurance / yr
- $947 – $1,759
Heat risk 10/10 · Severe
- Hot days now (above 108°F)
- 7 days/yr
- Hot days in 30 yrs
- 22 days/yr
Wind risk 10/10 · Severe
- Chance of severe wind over 30 yrs
- 99.0%
Air-quality risk 1/10 · Minimal
- Unhealthy air days now
- 0 days/yr
- Unhealthy air days in 30 yrs
- 0 days/yr
Risk factors via First Street. Map © Google.
Why this score? — see what drove the C grade
The composite is a weighted blend of 9 inputs, each scored 0–100. Each bar is that input's sub-score; the figure is the points it added to the 100-point composite (weight × sub-score).
- Cash flow +22.9/30.0
- ARV discount +7.5/15.0
- DSCR +7.3/10.0
- 1% rule +6.0/10.0
- Schools +4.7/10.0
- Livability +4.2/5.0
- Rent growth +2.8/5.0
- Condition / age +2.5/5.0
- Appreciation +0.0/10.0
$1,500,000
🖨 Deal sheet 📄 Offer letter ✓ Due diligence
Multi-family units
County records classify this as Multi-Family (5+ Unit). Listing-text estimate: 10 units. confirmed
5+ unit building — per-unit beds/baths from public records are typically unavailable; the breakdown below (if shown) is an estimate from the listing text.
Listing remarks
This well-positioned 10-unit apartment complex offers a strong investment opportunity in the heart of town, just minutes from shopping and everyday conveniences. Property features a mix of four 3-bedroom units and six 2-bedroom units, appealing to a wide range of renters. Each unit is designed as a single level with a combo of ground-level and upstairs units providing variety and accessibility. Open parking ensures convenience for tenants and their guests. While the property offers no on-site amenities, its unbeatable central location keeps occupancy high and attracts long-term tenants seeking proximity to most needs. With strong rental demand and limited comparable inventory in the area, t
Key facts
- Strong rental demand
- Central location
- Open parking
Tags
Property features AI
Finance
- Financial info: Tax year 2023
Exterior
- Parking: Space for 12 vehicles (total)
- Utilities: Public sewer; Electricity connected; Sewer connected; Water connected
- Home design: Multi-family property; 2-story building; Single building on the lot
- Construction: Frame and stucco construction; Building area about 12,666 (total); Living area about 10,308
- Exterior features: Property faces south; Lot of about 0.53 acres
Interior
- Bedrooms: Total of 19 bedrooms across the property
- Heating & cooling: Central heating (electric); Central air conditioning
- Interior features: Multi-family current use; Unfurnished units
Neighborhood map
What this means for you Summary
Snapshot
- This is a 4×3bd/1.5ba + 6×2bd/1.5ba units multifamily listed at $1.50M.
Deal economics
- At list price, monthly cash flow is $3k ($32k/yr) — positive. Per door: $263/mo.
- The deal already cash-flows at list — no discount required.
- Meets the 1% rule at list price ($16k rent vs $1.50M).
- Recommended offer: $1.32M (12.0% below list) — sets the bar for market timing.
Location & tenants
- Location reads 84/100 on livability (#42 in FL, #668 nationally) — a professional / high-income tenant draw. Strengths: commute A+, cost of living A+, housing A+; Watch: crime D, employment D.
- Brevard (suburban): math 53% / reading 57% proficiency, ranked #19 of 73 in FL (top 26%) — acceptable for families but not a draw, mixed tenant base, ~2y average lease.
- Zoned schools: Coquina Elementary School (math 38% / reading 45%, grade F, #1,437 of 2,144 statewide, top 68%, 557 students, 75% FRL); Andrew Jackson Middle School (math 52% / reading 47%, grade C, #259 of 571 statewide, top 46%, 551 students, 58% FRL); Titusville High School (math 33% / reading 52%, grade F, #264 of 667 statewide, top 41%, 1,314 students, 55% FRL) — zoned schools average 63% FRL vs 43% district-wide (20 pts higher); higher-poverty schools than district average — tighter screening recommended.
- Market conditions: Rents rising (+1.3%/yr); 462 active listings in the ZIP; 4,602 units permitted in Brevard County in 2024 (702 in 5+ unit buildings).
- At $16,455/mo this rent would consume 292% of the median local household income ($68k/yr) (locally 1141% of renters already pay >50% of income on rent) — very limited rent-growth headroom before tenants either downsize or default.
Forward outlook
- Local home prices are declining (-3.0%/yr); year-one equity from $10k of loan paydown is wiped out by about $45k of value loss. Plan a longer hold.
- Brevard County population projected at +15% by 2050 — modest demand growth; plan on rents tracking national, not racing it.
Negotiation context
- It's been on market 145 days — a 12% lower offer ($1.32M) is reasonable based on typical stale-listing flexibility.
- 5 sale attempts with the ask held roughly flat each time — persistent listings suggest the price (not the market) is what's stuck; bring a comps-based counter.
- Current owner paid $78k; list at $1.50M implies a 1823% gain — meaningful room to come down on a strong offer.
Risks & watch-outs
- Climate carrying-cost: severe wind risk, 99% chance of damaging wind over 30y; extreme-heat days projected 7→22/yr by 2055 (HVAC capex compounding) — expect insurance premiums to compound above CPI over the hold.
Questions for the listing agent
- It's been on market 145 days. Have you received any prior offers? Is the seller open to a 12% concession, seller financing, or rate buy-down credit?
- Can we see the unit-by-unit rent roll, current vacancy, and any below-market leases? What's the average tenancy length?
- What capital expenditures (roof, boiler, parking lot, exteriors) have been made in the last 5 years, and what's planned in the next 2?
- Why hasn't it sold? Are there any deal-killer items the seller is aware of (foundation, flood, title, zoning, code violations)?
- Is there a deadline driving the sale (1031 exchange, divorce, estate, relocation)? That informs how much negotiation room exists.
- Crime grade is D in this area — have there been break-ins, vandalism, or insurance claims at this property in the last 3 years? What carrier currently insures it and at what premium?
- What's the average days-on-market for RENTAL listings here right now (not sales)? A rising rental-DOM trend means longer vacancies and softer asking-rent achievability than the comps imply.
- What's the recent tenant-quality profile in this submarket — average credit score on applications, eviction rate, late-payment / NSF rate, and stable-employment percentage? A property-management company in the area should have these aggregated.
- How much new apartment / multifamily construction is in the pipeline within 1–3 miles? Heavy new supply (>2% of stock underway) typically softens rents 12–24 months out; light construction supports rent growth.
Investment metrics
- 1% rule
- 1.10% ✓
- Cap rate
- 8.40%
- Cash-on-cash
- 7.52%
- DSCR
- 1.33
- GRM
- 7.6
CMA / ARV
No comps found within radius.
Projected returns pro-forma
-3.0% appreciation · 1.29% rent growth · sell at horizon
- IRR
- -6.7%
- Equity multiple
- 0.75×
- Total profit
- $-102,939
- Equity at exit
- $223,655
- IRR
- 0.6%
- Equity multiple
- 1.04×
- Total profit
- $16,958
- Equity at exit
- $129,693
Cash invested: $420,000 (down + closing). Projections, not guarantees.
Landlord ↔ Tenant lean methodology
- Overall (STATE)
- 87 Strongly Landlord-Friendly
- State Florida
- 87 Strongly Landlord-Friendly · R+3
- County
- — inherits STATE
- City
- — inherits STATE
ZIP-level market 32780
- Rents YoY
- 1.3%
- Active inventory
- 462
- Price-to-rent
- 73.5×
Monthly cashflow live
- Estimated rent
- $16,455 high interval (Pro) →
- Mortgage (P&I)
- −$7,866
- Tax est. 1.5%
- −$1,875 /mo · $22,500/yr
- Insurance
- −$625
- HOA
- −$0
- Vacancy / Maint / Mgmt
- −$3,456
- Net cashflow
- $2,633
Break-even live
10-unit breakdown (identical units grouped — click to expand)
| Units | Beds | Baths | Est. rent |
|---|---|---|---|
| 4× units | 3 | 1.5 | $6,808 |
| #1 | 3 | 1.5 | $1,702 |
| #2 | 3 | 1.5 | $1,702 |
| #3 | 3 | 1.5 | $1,702 |
| #4 | 3 | 1.5 | $1,702 |
| 6× units | 2 | 1.5 | $9,648 |
| #5 | 2 | 1.5 | $1,608 |
| #6 | 2 | 1.5 | $1,608 |
| #7 | 2 | 1.5 | $1,608 |
| #8 | 2 | 1.5 | $1,608 |
| #9 | 2 | 1.5 | $1,608 |
| #10 | 2 | 1.5 | $1,608 |
| Total (10 units) | $16,455 | ||
UW: 25.0% down · 7.5% · 30yr · 1.5% tax · 5.0% vac · 8.0% maint · 8.0% mgmt
Financing live
Cash to close
- Down payment
- $375,000
- Closing costs
- $45,000
- Reserves months
- —
- Total cash needed
- —
Loan-product check · same deal, 3 products live
Conventional
25% down · 7.5% · 30yr
- Down + closing
- —
- Monthly P&I
- —
- Monthly cashflow
- —
- DSCR
- —
- Eligible?
- —
Personal DTI + credit; lowest rate.
DSCR
20% down · 8.5% · 30yr
- Down + closing
- —
- Monthly P&I
- —
- Monthly cashflow
- —
- DSCR
- —
- Eligible?
- —
No personal income docs; deal must DSCR.
Hard money
10% down · 12.0% · 12mo
- Down + closing
- —
- Monthly P&I
- —
- Monthly cashflow
- —
- DSCR
- —
- Eligible?
- —
Short-term bridge; refi at stabilization.
Listing history 24 events
-
2026-06-18days on market $1,500,000 Active 145 DOM
-
2026-06-17days on market $1,500,000 Active 144 DOM
-
2026-06-16days on market $1,500,000 Active 143 DOM
-
2026-06-15days on market $1,500,000 Active 142 DOM
-
2026-06-14days on market $1,500,000 Active 140 DOM
-
2026-06-10days on market $1,500,000 Active 137 DOM
-
2026-06-08days on market $1,500,000 Active 135 DOM
-
2026-06-07days on market $1,500,000 Active 134 DOM
-
2026-06-05days on market $1,500,000 Active 131 DOM
-
2026-06-03days on market $1,500,000 Active 130 DOM
-
2026-06-02days on market $1,500,000 Active 129 DOM
-
2026-06-01days on market $1,500,000 Active 128 DOM
-
2026-05-31days on market $1,500,000 Active 127 DOM
-
2026-05-31days on market $1,500,000 Active 126 DOM
-
2026-01-27status Active
-
2025-12-31historical
-
2025-09-15status Active
-
2025-09-15status Active
-
2025-08-28status Pending
-
2025-08-28status Pending
-
2025-08-28historical
-
2025-08-26$1,500,000 Active
-
2025-08-25$1,500,000 Active
-
2001-11-14soldstatus $78,000
ⓘ Source: listings_history table (triggers on properties + properties_extension) + one-shot
backfill from property_details.listing_events for pre-trigger history.
Climate risk First Street
- Flood 1/10 Low FEMA zone X (unshaded) · 0% chance over 30 yrs
- Wildfire 4/10 Moderate
- Heat 10/10 Extreme 7 d/yr ≥108°F today · 22 d/yr by 30 yrs out
- Wind 10/10 Extreme 99% chance of damaging wind over 30 yrs
- Air quality 1/10 Low 0 unhealthy d/yr today · 0 by 30 yrs out
Nearby sold comps map
Loading sold comps map…
Walkable amenities ~0.75 mi
Loading nearby amenities…
Taxation est. · year 1
- Rental income
- $197,460
- − Mortgage interest
- −$84,023
- − Property taxes
- −$22,500
- − Insurance
- −$7,500
- − Repairs & maintenance
- −$15,797
- − Management
- −$15,797
- − Depreciation
- −$43,636
- Taxable income
- $8,207
- Est. tax owed @ 24.0%
- −$1,970
- After-tax cash flow
- $29,630/yr
For passive investors: Depreciation is non-cash, so a rental often shows a tax loss while cash-flowing — sheltering income. Rental losses are passive: they offset passive income freely, and up to $25,000/yr can offset ordinary (W-2) income if you actively participate and your MAGI is under $100k (phasing out to $0 by $150k); unused losses carry forward. On sale, claimed depreciation is recaptured at up to 25%, and gains may owe capital-gains tax (a 1031 exchange can defer both). Figures are a year-1 estimate at your 24.0% rate — not tax advice; consult a CPA.
Schools (NCES district)
- District
- Brevard
- NCES district ID
- 1200150
- Math proficiency
- 53% ▼ -9.00%
- Reading proficiency
- 57% ▼ -4.00%
- Median HH income
- $49,426
- Composite
- 46.86/100
- National rank
- #2370
- State rank
- #19 of 73 in FL
Livability — Titusville
- Score
- 84/100
- State rank
- #42
- US rank
- #668
Category grades
Schools grade is shown separately in the Schools card above.
Census & demographics
- Census place
- Titusville, FL
- County
- Brevard County · 602,871 people
- City population
- 60,286
- Metro
- Palm Bay-Melbourne-Titusville, FL
- Population (ZIP)
- 40,064
- Household income
- $67,690
- Rent vs Own
- Severe rent burden
- 1141.0
Population outlook (Brevard County) Hauer SSP2
- Today (2025)
- 623,254 people
- By 2030
- 648,420 · +4.0%
- By 2040
- 690,009 · +10.7%
- By 2050
- 715,669 · +14.8%
- By 2075
- 775,744 · +24.5%
- By 2100
- 776,687 · +24.6%
Race, ethnicity, and origin ACS 2023
- Neighborhood character
- Predominantly White (70%)
- Race & ethnicity
- White 70% Black 13% Hispanic / Latino 8% Two or more races 8% Asian 3%
- Hispanic origin (detail)
- Mexican 1% Puerto Rican 4% Cuban 1%
- Common ancestry
- Romanian 2% Slovak 2% Lithuanian 2%
- Foreign-born
- 8% · Canada, China
- Languages at home
- 89% English-only · Spanish 6% Other Indo-European 1% German/W. Germanic 1%
Political lean MEDSL · Brevard
- 2024 margin
- Strong R (+20.8) · D 39.1% · R 59.9% · Other 1.0%
- 2008→2024 swing
- -10.4pp toward R · 2008: -10.4pp · 2024: -20.8pp
- All cycles
- 2024: R+20.8 2020: R+16.4 2016: R+19.8 2012: R+12.7 2008: R+10.4
Not yet ingested
- Civics
- —
Market trends
- HPI YoY
- ▼ -162.54%
- Current HPI
- 297.151
- Rent YoY
- ▲ 1.29%
- Metro
- Palm Bay-Melbourne-Titusville, FL
- State GDP YoY
- ▲ 3.28%
- F500 in state
- 36
Industry mix (Fortune 500 HQ in FL)
| Industry | F500 HQs | Revenue |
|---|---|---|
| Industrial Technology | 2 | $29B |
|
||
| Insurance | 2 | $17B |
|
||
| Retail | 1 | $60B |
|
||
| Technology Distribution | 1 | $58B |
|
||
| Homebuilding | 1 | $35B |
|
||
| Technology Manufacturing | 1 | $35B |
|
||
Price history
+1823.1% since first listed10 events — show timeline
- 2026-01-27 Relisted — SCMLS
- 2025-12-31 Listing Removed — Stellar MLS as Distributed by MLS Grid
- 2025-09-15 Relisted — Stellar MLS as Distributed by MLS Grid
- 2025-09-15 Relisted — SCMLS
- 2025-08-28 Pending — Stellar MLS as Distributed by MLS Grid
- 2025-08-28 Pending — SCMLS
- 2025-08-28 Listing Removed — SCMLS
- 2025-08-26 Listed $1,500,000 Stellar MLS as Distributed by MLS Grid
- 2025-08-25 Listed $1,500,000 SCMLS
- 2001-11-14 Sold (Public Records) $78,000 Public Records
Property tax history
+12.3%/yrLatest (2025): $1,526 · +12.4% YoY. Source: county tax records.
Cash-flow waterfall
monthlySold comps — $/sqft
last 12 mo · ≤1 miLoading sold comps…