 5-Plex
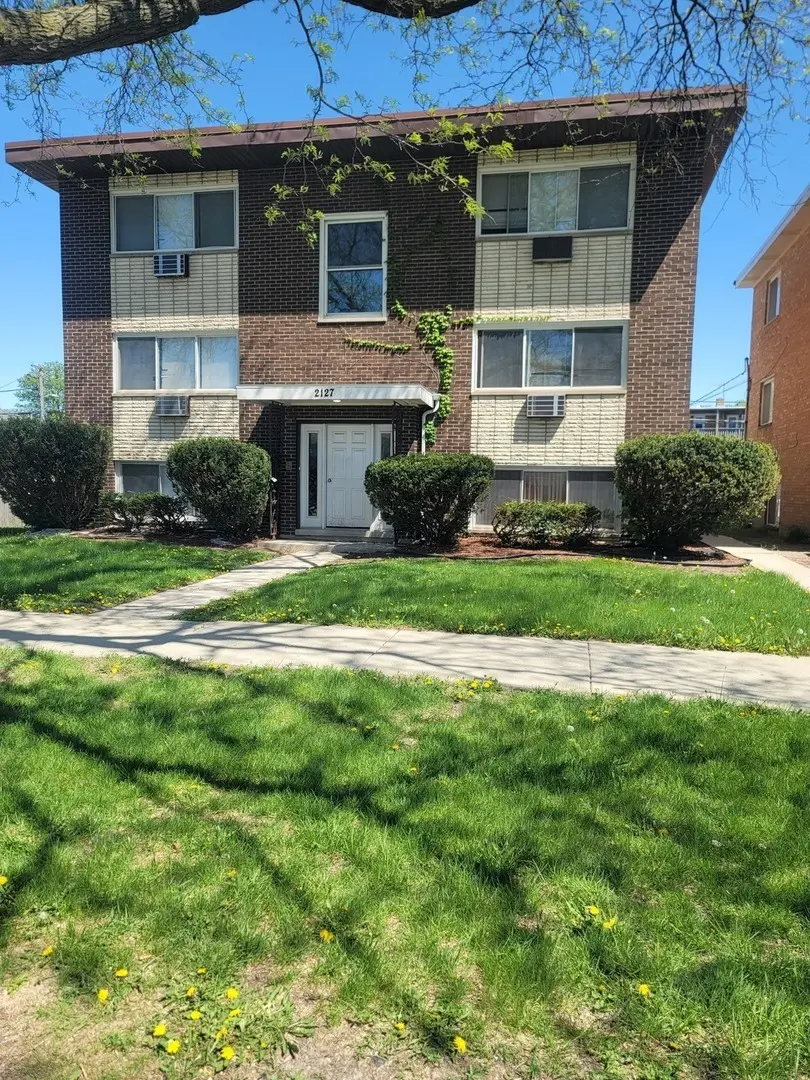
2127 S 15th Ave · Broadview, IL
Flood risk 3/10 · Minor
- FEMA flood zone
- X (unshaded)
- Chance of flooding over 30 yrs
- 0.2%
- Est. flood insurance / yr
- $473 – $860
Fire risk 1/10 · Minimal
- Est. fire insurance / yr
- $804 – $1,492
Heat risk 3/10 · Minor
- Hot days now (above 101°F)
- 7 days/yr
- Hot days in 30 yrs
- 14 days/yr
Wind risk 2/10 · Minimal
- Chance of severe wind over 30 yrs
- —
Air-quality risk 4/10 · Minor
- Unhealthy air days now
- 6 days/yr
- Unhealthy air days in 30 yrs
- 7 days/yr
Risk factors via First Street. Map © Google.
Why this score? — see what drove the C- grade
The composite is a weighted blend of 9 inputs, each scored 0–100. Each bar is that input's sub-score; the figure is the points it added to the 100-point composite (weight × sub-score).
- Cash flow +23.2/30.0
- ARV discount +7.5/15.0
- DSCR +7.4/10.0
- 1% rule +5.7/10.0
- Livability +3.9/5.0
- Rent growth +2.5/5.0
- Condition / age +2.5/5.0
- Schools +1.9/10.0
- Appreciation +0.0/10.0
$600,000
🖨 Deal sheet (PDF) 📄 Offer letter ✓ Due diligence
Multi-family units
County records classify this as Multi-Family (5+ Unit). Listing-text estimate: 5 units. confirmed
5+ unit building — per-unit beds/baths from public records are typically unavailable; the breakdown below (if shown) is an estimate from the listing text.
Listing remarks MLS
sold before print!!
Key facts
- Fully leased
- Turnkey
- Solid location
Tags
Property features AI
Finance
- Other: Possession at closing
- Financial info: Total monthly income approximately $7,050; Reported gross income $7,050; Example unit monthly rents: 1-bedroom units $1,400; 3-bedroom unit $1,750; Reported expenses (examples): water/sewer $2,600, electric $5,100, trash $1,200, insurance $7,500
Exterior
- Utilities: Water expense (owner projection); Electric service; Trash service
- Home design: Multi-family building (5+ units)
- Construction: Brick construction; Built before 1978
- Exterior features: Lot dimensions approximately 126.4 x 25 x 126.4 x 25
Interior
- Kitchen: Five ranges (stoves) across the building
- Bedrooms: Four 1-bedroom units; One 3-bedroom unit
- Bathrooms: Four units with 1 full bathroom; One unit with 2 full bathrooms
- Heating & cooling: Gas heating; Baseboard heating
- Interior features: Building contains 5 total units; Leased tenancy
- Laundry & utility: One washer and one dryer in the building; Washer/Dryer not leased
Neighborhood map
What this means for you Summary
Snapshot
- This is a 4×1bd/1ba + 1×3bd/1ba units multifamily listed at $600k.
Deal economics
- At list price, monthly cash flow is $1k ($13k/yr) — positive. Per door: $217/mo.
- The deal already cash-flows at list — no discount required.
- Meets the 1% rule at list price ($6k rent vs $600k).
- Recommended offer: $591k (1.5% below list) — sets the bar for market timing.
Location & tenants
- Location reads 77/100 on livability (#164 in IL, #3,027 nationally) — a middle-class / working-renter tenant base. Strengths: commute A+, cost of living A+, housing A+; Watch: health & safety D+, amenities F.
- Maywood-Melrose Park-Broadview 89 (suburban): math 14% / reading 21% proficiency, ranked #738 of 919 in IL (top 80%) — low school quality limits family demand, transient renter base, plan for 1-2y turnover; 74% free/reduced lunch — lower-income household profile, screen leases tightly.
- Zoned schools: Washington Dual Language Academy (363 students, 0% FRL); Proviso West High School (math 6% / reading 11%, grade F, #584 of 693 statewide, top 85%, 1,868 students, 0% FRL) — zoned schools average 0% FRL vs 74% district-wide (74 pts lower); this property's tenant base skews higher-income than the district average.
- Market conditions: 8 active listings in the ZIP; 6,272 units permitted in Cook County in 2024 (4,658 in 5+ unit buildings).
- At $6,426/mo this rent would consume 119% of the median local household income ($65k/yr) (locally 276% of renters already pay >50% of income on rent) — very limited rent-growth headroom before tenants either downsize or default.
Forward outlook
- Local home prices are declining (-3.0%/yr); year-one equity from $4k of loan paydown is wiped out by about $18k of value loss. Plan a longer hold.
Negotiation context
- It's been on market 19 days — a 2% lower offer ($591k) is reasonable based on typical stale-listing flexibility.
- 7 sale attempts since 10y ago with the ask held roughly flat each time — persistent listings suggest the price (not the market) is what's stuck; bring a comps-based counter.
Questions for the listing agent
- Can we see the unit-by-unit rent roll, current vacancy, and any below-market leases? What's the average tenancy length?
- What capital expenditures (roof, boiler, parking lot, exteriors) have been made in the last 5 years, and what's planned in the next 2?
- Built in 1965 — when were the roof, HVAC, electrical panel, plumbing, and water heater last replaced?
- Is there a deadline driving the sale (1031 exchange, divorce, estate, relocation)? That informs how much negotiation room exists.
- Schools are F-rated, which usually means shorter tenancies and higher turnover. Who's the typical renter profile here, and what's been the actual vacancy rate?
- What's the average days-on-market for RENTAL listings here right now (not sales)? A rising rental-DOM trend means longer vacancies and softer asking-rent achievability than the comps imply.
- What's the recent tenant-quality profile in this submarket — average credit score on applications, eviction rate, late-payment / NSF rate, and stable-employment percentage? A property-management company in the area should have these aggregated.
- How much new apartment / multifamily construction is in the pipeline within 1–3 miles? Heavy new supply (>2% of stock underway) typically softens rents 12–24 months out; light construction supports rent growth.
Investment metrics
- 1% rule
- 1.07% ✓
- Cap rate
- 8.46%
- Cash-on-cash
- 7.74%
- DSCR
- 1.34
- GRM
- 7.8
CMA / ARV
No comps found within radius.
Projected returns pro-forma
-3.0% appreciation · 3.0% rent growth · sell at horizon
- IRR
- -4.5%
- Equity multiple
- 0.83×
- Total profit
- $-28,180
- Equity at exit
- $89,462
- IRR
- 5.2%
- Equity multiple
- 1.38×
- Total profit
- $64,376
- Equity at exit
- $51,877
Cash invested: $168,000 (down + closing). Projections, not guarantees.
Landlord ↔ Tenant lean methodology
- Overall (STATE)
- 43 Moderately Tenant-Leaning
- State Illinois
- 43 Moderately Tenant-Leaning · D+7
- County
- — inherits STATE
- City
- — inherits STATE
ZIP-level market 60155
- Home prices YoY
- -27.5%
- Active inventory
- 8
- Price-to-rent
- 40.9×
Monthly cashflow live
- Estimated rent
- $6,426 high interval (Pro) →
- Mortgage (P&I)
- −$3,146
- Tax from tax record
- −$596 /mo · $7,152/yr
- Insurance
- −$250
- HOA
- −$0
- Vacancy / Maint / Mgmt
- −$1,349
- Net cashflow
- $1,084
Break-even live
Sensitivity live
| Price | -10% $1,424 | -5% $1,254 | +0% $1,084 | +5% $914 | +10% $744 |
|---|---|---|---|---|---|
| Rent | -10% $576 | -5% $830 | +0% $1,084 | +5% $1,338 | +10% $1,592 |
| Rate | -1.0pp $1,386 | -0.5pp $1,237 | base $1,084 | +0.5pp $929 | +1.0pp $770 |
5-unit breakdown (identical units grouped — click to expand)
| Units | Beds | Baths | Est. rent |
|---|---|---|---|
| 4× units | 1 | 1 | $4,888 |
| #1 | 1 | 1 | $1,222 |
| #2 | 1 | 1 | $1,222 |
| #3 | 1 | 1 | $1,222 |
| #4 | 1 | 1 | $1,222 |
| 1× unit | 3 | 1 | $1,538 |
| Total (5 units) | $6,426 | ||
UW: 25.0% down · 7.5% · 30yr · 1.5% tax · 5.0% vac · 8.0% maint · 8.0% mgmt
Financing live
Cash to close
- Down payment
- $150,000
- Closing costs
- $18,000
- Reserves months
- —
- Total cash needed
- —
Loan-product check · same deal, 3 products live
Conventional
25% down · 7.5% · 30yr
- Down + closing
- —
- Monthly P&I
- —
- Monthly cashflow
- —
- DSCR
- —
- Eligible?
- —
Personal DTI + credit; lowest rate.
DSCR
20% down · 8.5% · 30yr
- Down + closing
- —
- Monthly P&I
- —
- Monthly cashflow
- —
- DSCR
- —
- Eligible?
- —
No personal income docs; deal must DSCR.
Hard money
10% down · 12.0% · 12mo
- Down + closing
- —
- Monthly P&I
- —
- Monthly cashflow
- —
- DSCR
- —
- Eligible?
- —
Short-term bridge; refi at stabilization.
Listing history 20 events
-
2026-05-04status Pending
-
2026-04-26status Active
-
2026-04-14$600,000 Active
-
2024-04-08historical
-
2024-03-26status Active
-
2024-02-09status Pending
-
2023-06-06Active
-
2022-04-25soldstatus $530,000
-
2019-06-19soldstatus $425,000
-
2019-06-13soldstatus $425,000 Closed Sale 19-char remark
Show marketing remark (19 chars)
sold before print!!
-
2019-06-04status Pending 19-char remark
Show marketing remark (19 chars)
sold before print!!
-
2019-05-30historical 19-char remark
Show marketing remark (19 chars)
sold before print!!
-
2019-05-30$450,000 19-char remark
Show marketing remark (19 chars)
sold before print!!
-
2017-03-31historical
-
2017-01-27New
-
2017-01-26historical
-
2016-09-23price
-
2016-09-22price
-
2016-07-19New
-
2015-04-29soldstatus $180,000
ⓘ Source: listings_history table (triggers on properties + properties_extension) + one-shot
backfill from property_details.listing_events for pre-trigger history.
Tax reassessment forecast IL · Partial reset (capped growth)
- Current annual tax
- $7,152 · $596/mo
- Projected year-2 tax
- $10,386 · $866/mo
- Expected delta
- +$3,234/yr (+$269/mo · 45.2%)
ⓘ Screening estimate from a state-policy table — verify with the county assessor before closing.
Climate risk First Street
- Flood 3/10 Moderate FEMA zone X (unshaded) · 20% chance over 30 yrs
- Wildfire 1/10 Low
- Heat 3/10 Moderate 7 d/yr ≥101°F today · 14 d/yr by 30 yrs out
- Wind 2/10 Low
- Air quality 4/10 Moderate 6 unhealthy d/yr today · 7 by 30 yrs out
Nearby sold comps map
Loading sold comps map…
Walkable amenities ~0.75 mi
Loading nearby amenities…
Taxation est. · year 1
- Rental income
- $77,112
- − Mortgage interest
- −$33,609
- − Property taxes
- −$7,152
- − Insurance
- −$3,000
- − Repairs & maintenance
- −$6,169
- − Management
- −$6,169
- − Depreciation
- −$17,455
- Taxable income
- $3,558
- Est. tax owed @ 24.0%
- −$854
- After-tax cash flow
- $12,155/yr
For passive investors: Depreciation is non-cash, so a rental often shows a tax loss while cash-flowing — sheltering income. Rental losses are passive: they offset passive income freely, and up to $25,000/yr can offset ordinary (W-2) income if you actively participate and your MAGI is under $100k (phasing out to $0 by $150k); unused losses carry forward. On sale, claimed depreciation is recaptured at up to 25%, and gains may owe capital-gains tax (a 1031 exchange can defer both). Figures are a year-1 estimate at your 24.0% rate — not tax advice; consult a CPA.
Schools (NCES district)
- District
- Maywood-Melrose Park-Broadview 89
- NCES district ID
- 1725110
- Math proficiency
- 14% ▲ 1.00%
- Reading proficiency
- 21% ▲ 4.00%
- Median HH income
- $45,567
- Composite
- 18.75/100
- National rank
- #14003
- State rank
- #738 of 919 in IL
Livability — Broadview
- Score
- 77/100
- State rank
- #164
- US rank
- #3027
Category grades
Schools grade is shown separately in the Schools card above.
Census & demographics
- Census place
- Broadview, IL
- County
- Cook County · 4,486,803 people
- City population
- 7,906
- Metro
- Chicago-Naperville-Elgin, IL-IN-WI
- Population (ZIP)
- 7,906
- Household income
- $64,566
- Rent vs Own
- Severe rent burden
- 276.0
Population outlook (Cook County) Hauer SSP2
- Today (2025)
- 5,347,519 people
- By 2030
- 5,357,703 · +0.2%
- By 2040
- 5,324,924 · -0.4%
- By 2050
- 5,230,762 · -2.2%
- By 2075
- 4,785,735 · -10.5%
- By 2100
- 4,188,836 · -21.7%
Race, ethnicity, and origin ACS 2023
- Neighborhood character
- Majority Black (63%)
- Race & ethnicity
- Black 63% Hispanic / Latino 21% White 11% Two or more races 4% Asian 2%
- Hispanic origin (detail)
- Mexican 16%
- Common ancestry
- Romanian 2% Iranian 1% Italian 1%
- Foreign-born
- 11% · Canada, Vietnam
- Languages at home
- 74% English-only · Spanish 25% Vietnamese 1%
Political lean MEDSL · Cook
- 2024 margin
- Solid D (+42.0) · D 70.4% · R 28.4% · Other 1.2%
- 2008→2024 swing
- -11.4pp toward R · 2008: 53.4pp · 2024: 42.0pp
- All cycles
- 2024: D+42.0 2020: D+50.3 2016: D+53.0 2012: D+49.4 2008: D+53.4
Not yet ingested
- Civics
- —
Market trends
- HPI YoY
- ▼ -94.85%
- Current HPI
- 250.0983
- Rent YoY
- —
- Metro
- Chicago-Naperville-Elgin, IL-IN-WI
- State GDP YoY
- ▲ 1.59%
- F500 in state
- 60
Industry mix (Fortune 500 HQ in IL)
| Industry | F500 HQs | Revenue |
|---|---|---|
| Insurance | 4 | $201B |
|
||
| Consumer Goods | 4 | $87B |
|
||
| Industrial Machinery | 3 | $64B |
|
||
| Healthcare | 2 | $55B |
|
||
| Retail / Pharmacy | 1 | $148B |
|
||
| Agriculture / Food | 1 | $86B |
|
||
Price history
+233.3% since first listed20 events — show timeline
- 2026-05-04 Pending — MRED as Distributed by MLS Grid
- 2026-04-26 Relisted — MRED as Distributed by MLS Grid
- 2026-04-14 Listed $600,000 MRED as Distributed by MLS Grid
- 2024-04-08 Listing Removed — MRED as Distributed by MLS Grid
- 2024-03-26 Relisted — MRED as Distributed by MLS Grid
- 2024-02-09 Pending — MRED as Distributed by MLS Grid
- 2023-06-06 Listed — MRED as Distributed by MLS Grid
- 2022-04-25 Sold (Public Records) $530,000 Public Records
- 2019-06-19 Sold (Public Records) $425,000 Public Records
- 2019-06-13 Sold (MLS) $425,000 MRED as Distributed by MLS Grid
- 2019-06-04 Pending — MRED as Distributed by MLS Grid
- 2019-05-30 Listed $450,000 MRED as Distributed by MLS Grid
- 2019-05-30 Listing Removed — MRED as Distributed by MLS Grid
- 2017-03-31 Listing Removed — MRED as Distributed by MLS Grid
- 2017-01-27 Listed — MRED as Distributed by MLS Grid
- 2017-01-26 Listing Removed — MRED as Distributed by MLS Grid
- 2016-09-23 Price Changed — MRED as Distributed by MLS Grid
- 2016-09-22 Price Changed — MRED as Distributed by MLS Grid
- 2016-07-19 Listed — MRED as Distributed by MLS Grid
- 2015-04-29 Sold (Public Records) $180,000 Public Records
Property tax history
+4.5%/yrLatest (2023): $7,152 · +14.5% YoY. Source: county tax records.
Cash-flow waterfall
monthlySold comps — $/sqft
last 12 mo · ≤1 miLoading sold comps…