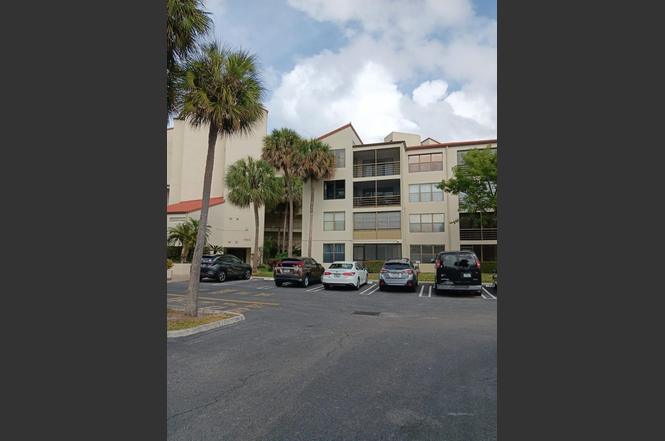
2304 S Cypress Bend Dr #313 · Pompano Beach, FL
Flood risk 1/10 · Minimal
- FEMA flood zone
- X (shaded)
- Chance of flooding over 30 yrs
- 0.0%
- Est. flood insurance / yr
- $507 – $1,088
Fire risk 1/10 · Minimal
- Est. fire insurance / yr
- $947 – $1,759
Heat risk 9/10 · Severe
- Hot days now (above 106°F)
- 6 days/yr
- Hot days in 30 yrs
- 21 days/yr
Wind risk 10/10 · Severe
- Chance of severe wind over 30 yrs
- 99.0%
Air-quality risk 3/10 · Minor
- Unhealthy air days now
- 3 days/yr
- Unhealthy air days in 30 yrs
- 3 days/yr
Risk factors via First Street. Map © Google.
Why this score? — see what drove the C- grade
The composite is a weighted blend of 9 inputs, each scored 0–100. Each bar is that input's sub-score; the figure is the points it added to the 100-point composite (weight × sub-score).
- Cash flow +15.8/30.0
- 1% rule +10.0/10.0
- ARV discount +7.5/15.0
- DSCR +4.9/10.0
- Schools +4.1/10.0
- Livability +3.7/5.0
- Appreciation +3.4/10.0
- Condition / age +2.5/5.0
- Rent growth +2.4/5.0
$129,000
🖨 Deal sheet (PDF) 📄 Offer letter ✓ Due diligence
Listing remarks
This cozy 1-bed, 1.5-bath condo on the 3rd floor is set in a great central South Florida location. Offering peaceful garden views and a space ready for the right buyer to give this unit the love it deserves. Needs new flooring—carpet is in rough shape. It's a great opportunity for cash buyers or conventional loans (with insurance coverage). Building's environmental report didn’t pass for structural, so financing is limited. Perfect for investors or buyers ready to bring this space to life! Don’t miss out on this deal!
Key facts
- $499 HOA
- Community pool
- Built 1974
Neighborhood map
What this means for you Summary
Snapshot
- This is a 1-bed/2.0-bath condo listed at $129k.
Deal economics
- At list price, monthly cash flow is $60 ($715/yr) — positive.
- The deal already cash-flows at list — no discount required.
- Meets the 1% rule at list price ($2k rent vs $129k).
- Cap rate 6.8% vs local median 3.1% in Pompano Beach — top-decile yield for the area; either an underpriced asset or a hidden risk that comps aren't pricing in. Stress-test before assuming the spread holds.
Location & tenants
- Location reads 74/100 on livability (#284 in FL, #4,541 nationally) — a middle-class / working-renter tenant base. Strengths: commute A+, housing A+, cost of living B+; Watch: employment D+, amenities F.
- Broward (suburban): math 42% / reading 53% proficiency, ranked #46 of 73 in FL (top 63%) — families likely to look elsewhere, expect single-tenant / working-renter base with shorter leases.
- Zoned schools: Nova Blanche Forman Elementary (math 35% / reading 55%, grade D-, #1,271 of 2,144 statewide, top 60%, 769 students, 72% FRL); Nova Middle School (math 44% / reading 53%, grade C-, #274 of 571 statewide, top 50%, 1,284 students, 68% FRL); Nova High School (math 22% / reading 56%, grade F, #312 of 667 statewide, top 48%, 2,227 students, 59% FRL) — zoned schools average 66% FRL vs 51% district-wide (15 pts higher); higher-poverty schools than district average — tighter screening recommended.
- Market conditions: Rents soft (-0.3%/yr); 445 active listings in the ZIP; 40 comparable units currently listed for rent nearby; rentals at typical pace (median 23d on market — plan ~3-4 weeks tenant-placement turnaround); 2,111 units permitted in Broward County in 2024 (1,265 in 5+ unit buildings).
- This rent runs 40% of the median local income ($60k/yr) — at the standard rent-burdened threshold; future hikes will face affordability resistance.
Forward outlook
- Local home prices are declining (-3.0%/yr); year-one equity from $892 of loan paydown is wiped out by about $4k of value loss. Plan a longer hold.
- Broward County population projected at +34% by 2050 — long-run rental-demand tailwind backs the buy-and-hold thesis.
Negotiation context
- Only 0 days on market — expect competitive offers; lowballing is unlikely to land.
Risks & watch-outs
- Watch-outs: HOA is 25% of rent.
- Climate carrying-cost: severe wind risk, 99% chance of damaging wind over 30y; extreme-heat days projected 6→21/yr by 2055 (HVAC capex compounding) — expect insurance premiums to compound above CPI over the hold.
Questions for the listing agent
- Built in 1974 — when were the roof, HVAC, electrical panel, plumbing, and water heater last replaced?
- What does the HOA fee cover, when was the last increase, and are there any pending special assessments or reserve-fund shortfalls?
- Any open or pending special assessments — roof, HVAC, plumbing, elevator, façade? What's the per-unit balance and payoff schedule, and is the seller paying it off at close or rolling it to the buyer?
- Is there a deadline driving the sale (1031 exchange, divorce, estate, relocation)? That informs how much negotiation room exists.
- Schools are D-rated, which usually means shorter tenancies and higher turnover. Who's the typical renter profile here, and what's been the actual vacancy rate?
- What's the average days-on-market for RENTAL listings here right now (not sales)? A rising rental-DOM trend means longer vacancies and softer asking-rent achievability than the comps imply.
- What's the recent tenant-quality profile in this submarket — average credit score on applications, eviction rate, late-payment / NSF rate, and stable-employment percentage? A property-management company in the area should have these aggregated.
- How much new apartment / multifamily construction is in the pipeline within 1–3 miles? Heavy new supply (>2% of stock underway) typically softens rents 12–24 months out; light construction supports rent growth.
Investment metrics
- 1% rule
- 1.53% ✓
- Cap rate
- 6.85%
- Cash-on-cash
- 1.98%
- DSCR
- 1.09
- GRM
- 5.5
CMA / ARV
No comps found within radius.
Projected returns pro-forma
-3.0% appreciation · 0.0% rent growth · sell at horizon
- IRR
- -18.5%
- Equity multiple
- 0.38×
- Total profit
- $-22,478
- Equity at exit
- $19,234
- IRR
- -26.8%
- Equity multiple
- 0.02×
- Total profit
- $-35,360
- Equity at exit
- $11,154
Cash invested: $36,120 (down + closing). Projections, not guarantees.
Landlord ↔ Tenant lean methodology
- Overall (STATE)
- 87 Strongly Landlord-Friendly
- State Florida
- 87 Strongly Landlord-Friendly · R+3
- County
- — inherits STATE
- City
- — inherits STATE
ZIP-level market 33069
- Home prices YoY
- -1.1%
- Rents YoY
- -0.3%
- Active inventory
- 445
- Price-to-rent
- 5.5×
Monthly cashflow live
- Estimated rent
- $1,969 high interval (Pro) →
- Mortgage (P&I)
- −$676
- Tax from tax record
- −$267 /mo · $3,202/yr
- Insurance
- −$54
- HOA
- −$499
- Vacancy / Maint / Mgmt
- −$414
- Net cashflow
- $60
Break-even live
Sensitivity live
| Price | -10% $133 | -5% $96 | +0% $60 | +5% $23 | +10% $-13 |
|---|---|---|---|---|---|
| Rent | -10% $-96 | -5% $-18 | +0% $60 | +5% $137 | +10% $215 |
| Rate | -1.0pp $125 | -0.5pp $92 | base $60 | +0.5pp $26 | +1.0pp $-8 |
UW: 25.0% down · 7.5% · 30yr · 1.5% tax · 5.0% vac · 8.0% maint · 8.0% mgmt
Financing live
Cash to close
- Down payment
- $32,250
- Closing costs
- $3,870
- Reserves months
- —
- Total cash needed
- —
Loan-product check · same deal, 3 products live
Conventional
25% down · 7.5% · 30yr
- Down + closing
- —
- Monthly P&I
- —
- Monthly cashflow
- —
- DSCR
- —
- Eligible?
- —
Personal DTI + credit; lowest rate.
DSCR
20% down · 8.5% · 30yr
- Down + closing
- —
- Monthly P&I
- —
- Monthly cashflow
- —
- DSCR
- —
- Eligible?
- —
No personal income docs; deal must DSCR.
Hard money
10% down · 12.0% · 12mo
- Down + closing
- —
- Monthly P&I
- —
- Monthly cashflow
- —
- DSCR
- —
- Eligible?
- —
Short-term bridge; refi at stabilization.
Rent comps 40 comps
| Address | Beds | Baths | Sqft | Rent | $/sqft | DOM | Units | Dist |
|---|---|---|---|---|---|---|---|---|
| 2751 S Palm Aire Dr #107 Pompano Beach, FL | 2.0 | 2.0 | 1112 | $1,950 | $1.75 | 4d | 1 | 0.54mi |
| 2650 S Course Dr #603 Pompano Beach, FL | 2.0 | 2.0 | 1100 | $3,000 | $2.73 | 20d | 1 | 0.56mi |
| 2500 SW 7th St Pompano Beach, FL | 3.0 | 1.0–3.0 | 1216 | $3,091 | $2.54 | 0d | 137 | 0.60mi |
| 2851 S Palm Aire Dr #107 Pompano Beach, FL | 1.0 | 1.5 | 960 | $1,750 | $1.82 | 0d | 1 | 0.63mi |
| 2851 S Palm Aire Dr #309 Pompano Beach, FL | 2.0 | 2.0 | 1100 | $1,750 | $1.59 | 26d | 1 | 0.63mi |
| 2851 S Palm Aire Dr #309 Pompano Beach, FL | 2.0 | 2.0 | 1100 | $1,750 | $1.59 | 18d | 1 | 0.63mi |
| 2851 S Palm Aire Dr #407 Pompano Beach, FL | 1.0 | 1.5 | 900 | $1,675 | $1.86 | 26d | 1 | 0.63mi |
| 6500 N Andrews Ave Fort Lauderdale, FL | 2.0 | 1.0–2.0 | 943 | $2,611 | $2.77 | 0d | 31 | 0.65mi |
| 2671 S Course Dr #506 Pompano Beach, FL | 2.0 | 2.0 | 1100 | $2,250 | $2.05 | 9d | 1 | 0.66mi |
| 2671 S Course Dr #806 Pompano Beach, FL | 2.0 | 2.0 | 1100 | $2,250 | $2.05 | 16d | 1 | 0.66mi |
| 2671 S Course Dr #108 Pompano Beach, FL | 2.0 | 2.0 | 1100 | $1,900 | $1.73 | 0d | 1 | 0.66mi |
| 2671 S Course Dr #506 Pompano Beach, FL | 2.0 | 2.0 | 1100 | $2,250 | $2.05 | 26d | 1 | 0.66mi |
| 2671 S Course Dr #206 Pompano Beach, FL | 2.0 | 2.0 | 1100 | $2,000 | $1.82 | 26d | 1 | 0.66mi |
| 2901 S Palm Aire Dr #307 Pompano Beach, FL | 1.0 | 1.5 | 920 | $1,640 | $1.78 | 20d | 1 | 0.70mi |
| 2900 N Palm Aire Dr #405 Pompano Beach, FL | 1.0 | 1.0 | 860 | $1,625 | $1.89 | 19d | 1 | 0.83mi |
| 2900 N Palm Aire Dr #206 Pompano Beach, FL | 1.0 | 1.0 | 860 | $1,650 | $1.92 | 26d | 1 | 0.83mi |
| 2850 N Palm Aire Dr Pompano Beach, FL | 1.0 | 1.5 | 850 | $2,000 | $2.35 | 26d | 1 | 0.83mi |
| 3051 S Palm Aire Dr #407 Pompano Beach, FL | 2.0 | 2.0 | 1064 | $2,200 | $2.07 | 26d | 1 | 0.84mi |
| 2751 N Palm Aire Dr #402 Pompano Beach, FL | 2.0 | 2.0 | 1064 | $2,300 | $2.16 | 26d | 1 | 0.89mi |
| 2801 N Palm Aire Dr #308 Pompano Beach, FL | 2.0 | 2.0 | 1100 | $1,950 | $1.77 | 26d | 1 | 0.89mi |
| 3151 S Palm Aire Dr #407 Pompano Beach, FL | 2.0 | 2.0 | 1064 | $2,200 | $2.07 | 26d | 1 | 0.93mi |
| 3050 N Palm Aire Dr #602 Pompano Beach, FL | 2.0 | 2.0 | 1100 | $1,895 | $1.72 | 22d | 1 | 0.98mi |
| 3050 N Palm Aire Dr #704 Pompano Beach, FL | 1.0 | 1.5 | 900 | $1,900 | $2.11 | 17d | 1 | 0.98mi |
| 3050 N Palm Aire Dr #508 Pompano Beach, FL | 2.0 | 2.0 | 1100 | $2,100 | $1.91 | 26d | 1 | 0.98mi |
| 3050 N Palm Aire Dr #704 Pompano Beach, FL | 1.0 | 1.5 | 900 | $1,900 | $2.11 | 18d | 1 | 0.98mi |
| 3100 N Palm Aire Dr #107 Pompano Beach, FL | 1.0 | 2.0 | 960 | $1,800 | $1.88 | 26d | 1 | 1.04mi |
| 2940 N Course Dr Pompano Beach, FL | 1.0 | 1.0 | 1100 | $1,050 | $0.95 | 26d | 1 | 1.05mi |
| 2940 N Course Dr #910 Pompano Beach, FL | 2.0 | 2.0 | 1100 | $1,950 | $1.77 | 26d | 1 | 1.05mi |
| 2940 N Course Dr #311 Pompano Beach, FL | 2.0 | 2.0 | 1100 | $2,500 | $2.27 | 12d | 1 | 1.05mi |
| 3150 N Palm Aire Dr #307 Pompano Beach, FL | 1.0 | 1.5 | 900 | $1,700 | $1.89 | 26d | 1 | 1.11mi |
| 2801 N Course Dr Pompano Beach, FL | 1.0–2.0 | 1.0–2.0 | 991 | $1,845 | $1.86 | 26d | 12 | 1.13mi |
| 3300 N Palm Aire Dr #109 Pompano Beach, FL | 2.0 | 2.0 | 1100 | $2,400 | $2.18 | 20d | 1 | 1.15mi |
| 2803 N Course Dr #203 Pompano Beach, FL | 2.0 | 2.0 | 1120 | $2,100 | $1.88 | 22d | 1 | 1.16mi |
| 2803 N Course Dr #203 Pompano Beach, FL | 2.0 | 2.0 | 1120 | $2,050 | $1.83 | 5d | 1 | 1.16mi |
| 3250 N Palm Aire Dr #202 Pompano Beach, FL | 2.0 | 2.0 | 1100 | $2,300 | $2.09 | 26d | 1 | 1.19mi |
| 2829 N Course Dr #104 Pompano Beach, FL | 2.0 | 2.0 | 1020 | $1,950 | $1.91 | 22d | 1 | 1.22mi |
| 3051 N Course Dr #509 Pompano Beach, FL | 2.0 | 2.0 | 1100 | $1,795 | $1.63 | 26d | 1 | 1.24mi |
| 3100 N Course Ln #208 Pompano Beach, FL | 2.0 | 2.0 | 1100 | $1,850 | $1.68 | 12d | 1 | 1.24mi |
| 3100 N Course Ln #208 Pompano Beach, FL | 2.0 | 2.0 | 1100 | $1,850 | $1.68 | 7d | 1 | 1.24mi |
| 2809 N Course Dr #205 Pompano Beach, FL | 1.0 | 1.0 | 735 | $1,700 | $2.31 | 26d | 1 | 1.25mi |
HOA detail condo
- Monthly dues
- $499 · $5,988/yr
- Assessments
- None detected in remarks — confirm with the listing agent.
Listing history 5 events
-
2025-06-17soldstatus $120,000
-
2025-04-30historical
-
2025-03-06$129,000
-
2003-07-30soldstatus $86,000
-
1976-03-01soldstatus $24,700
ⓘ Source: listings_history table (triggers on properties + properties_extension) + one-shot
backfill from property_details.listing_events for pre-trigger history.
Tax reassessment forecast FL · Resets to sale price
- Current annual tax
- $3,202 · $267/mo
- Projected year-2 tax
- $3,202 · $267/mo
- Expected delta
- $0/yr ($0/mo · 0.0%)
ⓘ Screening estimate from a state-policy table — verify with the county assessor before closing.
Climate risk First Street
- Flood 1/10 Low FEMA zone X (shaded) · 0% chance over 30 yrs
- Wildfire 1/10 Low
- Heat 9/10 Extreme 6 d/yr ≥106°F today · 21 d/yr by 30 yrs out
- Wind 10/10 Extreme 99% chance of damaging wind over 30 yrs
- Air quality 3/10 Moderate 3 unhealthy d/yr today · 3 by 30 yrs out
Nearby sold comps map
Loading sold comps map…
Walkable amenities ~0.75 mi
Loading nearby amenities…
Taxation est. · year 1
- Rental income
- $23,630
- − Mortgage interest
- −$7,226
- − Property taxes
- −$3,202
- − Insurance
- −$645
- − Repairs & maintenance
- −$1,890
- − Management
- −$1,890
- − HOA
- −$5,988
- − Depreciation
- −$3,753
- Taxable loss
- −$964
- Est. tax savings @ 24.0%
- +$231
- After-tax cash flow
- $946/yr
For passive investors: Depreciation is non-cash, so a rental often shows a tax loss while cash-flowing — sheltering income. Rental losses are passive: they offset passive income freely, and up to $25,000/yr can offset ordinary (W-2) income if you actively participate and your MAGI is under $100k (phasing out to $0 by $150k); unused losses carry forward. On sale, claimed depreciation is recaptured at up to 25%, and gains may owe capital-gains tax (a 1031 exchange can defer both). Figures are a year-1 estimate at your 24.0% rate — not tax advice; consult a CPA.
Schools (NCES district)
- District
- Broward
- NCES district ID
- 1200180
- Math proficiency
- 42% ▼ -18.00%
- Reading proficiency
- 53% ▼ -5.00%
- Median HH income
- $52,139
- Composite
- 40.88/100
- National rank
- #3621
- State rank
- #46 of 73 in FL
Livability — Pompano Beach
- Score
- 74/100
- State rank
- #284
- US rank
- #4541
Category grades
Schools grade is shown separately in the Schools card above.
Census & demographics
- Census place
- Pompano Beach, FL
- County
- Broward County · 1,963,430 people
- City population
- 155,861
- Metro
- Miami-Fort Lauderdale-Pompano Beach, FL
- Population (ZIP)
- 29,145
- Household income
- $59,683
- Rent vs Own
- Severe rent burden
- 1670.0
Population outlook (Broward County) Hauer SSP2
- Today (2025)
- 2,207,033 people
- By 2030
- 2,360,704 · +7.0%
- By 2040
- 2,661,208 · +20.6%
- By 2050
- 2,946,698 · +33.5%
- By 2075
- 3,602,273 · +63.2%
- By 2100
- 3,970,984 · +79.9%
Race, ethnicity, and origin ACS 2023
- Neighborhood character
- Highly diverse neighborhood (Simpson 0.72)
- Race & ethnicity
- Black 33% White 32% Hispanic / Latino 26% Two or more races 21% Asian 3%
- Hispanic origin (detail)
- Mexican 5% Puerto Rican 3% Cuban 3% Dominican 2%
- Common ancestry
- Hispanic 9% Estonian 2% Romanian 2%
- Foreign-born
- 33% · Canada, Jamaica
- Languages at home
- 61% English-only · Spanish 23% French/Haitian/Cajun 9% Other Indo-European 5%
Political lean MEDSL · Broward
- 2024 margin
- D (+17.0) · D 58.0% · R 41.0%
- 2008→2024 swing
- -17.8pp toward R · 2008: 34.7pp · 2024: 17.0pp
- All cycles
- 2024: D+17.0 2020: D+29.8 2016: D+35.0 2012: D+34.9 2008: D+34.7
Not yet ingested
- Civics
- —
Market trends
- HPI YoY
- ▼ -3.16%
- Current HPI
- 297.1774
- Rent YoY
- ▼ -0.29%
- Metro
- Miami-Fort Lauderdale-Pompano Beach, FL
- State GDP YoY
- ▲ 3.28%
- F500 in state
- 36
Industry mix (Fortune 500 HQ in FL)
| Industry | F500 HQs | Revenue |
|---|---|---|
| Industrial Technology | 2 | $29B |
|
||
| Insurance | 2 | $17B |
|
||
| Retail | 1 | $60B |
|
||
| Technology Distribution | 1 | $58B |
|
||
| Homebuilding | 1 | $35B |
|
||
| Technology Manufacturing | 1 | $35B |
|
||
Price history
+385.8% since first listed5 events — show timeline
- 2025-06-17 Sold (Public Records) $120,000 Public Records
- 2025-04-30 Listing Removed — Beaches MLS
- 2025-03-06 Listed $129,000 Beaches MLS
- 2003-07-30 Sold (Public Records) $86,000 Public Records
- 1976-03-01 Sold (Public Records) $24,700 Public Records
Property tax history
+8.8%/yrLatest (2025): $3,202 · +4.4% YoY. Source: county tax records.
Cash-flow waterfall
monthlySold comps — $/sqft
last 12 mo · ≤1 miLoading sold comps…