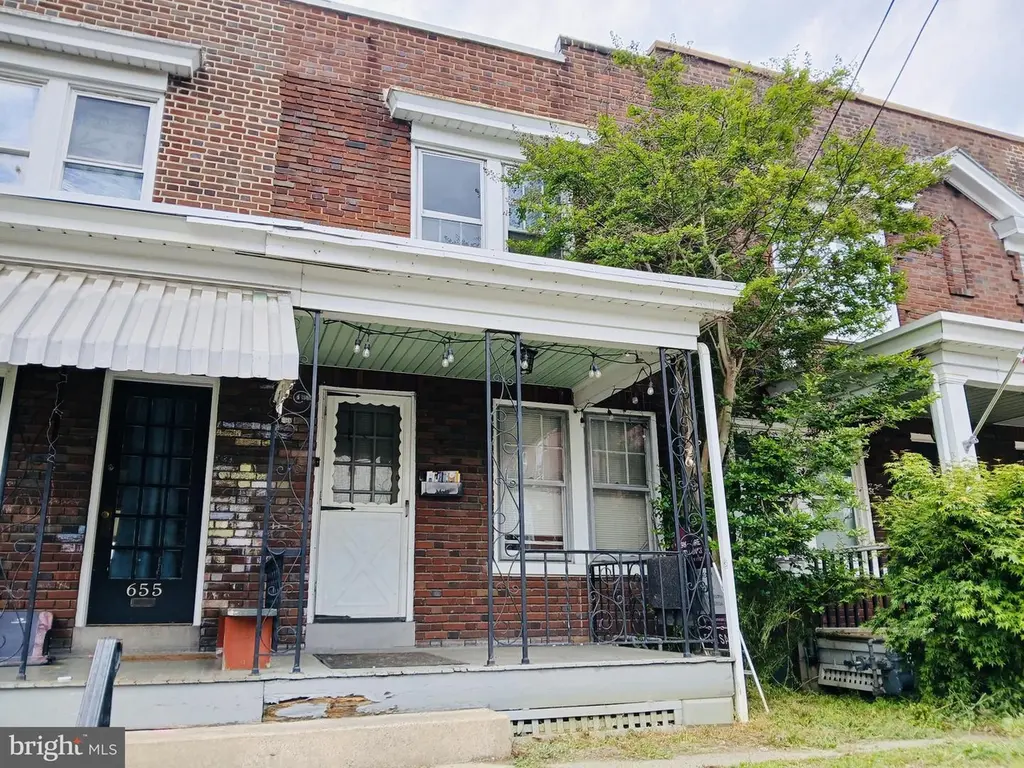
657 Lehigh Ave · Lancaster, PA
Flood risk 1/10 · Minimal
- FEMA flood zone
- X (unshaded)
- Chance of flooding over 30 yrs
- 0.0%
- Est. flood insurance / yr
- $473 – $860
Fire risk 1/10 · Minimal
- Est. fire insurance / yr
- $511 – $949
Heat risk 6/10 · Moderate
- Hot days now (above 101°F)
- 7 days/yr
- Hot days in 30 yrs
- 15 days/yr
Wind risk 4/10 · Minor
- Chance of severe wind over 30 yrs
- 14.0%
Air-quality risk 4/10 · Minor
- Unhealthy air days now
- 4 days/yr
- Unhealthy air days in 30 yrs
- 7 days/yr
Risk factors via First Street. Map © Google.
Why this score? — see what drove the C- grade
The composite is a weighted blend of 9 inputs, each scored 0–100. Each bar is that input's sub-score; the figure is the points it added to the 100-point composite (weight × sub-score).
- Cash flow +18.2/30.0
- ARV discount +15.0/15.0
- DSCR +5.7/10.0
- 1% rule +4.9/10.0
- Livability +4.2/5.0
- Rent growth +2.8/5.0
- Condition / age +2.5/5.0
- Schools +1.6/10.0
- Appreciation +0.0/10.0
$159,000
🖨 Deal sheet 📄 Offer letter ✓ Due diligence
Listing remarks
Investment opportunity in fantastic Lancaster location. Open living room and kitchen area, two bedrooms, one full bathroom, large basement with walkout. Back patio and fenced in yard. Gas heat. Original banister and wood trim. Walkable to Lancaster Brewing Company, JP McCaskey High School, and Reservoir Park. Minutes from route 30 and 222.
Key facts
- Fenced in yard
- Back patio
- Built 1923
Tags
Property features AI
Finance
- HOA & community: Ground rent paid annually
Exterior
- Parking: On-street parking
- Utilities: Public water; Public sewer; Natural gas; Electric hot water
- Home design: Interior townhouse/rowhouse
- Construction: Brick/masonry construction; Block foundation; Built-up and shingle roof; Built in (assessor) year
- Exterior features: Patio(s); Porch(es)
Interior
- Kitchen: Eat-in kitchen
- Bedrooms: Two bedrooms on the first upper level
- Bathrooms: One full bathroom
- Heating & cooling: Hot water baseboard heating; Natural gas heating; Electric hot water
- Interior features: Eat-in kitchen; Partial basement with walkout stairs
- Laundry & utility: Laundry in basement
Neighborhood map
What this means for you Summary
Snapshot
- This is a 2-bed/1.0-bath townhouse listed at $159k.
Deal economics
- At list price, monthly cash flow is $142 ($2k/yr) — positive.
- The deal already cash-flows at list — no discount required.
- To meet the 1% rule (rent ≥ 1% of price), the offer needs to be $157k (1.3% below list).
- Recommended offer: $157k (1.3% below list) — sets the bar for 1% rule.
- Cap rate 7.4% vs local median 4.2% in Lancaster — top-decile yield for the area; either an underpriced asset or a hidden risk that comps aren't pricing in. Stress-test before assuming the spread holds.
Location & tenants
- Location reads 85/100 on livability (#71 in PA, #498 nationally) — a professional / high-income tenant draw. Strengths: amenities A+, commute A+, cost of living A+; Watch: crime C-, employment C-.
- Lancaster SD (urban): math 12% / reading 25% proficiency, ranked #500 of 539 in PA (top 93%) — low school quality limits family demand, transient renter base, plan for 1-2y turnover; 72% free/reduced lunch — lower-income household profile, screen leases tightly.
- Zoned schools: Mccaskey Campus (math 50% / reading 34%, grade F, #230 of 437 statewide, top 53%, 2,620 students, 88% FRL) — zoned schools average 88% FRL vs 72% district-wide (16 pts higher); higher-poverty schools than district average — tighter screening recommended.
- Zoned-school proficiency averages 42% at this address vs 18% district-wide (+24 pts) — the actual schools serving this property are materially stronger than the Lancaster SD average implies; a family-tenant draw the district grade alone would hide.
- Market conditions: Rents rising (+1.2%/yr); 161 active listings in the ZIP; 40 comparable units currently listed for rent nearby; rentals at typical pace (median 21d on market — plan ~3-4 weeks tenant-placement turnaround); solid renter incomes; 1,093 units permitted in Lancaster County in 2024 (201 in 5+ unit buildings).
Forward outlook
- Local home prices are declining (-3.0%/yr); year-one equity from $1k of loan paydown is wiped out by about $5k of value loss. Plan a longer hold.
- Lancaster County population projected at +5% by 2050 — modest demand growth; plan on rents tracking national, not racing it.
Negotiation context
- Only 5 days on market — expect competitive offers; lowballing is unlikely to land.
Risks & watch-outs
- Watch-outs: built in 1923 — expect roof / HVAC / electrical / plumbing capex.
- Climate carrying-cost: extreme-heat days projected 7→15/yr by 2055 (HVAC capex compounding) — expect insurance premiums to compound above CPI over the hold.
Questions for the listing agent
- Built in 1923 — when were the roof, HVAC, electrical panel, plumbing, and water heater last replaced?
- Is there a deadline driving the sale (1031 exchange, divorce, estate, relocation)? That informs how much negotiation room exists.
- What's the average days-on-market for RENTAL listings here right now (not sales)? A rising rental-DOM trend means longer vacancies and softer asking-rent achievability than the comps imply.
- What's the recent tenant-quality profile in this submarket — average credit score on applications, eviction rate, late-payment / NSF rate, and stable-employment percentage? A property-management company in the area should have these aggregated.
- How much new for-sale + rental construction is in the pipeline within 1–3 miles? Heavy new supply typically softens prices + rents 12–24 months out; constrained supply supports both.
Investment metrics
- 1% rule
- 0.99% ✗
- Cap rate
- 7.36%
- Cash-on-cash
- 3.83%
- DSCR
- 1.17
- GRM
- 8.4
CMA / ARV
- ARV (median comp)
- $196,500
- List price
- $159,000
- Delta
- -19.08%
- Verdict
- UNDERPRICED
- Comps
- 20 within 1.0 mi
Show comp detail 12 sales within ~0.75 mi
| Address | Dist | Beds/Ba | Sqft | Sold | Price | $/sf | Match |
|---|---|---|---|---|---|---|---|
| 657 Lehigh Ave | 0.00mi | 2/1.0 | 784 (0%) | 0mo | $160,000 | $204 | 100 |
| 659 Lehigh Ave | 0.00mi | 2/1.0 | 784 (0%) | 4mo | $198,000 | $253 | 97 |
| 661 Lehigh Ave | 0.01mi | 2/1.0 | 784 (0%) | 4mo | $195,000 | $249 | 96 |
| 638 Lehigh Ave | 0.04mi | 2/2.0 | 784 (0%) | 16mo | $215,000 | $274 | 81 |
| 587 Zook Ave | 0.35mi | 2/1.0 | 798 (+2%) | 3mo | $217,000 | $272 | 78 |
| 305 N Marshall St | 0.12mi | 2/1.0 | 720 (-8%) | 7mo | $99,500 | $138 | 75 |
| 632 New Holland Ave | 0.22mi | 2/1.0 | 840 (+7%) | 13mo | $226,000 | $269 | 67 |
| 549 Hamilton St | 0.28mi | 2/1.0 | 840 (+7%) | 22mo | $217,500 | $259 | 56 |
| 977 Clark St | 0.54mi | 2/1.5 | 879 (+12%) | 8mo | $210,000 | $239 | 46 |
| 227 E Madison St | 0.48mi | 3/1.0 (+1) | 864 (+10%) | 15mo | $175,000 | $203 | 43 |
| 238 E Liberty St | 0.72mi | 2/1.0 | 840 (+7%) | 20mo | $252,000 | $300 | 38 |
| 219 E Madison St | 0.49mi | 2/1.5 | 900 (+15%) | 23mo | $231,700 | $257 | 32 |
Match score weights: distance 35% · size 25% · config 20% · recency 20%. Top-matched comps best support the ARV.
Projected returns pro-forma
-3.0% appreciation · 1.2% rent growth · sell at horizon
- IRR
- -12.3%
- Equity multiple
- 0.56×
- Total profit
- $-19,489
- Equity at exit
- $23,707
- IRR
- -6.2%
- Equity multiple
- 0.63×
- Total profit
- $-16,281
- Equity at exit
- $13,747
Cash invested: $44,520 (down + closing). Projections, not guarantees.
Landlord ↔ Tenant lean methodology
- Overall (STATE)
- 62 Landlord-Friendly
- State Pennsylvania
- 62 Landlord-Friendly · EVEN
- County
- — inherits STATE
- City
- — inherits STATE
ZIP-level market 17602
- Rents YoY
- 1.2%
- Active inventory
- 161
- Price-to-rent
- 8.4×
Monthly cashflow live
- Estimated rent
- $1,570 high interval (Pro) →
- Mortgage (P&I)
- −$834
- Tax from tax record
- −$198 /mo · $2,376/yr
- Insurance
- −$66
- HOA
- −$0
- Vacancy / Maint / Mgmt
- −$330
- Net cashflow
- $142
Break-even live
UW: 25.0% down · 7.5% · 30yr · 1.5% tax · 5.0% vac · 8.0% maint · 8.0% mgmt
Financing live
Cash to close
- Down payment
- $39,750
- Closing costs
- $4,770
- Reserves months
- —
- Total cash needed
- —
Loan-product check · same deal, 3 products live
Conventional
25% down · 7.5% · 30yr
- Down + closing
- —
- Monthly P&I
- —
- Monthly cashflow
- —
- DSCR
- —
- Eligible?
- —
Personal DTI + credit; lowest rate.
DSCR
20% down · 8.5% · 30yr
- Down + closing
- —
- Monthly P&I
- —
- Monthly cashflow
- —
- DSCR
- —
- Eligible?
- —
No personal income docs; deal must DSCR.
Hard money
10% down · 12.0% · 12mo
- Down + closing
- —
- Monthly P&I
- —
- Monthly cashflow
- —
- DSCR
- —
- Eligible?
- —
Short-term bridge; refi at stabilization.
Rent comps 40 comps
| Address | Beds | Baths | Sqft | Rent | $/sqft | DOM | Units | Dist |
|---|---|---|---|---|---|---|---|---|
| 605 Lehigh Ave Lancaster, PA | 2.0 | 1.0 | 784 | $1,395 | $1.78 | 43d | 1 | 0.07mi |
| 738 E Madison St Lancaster, PA | 3.0 | 1.0 | 1102 | $1,750 | $1.59 | 43d | 1 | 0.13mi |
| 442 E King St Lancaster, PA | 1.0 | 1.0 | 600 | $925 | $1.54 | 23d | 1 | 0.50mi |
| 701 Martha Ave Lancaster, PA | 2.0 | 1.0–2.0 | 1096 | $2,600 | $2.37 | 13d | 1 | 0.56mi |
| 114 E Lemon St Lancaster, PA | 1.0 | 1.0 | 627 | $1,347 | $2.15 | 13d | 2 | 0.61mi |
| 225 E King St Unit 1 Lancaster, PA | 2.0 | 1.0 | 957 | $1,950 | $2.04 | 13d | 1 | 0.64mi |
| 225 E King St Unit 2 Lancaster, PA | 2.0 | 2.5 | 1075 | $2,600 | $2.42 | 43d | 1 | 0.64mi |
| 61 Howard Ave Apt 1 Lancaster, PA | 2.0 | 1.0 | 650 | $1,045 | $1.61 | 43d | 1 | 0.65mi |
| 446 N Duke St Unit 1R Lancaster, PA | 1.0 | 1.0 | 580 | $1,095 | $1.89 | 43d | 1 | 0.66mi |
| 72 Howard Ave Lancaster, PA | 2.0 | 1.0 | 572 | $1,495 | $2.61 | 21d | 1 | 0.67mi |
| 38 E Walnut St Lancaster, PA | 1.0 | 1.0 | 587 | $1,495 | $2.55 | 23d | 1 | 0.68mi |
| 709 N Duke St Lancaster, PA | 1.0 | 1.0 | 588 | $1,550 | $2.64 | 21d | 1 | 0.70mi |
| 721 N Duke St Unit 1 Lancaster, PA | 1.0 | 1.0 | 850 | $1,295 | $1.52 | 13d | 1 | 0.71mi |
| 135 E Ross St Unit 2nd Floor Lancaster, PA | 2.0 | 1.0 | 1000 | $1,575 | $1.57 | 13d | 1 | 0.73mi |
| 347 N Queen St Lancaster, PA | 1.0 | 1.0 | 687 | $2,025 | $2.95 | 13d | 10 | 0.73mi |
| 767 Clermont Ave Lancaster, PA | 2.0 | 1.0 | 850 | $1,395 | $1.64 | 13d | 1 | 0.77mi |
| 506 N Queen St Unit 2 Lancaster, PA | 1.0 | 1.0 | 556 | $1,500 | $2.70 | 13d | 1 | 0.77mi |
| 202 N Queen St Lancaster, PA | 2.0 | 1.0–2.0 | 697 | $2,718 | $3.90 | 13d | 12 | 0.79mi |
| 145 Chester St Fl REAR Lancaster, PA | 1.0 | 1.0 | 800 | $1,125 | $1.41 | 13d | 1 | 0.79mi |
| 227 N Prince St Lancaster, PA | 1.0 | 1.0 | 483 | $1,575 | $3.26 | 13d | 4 | 0.86mi |
| 118 N Prince St Lancaster, PA | 1.0–3.0 | 1.0–3.0 | 1274 | $3,199 | $2.51 | 13d | 48 | 0.92mi |
| 323 N Mulberry St Unit 4 Lancaster, PA | 1.0 | 1.0 | 600 | $1,500 | $2.50 | 13d | 1 | 0.99mi |
| 816 N Prince St Lancaster, PA | 1.0–2.0 | 1.0–2.0 | 794 | $2,195 | $2.76 | 13d | 7 | 1.01mi |
| 344 N Mulberry St Unit 2 Lancaster, PA | 1.0 | 1.0 | 722 | $1,065 | $1.48 | 23d | 1 | 1.01mi |
| 35 N Mulberry St Unit 1st floor Lancaster, PA | 1.0 | 1.0 | 700 | $1,085 | $1.55 | 43d | 1 | 1.06mi |
| 1000 Strand WAY Neffsville, PA | 1.0–2.0 | 1.0–2.0 | 1033 | $2,850 | $2.76 | 13d | 15 | 1.12mi |
| 34 Conestoga St Unit 1 Lancaster, PA | 2.0 | 1.0 | 671 | $995 | $1.48 | 21d | 1 | 1.14mi |
| 50 Knollwood Dr Lancaster, PA | 2.0 | 1.5 | 1067 | $1,925 | $1.80 | 13d | 3 | 1.14mi |
| 433 W Walnut St Apt 2 Lancaster, PA | 2.0 | 1.0 | 900 | $1,840 | $2.04 | 23d | 1 | 1.18mi |
| 431 Fremont St Unit 4 Lancaster, PA | 1.0 | 1.0 | 641 | $1,095 | $1.71 | 43d | 1 | 1.19mi |
| 445 W Lemon St Unit 4 Lancaster, PA | 1.0 | 1.5 | 540 | $1,445 | $2.68 | 23d | 1 | 1.20mi |
| 404 Beaver St Lancaster, PA | 3.0 | 1.0 | 1025 | $1,425 | $1.39 | 23d | 1 | 1.22mi |
| 5000 Foundry Dr Lancaster, PA | 1.0–2.0 | 1.0–2.0 | 970 | $2,575 | $2.65 | 13d | 10 | 1.24mi |
| 437 W Grant St Lancaster, PA | 1.0 | 1.0 | 713 | $1,795 | $2.52 | 23d | 1 | 1.25mi |
| 437 W Grant St Unit 302 Lancaster, PA | 1.0 | 1.0 | 650 | $1,775 | $2.73 | 23d | 1 | 1.25mi |
| 1405 Oregon Pike Apt A Lancaster, PA | 2.0 | 1.0 | 1000 | $1,295 | $1.29 | 43d | 1 | 1.25mi |
| 475 Saint Joseph St Lancaster, PA | 1.0 | 1.0 | 750 | $1,000 | $1.33 | 13d | 1 | 1.28mi |
| 37 E Filbert St Lancaster, PA | 3.0 | 1.0 | 1002 | $1,750 | $1.75 | 43d | 1 | 1.30mi |
| 519 1/2 S Prince St Lancaster, PA | 2.0 | 1.0 | 848 | $1,550 | $1.83 | 13d | 1 | 1.35mi |
| 422 Hillside Ave Lancaster, PA | 2.0 | 1.0 | 960 | $1,245 | $1.30 | 43d | 1 | 1.38mi |
Listing history 2 events
-
2026-05-18status Pending 341-char remark
-
2026-05-13$159,000 Active 341-char remark
ⓘ Source: listings_history table (triggers on properties + properties_extension) + one-shot
backfill from property_details.listing_events for pre-trigger history.
Tax reassessment forecast PA · Partial reset (capped growth)
- Current annual tax
- $2,376 · $198/mo
- Projected year-2 tax
- $2,444 · $204/mo
- Expected delta
- +$68/yr (+$6/mo · 2.9%)
ⓘ Screening estimate from a state-policy table — verify with the county assessor before closing.
Climate risk First Street
- Flood 1/10 Low FEMA zone X (unshaded) · 0% chance over 30 yrs
- Wildfire 1/10 Low
- Heat 6/10 Major 7 d/yr ≥101°F today · 15 d/yr by 30 yrs out
- Wind 4/10 Moderate 14% chance of damaging wind over 30 yrs
- Air quality 4/10 Moderate 4 unhealthy d/yr today · 7 by 30 yrs out
Nearby sold comps map
Loading sold comps map…
Walkable amenities ~0.75 mi
Loading nearby amenities…
Taxation est. · year 1
- Rental income
- $18,837
- − Mortgage interest
- −$8,906
- − Property taxes
- −$2,376
- − Insurance
- −$795
- − Repairs & maintenance
- −$1,507
- − Management
- −$1,507
- − Depreciation
- −$4,625
- Taxable loss
- −$880
- Est. tax savings @ 24.0%
- +$211
- After-tax cash flow
- $1,916/yr
For passive investors: Depreciation is non-cash, so a rental often shows a tax loss while cash-flowing — sheltering income. Rental losses are passive: they offset passive income freely, and up to $25,000/yr can offset ordinary (W-2) income if you actively participate and your MAGI is under $100k (phasing out to $0 by $150k); unused losses carry forward. On sale, claimed depreciation is recaptured at up to 25%, and gains may owe capital-gains tax (a 1031 exchange can defer both). Figures are a year-1 estimate at your 24.0% rate — not tax advice; consult a CPA.
Schools (NCES district)
- District
- Lancaster SD
- NCES district ID
- 4213140
- Math proficiency
- 12% ▼ -10.00%
- Reading proficiency
- 25% ▼ -13.00%
- Median HH income
- $38,500
- Composite
- 15.52/100
- National rank
- #9301
- State rank
- #500 of 539 in PA
Livability — Lancaster
- Score
- 85/100
- State rank
- #71
- US rank
- #498
Category grades
Schools grade is shown separately in the Schools card above.
Census & demographics
- Census place
- Lancaster, PA
- County
- Lancaster County · 390,309 people
- City population
- 176,170
- Metro
- Lancaster, PA
- Population (ZIP)
- 52,217
- Household income
- $75,862
- Rent vs Own
- Severe rent burden
- 1556.0
Population outlook (Lancaster County) Hauer SSP2
- Today (2025)
- 561,011 people
- By 2030
- 570,969 · +1.8%
- By 2040
- 585,929 · +4.4%
- By 2050
- 591,056 · +5.4%
- By 2075
- 594,747 · +6.0%
- By 2100
- 558,850 · -0.4%
Race, ethnicity, and origin ACS 2023
- Neighborhood character
- Diverse neighborhood (Simpson 0.61)
- Race & ethnicity
- White 52% Hispanic / Latino 32% Two or more races 12% Black 11% Asian 2%
- Hispanic origin (detail)
- Mexican 2% Puerto Rican 21% Cuban 1% Dominican 4%
- Common ancestry
- Romanian 2% Italian 1% Lithuanian 1%
- Foreign-born
- 13% · Canada, Vietnam, South Korea
- Languages at home
- 70% English-only · Spanish 22% German/W. Germanic 2% French/Haitian/Cajun 1%
Political lean MEDSL · Lancaster
- 2024 margin
- R (+15.9) · D 41.5% · R 57.5%
- 2008→2024 swing
- -4.1pp toward R · 2008: -11.8pp · 2024: -15.9pp
- All cycles
- 2024: R+15.9 2020: R+15.8 2016: R+19.7 2012: R+19.2 2008: R+11.8
Not yet ingested
- Civics
- —
Market trends
- HPI YoY
- ▼ -248.05%
- Current HPI
- 288.9141
- Rent YoY
- ▲ 1.20%
- Metro
- Lancaster, PA
- State GDP YoY
- ▲ 1.68%
- F500 in state
- 34
Industry mix (Fortune 500 HQ in PA)
| Industry | F500 HQs | Revenue |
|---|---|---|
| Healthcare | 2 | $309B |
|
||
| Insurance | 2 | $27B |
|
||
| Telecommunications / Media | 1 | $124B |
|
||
| Industrial Distribution | 1 | $22B |
|
||
| Financial Services | 1 | $20B |
|
||
| Chemicals / Materials | 1 | $18B |
|
||
Price history
+0.6% since first listed3 events — show timeline
- 2026-06-17 Sold (MLS) $160,000 BRIGHT MLS
- 2026-05-18 Pending — BRIGHT MLS
- 2026-05-13 Listed $159,000 BRIGHT MLS
Property tax history
+0.2%/yrLatest (2026): $2,376 · +3.3% YoY. Source: county tax records.
Cash-flow waterfall
monthlySold comps — $/sqft
last 12 mo · ≤1 miLoading sold comps…