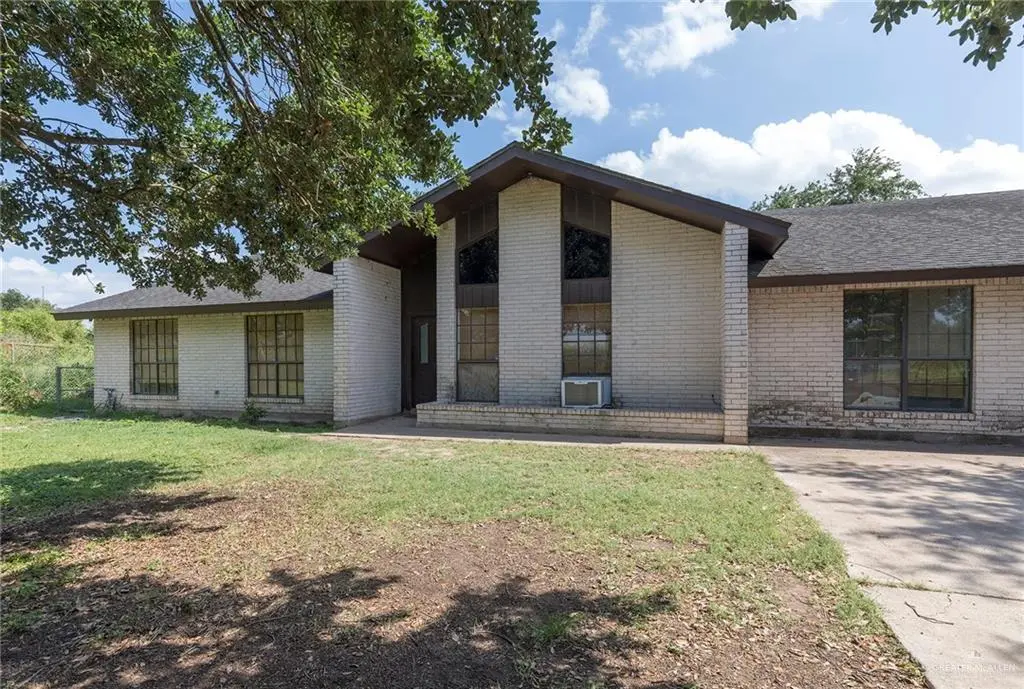
909 E Minnesota Rd · San Juan, TX
Flood risk 8/10 · Major
- FEMA flood zone
- AH
- Chance of flooding over 30 yrs
- 0.99%
- Est. flood insurance / yr
- $1,142 – $2,507
Fire risk 8/10 · Major
- Est. fire insurance / yr
- $1,222 – $2,270
Heat risk 8/10 · Major
- Hot days now (above 111°F)
- 6 days/yr
- Hot days in 30 yrs
- 18 days/yr
Wind risk 8/10 · Major
- Chance of severe wind over 30 yrs
- 99.0%
Air-quality risk 1/10 · Minimal
- Unhealthy air days now
- 0 days/yr
- Unhealthy air days in 30 yrs
- 0 days/yr
Risk factors via First Street. Map © Google.
Why this score? — see what drove the C grade
The composite is a weighted blend of 9 inputs, each scored 0–100. Each bar is that input's sub-score; the figure is the points it added to the 100-point composite (weight × sub-score).
- Cash flow +19.0/30.0
- ARV discount +15.0/15.0
- DSCR +6.0/10.0
- 1% rule +5.8/10.0
- Livability +3.6/5.0
- Rent growth +2.5/5.0
- Condition / age +2.5/5.0
- Schools +2.0/10.0
- Appreciation +0.0/10.0
$199,000
🖨 Deal sheet (PDF) 📄 Offer letter ✓ Due diligence
Listing remarks
Opportunity awaits in Alamo! Situated on a spacious . 44-acre lot along Minnesota Road, this property offers plenty of potential for buyers looking to renovate, invest or create their ideal home. Featuring 4 bedrooms, 2 bathrooms and over 2,100 living square feet, the layout provides generous space for everyday living and entertaining. This is a great handyman special to be turned around and made into whatever you visualize! The potential is endless with so much potential! The home includes a large main living area, mature shade trees, a roomy backyard, and a side-entry 2-car garage. Its prime location places you just minutes from schools, restaurants, shopping centers, and quick expressw
Key facts
- 0.44 acre lot
- 2 garage spots
- Built 1984
Property features AI
Finance
- Other: Lot roughly 0.44 acres (approx. 19,166 sq ft)
- HOA & community: No homeowners association
Exterior
- Parking: Attached 2-car garage with garage door opener (garage faces side); 2 covered parking spaces
- Security: Manual gate
- Utilities: Public water; Septic tank sewer; Electric service
- Home design: Not new construction
- Construction: Brick construction; Shingle roof; Slab foundation; Building area approximately 2,116
- Exterior features: Covered patio and patio slab; Manual gate; Mature trees; Chain link fencing; Allows horses; Storage structure on property; Paved road access; Curbs
Interior
- Kitchen: Dishwasher; Stove/Range
- Bedrooms: Master bedroom with walk-in closet
- Flooring: Painted or stained floors
- Bathrooms: 2 full bathrooms
- Heating & cooling: Central heating (electric); Central air conditioning (electric)
- Interior features: Laminate countertops; Painted or stained flooring; Double-pane (energy efficient) windows; Drapes and mini blinds; Attic fans
- Laundry & utility: Laundry room with washer/dryer connections; Electric water heater located in garage
Neighborhood map
What this means for you Summary
Snapshot
- This is a 4-bed/3.0-bath single-family listed at $199k.
Deal economics
- At list price, monthly cash flow is $55 ($661/yr) — positive.
- The deal already cash-flows at list — no discount required.
- Meets the 1% rule at list price ($2k rent vs $199k).
- Recommended offer: $196k (1.5% below list) — sets the bar for market timing.
- Cap rate 7.5% vs local median 3.4% in San Juan — top-decile yield for the area; either an underpriced asset or a hidden risk that comps aren't pricing in. Stress-test before assuming the spread holds.
Location & tenants
- Location reads 71/100 on livability (#294 in TX) — a middle-class / working-renter tenant base. Strengths: cost of living A+, housing A+, health & safety A+; Watch: amenities F, commute F, employment D-.
- Pharr-San Juan-Alamo ISD (suburban): math 18% / reading 30% proficiency, ranked #740 of 826 in TX (top 90%) — low school quality limits family demand, transient renter base, plan for 1-2y turnover; 72% free/reduced lunch — lower-income household profile, screen leases tightly.
- Zoned schools: Augusto Guerra El (math 17% / reading 22%, grade F, #3,583 of 4,322 statewide, top 86%, 675 students, 96% FRL); Audie Murphy Middle (math 13% / reading 22%, grade F, #1,507 of 1,662 statewide, top 91%, 787 students, 95% FRL); Psja Memorial Early College H S (math 20% / reading 31%, grade F, #1,246 of 1,632 statewide, top 77%, 1,860 students, 94% FRL) — zoned schools average 95% FRL vs 72% district-wide (24 pts higher); higher-poverty schools than district average — tighter screening recommended.
- Market conditions: 362 active listings in the ZIP; 3 comparable units currently listed for rent nearby; rentals at typical pace (median 16d on market — plan ~3-4 weeks tenant-placement turnaround); 7,378 units permitted in Hidalgo County in 2024 (641 in 5+ unit buildings).
Forward outlook
- Local home prices are declining (-3.0%/yr); year-one equity from $1k of loan paydown is wiped out by about $6k of value loss. Plan a longer hold.
- Hidalgo County population projected at +28% by 2050 — long-run rental-demand tailwind backs the buy-and-hold thesis.
Negotiation context
- It's been on market 23 days — a 2% lower offer ($196k) is reasonable based on typical stale-listing flexibility.
- 3 sale attempts; this cycle's ask is 5% above the opening price — seller raised mid-cycle; expect resistance to lowballs.
Risks & watch-outs
- Watch-outs: flood insurance adds $152/mo.
- Climate carrying-cost: in FEMA flood zone AH (mandatory federal flood insurance); severe wind risk, 99% chance of damaging wind over 30y; severe wildfire risk; extreme-heat days projected 6→18/yr by 2055 (HVAC capex compounding) — expect insurance premiums to compound above CPI over the hold.
Questions for the listing agent
- What's the actual annual flood-insurance premium (NFIP or private), and is the property in a SFHA with mandatory coverage?
- Is there a deadline driving the sale (1031 exchange, divorce, estate, relocation)? That informs how much negotiation room exists.
- Schools are D-rated, which usually means shorter tenancies and higher turnover. Who's the typical renter profile here, and what's been the actual vacancy rate?
- What's the average days-on-market for RENTAL listings here right now (not sales)? A rising rental-DOM trend means longer vacancies and softer asking-rent achievability than the comps imply.
- What's the recent tenant-quality profile in this submarket — average credit score on applications, eviction rate, late-payment / NSF rate, and stable-employment percentage? A property-management company in the area should have these aggregated.
- How much new for-sale + rental construction is in the pipeline within 1–3 miles? Heavy new supply typically softens prices + rents 12–24 months out; constrained supply supports both.
Investment metrics
- 1% rule
- 1.08% ✓
- Cap rate
- 7.54%
- Cash-on-cash
- 4.46%
- DSCR
- 1.20
- GRM
- 7.7
CMA / ARV
- ARV (median comp)
- $295,521
- List price
- $199,000
- Delta
- -32.36%
- Verdict
- UNDERPRICED
- Comps
- 20 within 1.0 mi
Show comp detail 7 sales within ~0.75 mi
| Address | Dist | Beds/Ba | Sqft | Sold | Price | $/sf | Match |
|---|---|---|---|---|---|---|---|
| 3900 Wolverine Rd | 0.50mi | 4/3.0 | 2,112 (-0%) | 17mo | $350,000 | $166 | 62 |
| 4503 Jenica Cir W | 0.66mi | 4/2.5 | 2,207 (+4%) | 2mo | $249,000 | $113 | 59 |
| 1112 Brenda Ln | 0.21mi | 4/3.0 | 2,365 (+12%) | 14mo | $315,000 | $133 | 58 |
| 5002 Sebastian Dr | 0.34mi | 4/2.5 | 1,886 (-11%) | 13mo | $298,000 | $158 | 53 |
| 3501 Grandora St | 0.55mi | 4/2.0 | 1,897 (-10%) | 1mo | $229,900 | $121 | 52 |
| 3802 San Gabriel St | 0.39mi | 3/2.0 (-1) | 1,931 (-9%) | 14mo | $300,000 | $155 | 47 |
| 5305 Oleander Dr | 0.54mi | 4/3.0 | 1,909 (-10%) | 16mo | $220,000 | $115 | 46 |
Match score weights: distance 35% · size 25% · config 20% · recency 20%. Top-matched comps best support the ARV.
Projected returns pro-forma
-3.0% appreciation · 3.0% rent growth · sell at horizon
- IRR
- -14.3%
- Equity multiple
- 0.49×
- Total profit
- $-28,543
- Equity at exit
- $29,672
- IRR
- -5.4%
- Equity multiple
- 0.65×
- Total profit
- $-19,551
- Equity at exit
- $17,206
Cash invested: $55,720 (down + closing). Projections, not guarantees.
Landlord ↔ Tenant lean methodology
- Overall (STATE)
- 87 Strongly Landlord-Friendly
- State Texas
- 87 Strongly Landlord-Friendly · R+5
- County
- — inherits STATE
- City
- — inherits STATE
ZIP-level market 78589
- Home prices YoY
- -12.1%
- Active inventory
- 362
- Price-to-rent
- 7.7×
Monthly cashflow live
- Estimated rent
- $2,141 medium interval (Pro) →
- Mortgage (P&I)
- −$1,044
- Tax from tax record
- −$358 /mo · $4,295/yr
- Insurance
- −$83
- Flood insurance flood zone
- −$152 /mo · $1,824/yr
- HOA
- −$0
- Vacancy / Maint / Mgmt
- −$450
- Net cashflow
- $55
Break-even live
Sensitivity live
| Price | -10% $168 | -5% $111 | +0% $55 | +5% $-1 | +10% $-58 |
|---|---|---|---|---|---|
| Rent | -10% $-114 | -5% $-29 | +0% $55 | +5% $140 | +10% $224 |
| Rate | -1.0pp $155 | -0.5pp $106 | base $55 | +0.5pp $4 | +1.0pp $-49 |
UW: 25.0% down · 7.5% · 30yr · 1.5% tax · 5.0% vac · 8.0% maint · 8.0% mgmt
Financing live
Cash to close
- Down payment
- $49,750
- Closing costs
- $5,970
- Reserves months
- —
- Total cash needed
- —
Loan-product check · same deal, 3 products live
Conventional
25% down · 7.5% · 30yr
- Down + closing
- —
- Monthly P&I
- —
- Monthly cashflow
- —
- DSCR
- —
- Eligible?
- —
Personal DTI + credit; lowest rate.
DSCR
20% down · 8.5% · 30yr
- Down + closing
- —
- Monthly P&I
- —
- Monthly cashflow
- —
- DSCR
- —
- Eligible?
- —
No personal income docs; deal must DSCR.
Hard money
10% down · 12.0% · 12mo
- Down + closing
- —
- Monthly P&I
- —
- Monthly cashflow
- —
- DSCR
- —
- Eligible?
- —
Short-term bridge; refi at stabilization.
Rent comps 3 comps
| Address | Beds | Baths | Sqft | Rent | $/sqft | DOM | Units | Dist |
|---|---|---|---|---|---|---|---|---|
| 2716 E Conroe Rd Edinburg, TX | 3.0 | 2.5 | 1623 | $2,300 | $1.42 | 15d | 1 | 1.40mi |
| 1126 Grandeur Dr Alamo, TX | 3.0 | 2.0 | 1482 | $1,800 | $1.21 | 15d | 1 | 1.46mi |
| 2700 E Comal RD Edinburg, TX | 3.0 | 2.0 | 1511 | $2,300 | $1.52 | 15d | 1 | 1.48mi |
Listing history 20 events
-
2026-06-18days on market $199,000 Active 23 DOM
-
2026-06-17days on market $199,000 Active 22 DOM
-
2026-06-16days on market $199,000 Active 21 DOM
-
2026-06-15days on market $199,000 Active 20 DOM
-
2026-06-14days on market $199,000 Active 18 DOM
-
2026-06-13days on market $199,000 Active 17 DOM
-
2026-06-10days on market $199,000 Active 15 DOM
-
2026-06-09days on market $199,000 Active 14 DOM
-
2026-06-08days on market $199,000 Active 13 DOM
-
2026-06-07days on market $199,000 Active 12 DOM
-
2026-06-03days on market $199,000 Active 8 DOM
-
2026-06-02days on market $199,000 Active 7 DOM
-
2026-06-01days on market $199,000 Active 6 DOM
-
2026-05-31days on market $199,000 Active 5 DOM
-
2026-05-31days on market $199,000 Active 4 DOM
-
2026-05-11price $199,900
-
2026-05-08price $200,000
-
2026-05-04$239,900 Active
-
2021-05-28soldstatus
-
1994-10-12soldstatus
ⓘ Source: listings_history table (triggers on properties + properties_extension) + one-shot
backfill from property_details.listing_events for pre-trigger history.
Tax reassessment forecast TX · Resets to sale price
- Current annual tax
- $4,295 · $358/mo
- Projected year-2 tax
- $4,295 · $358/mo
- Expected delta
- $0/yr ($0/mo · 0.0%)
ⓘ Screening estimate from a state-policy table — verify with the county assessor before closing.
Climate risk First Street
- Flood 8/10 Severe FEMA zone AH · 99% chance over 30 yrs
- Wildfire 8/10 Severe
- Heat 8/10 Severe 6 d/yr ≥111°F today · 18 d/yr by 30 yrs out
- Wind 8/10 Severe 99% chance of damaging wind over 30 yrs
- Air quality 1/10 Low 0 unhealthy d/yr today · 0 by 30 yrs out
Nearby sold comps map
Loading sold comps map…
Walkable amenities ~0.75 mi
Loading nearby amenities…
Taxation est. · year 1
- Rental income
- $25,694
- − Mortgage interest
- −$11,147
- − Property taxes
- −$4,295
- − Insurance
- −$2,820
- − Repairs & maintenance
- −$2,056
- − Management
- −$2,056
- − Depreciation
- −$5,789
- Taxable loss
- −$2,467
- Est. tax savings @ 24.0%
- +$592
- After-tax cash flow
- $1,254/yr
For passive investors: Depreciation is non-cash, so a rental often shows a tax loss while cash-flowing — sheltering income. Rental losses are passive: they offset passive income freely, and up to $25,000/yr can offset ordinary (W-2) income if you actively participate and your MAGI is under $100k (phasing out to $0 by $150k); unused losses carry forward. On sale, claimed depreciation is recaptured at up to 25%, and gains may owe capital-gains tax (a 1031 exchange can defer both). Figures are a year-1 estimate at your 24.0% rate — not tax advice; consult a CPA.
Schools (NCES district)
- District
- Pharr-San Juan-Alamo ISD
- NCES district ID
- 4834860
- Math proficiency
- 18% ▼ -34.00%
- Reading proficiency
- 30% ▼ -11.00%
- Median HH income
- $33,757
- Composite
- 19.63/100
- National rank
- #8744
- State rank
- #740 of 826 in TX
Livability — San Juan
- Score
- 71/100
- State rank
- #294
- US rank
- #6725
Category grades
Schools grade is shown separately in the Schools card above.
Census & demographics
- Population (ZIP)
- 39,958
Population outlook (Hidalgo County) Hauer SSP2
- Today (2025)
- 955,232 people
- By 2030
- 1,009,774 · +5.7%
- By 2040
- 1,120,332 · +17.3%
- By 2050
- 1,225,036 · +28.2%
- By 2075
- 1,439,189 · +50.7%
- By 2100
- 1,533,429 · +60.5%
Race, ethnicity, and origin ACS 2023
- Neighborhood character
- Predominantly Hispanic (97%)
- Race & ethnicity
- Hispanic / Latino 97% Two or more races 43% White 3%
- Hispanic origin (detail)
- Mexican 94%
- Foreign-born
- 26% · Canada
- Languages at home
- 18% English-only · Spanish 82%
Political lean MEDSL · Hidalgo
- 2024 margin
- Toss-up / Even · D 48.1% · R 51.0%
- 2008→2024 swing
- -41.6pp toward R · 2008: 38.7pp · 2024: -2.9pp
- All cycles
- 2024: R+2.9 2020: D+17.1 2016: D+40.5 2012: D+41.8 2008: D+38.7
Not yet ingested
- Civics
- —
Market trends
- HPI YoY
- ▼ -32.82%
- Current HPI
- 239.3829
- Rent YoY
- —
- Metro
- —
- State GDP YoY
- ▲ 3.95%
- F500 in state
- 110
Industry mix (Fortune 500 HQ in TX)
| Industry | F500 HQs | Revenue |
|---|---|---|
| Energy | 16 | $1,198B |
|
||
| Technology | 5 | $198B |
|
||
| Engineering / Construction | 4 | $72B |
|
||
| Energy Services | 3 | $60B |
|
||
| Utilities | 3 | $41B |
|
||
| Healthcare | 2 | $330B |
|
||
Price history
-17.0% since first listed8 events — show timeline
- 2026-05-26 Relisted — MCALLENMLS
- 2026-05-26 Price Changed $199,000 MCALLENMLS
- 2026-05-24 Listed $190,000 MCALLENMLS
- 2026-05-11 Price Changed $199,900 MCALLENMLS
- 2026-05-08 Price Changed $200,000 MCALLENMLS
- 2026-05-04 Listed $239,900 MCALLENMLS
- 2021-05-28 Sold (Public Records) — Public Records
- 1994-10-12 Sold (Public Records) — Public Records
Property tax history
+5.9%/yrLatest (2025): $4,295 · +19.7% YoY. Source: county tax records.
Cash-flow waterfall
monthlySold comps — $/sqft
last 12 mo · ≤1 miLoading sold comps…