115 Cabana #115 · Napa, CA
Flood risk 1/10 · Minimal
- FEMA flood zone
- X (unshaded)
- Chance of flooding over 30 yrs
- 0.0%
- Est. flood insurance / yr
- $507 – $1,088
Fire risk 5/10 · Moderate
- Est. fire insurance / yr
- $659 – $1,223
Heat risk 5/10 · Moderate
- Hot days now (above 96°F)
- 7 days/yr
- Hot days in 30 yrs
- 14 days/yr
Wind risk 1/10 · Minimal
- Chance of severe wind over 30 yrs
- —
Air-quality risk 9/10 · Severe
- Unhealthy air days now
- 16 days/yr
- Unhealthy air days in 30 yrs
- 17 days/yr
Risk factors via First Street. Map © Google.
Why this score? — see what drove the C grade
The composite is a weighted blend of 9 inputs, each scored 0–100. Each bar is that input's sub-score; the figure is the points it added to the 100-point composite (weight × sub-score).
- Cash flow +26.1/30.0
- DSCR +8.8/10.0
- 1% rule +6.9/10.0
- Schools +4.0/10.0
- Condition / age +4.0/5.0
- Livability +3.5/5.0
- Rent growth +2.4/5.0
- ARV discount +0.0/15.0
- Appreciation +0.0/10.0
$299,999
🖨 Deal sheet 📄 Offer letter ✓ Due diligence
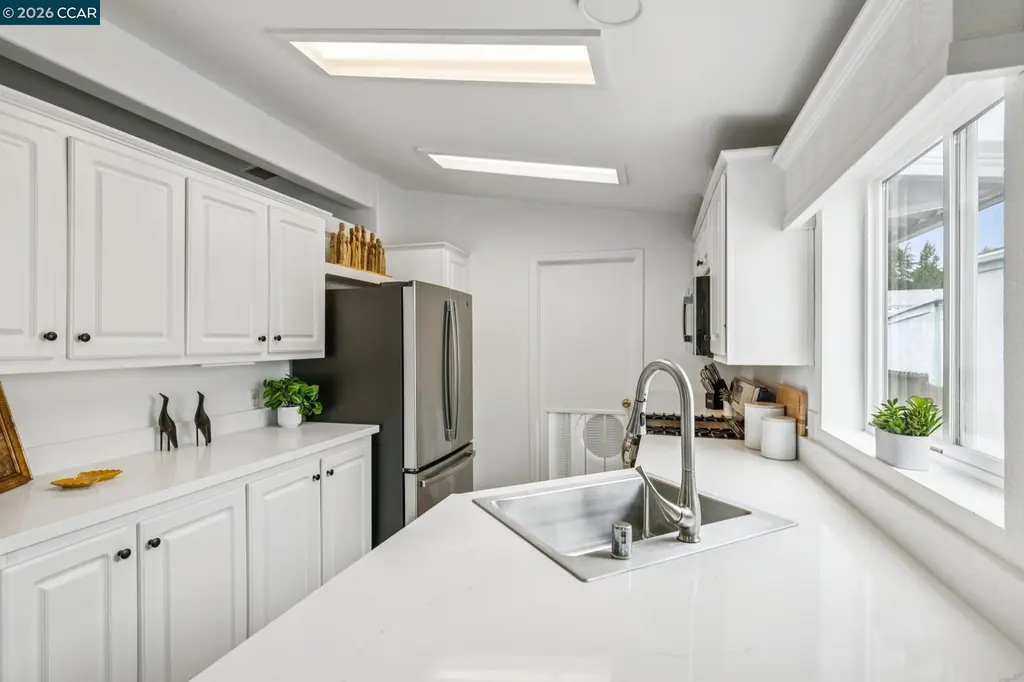
Listing remarks
Priced at $299,999.00—an attractive value after thoughtful price adjustments to connect with motivated buyers. Manufactured in 2000 and upgraded with over $90,000 in recent improvements, this move-in ready 3-bedroom, 2-bath home offers approximately 1,200 square feet of bright, open living space with high/vaulted ceilings and excellent flow. Both bathrooms have been fully remodeled, complemented by new quartz kitchen countertops, fresh interior and exterior paint, a new backyard fence with professional landscaping for privacy, and a new railing on the expansive front porch. Abundant natural light floods the home through north and west-facing windows, while the northwesterly-oriented p
Key facts
- Community pool
- Built 2000
- Listed 46 days
Property features AI
Finance
- HOA & community: Senior community; Community amenities include clubhouse, greenbelt, pool, spa, game room, guest parking and recreation facilities; Pet policy: contact community for details
Exterior
- Parking: Attached covered parking; Carport with room for 2 or more vehicles, side-by-side configuration
- Utilities: Public water; Public sewer; All-electric service
- Home design: Manufactured home located in a park; Double-wide mobile home (model KS48102P)
- Construction: Wood siding; Built as a manufactured/mobile home
- Exterior features: Fenced yard; Corner lot; Level lot with front yard; Close to clubhouse
Interior
- Kitchen: Dishwasher; Electric range / cooktop; Free-standing range; Microwave; Disposal; Refrigerator; Updated kitchen with solid surface counters and breakfast bar/nook
- Bedrooms: Total rooms indicate 7 (bedroom count not explicitly listed)
- Flooring: Vinyl flooring; Carpet
- Bathrooms: 2 total bathrooms; Both are full bathrooms; Primary bathroom with stall shower and updated finishes; Other bathroom(s) with shower over tub
- Heating & cooling: Central heating; Central air conditioning; Ceiling fans
- Interior features: Breakfast bar and breakfast nook; Solid surface counters; Updated kitchen; Window coverings; No additional rooms listed
- Laundry & utility: In-unit laundry room with washer and dryer; Laundry room includes cabinets and is inside the home; Electric water heater
Neighborhood map
What this means for you Summary
Snapshot
- This is a 3-bed/2.0-bath manufactured listed at $300k. Condition is rated good.
Deal economics
- At list price, monthly cash flow is $758 ($9k/yr) — positive.
- The deal already cash-flows at list — no discount required.
- Meets the 1% rule at list price ($4k rent vs $300k).
- Recommended offer: $291k (3.0% below list) — sets the bar for market timing.
- Cap rate 9.3% vs local median 2.0% in Napa — top-decile yield for the area; either an underpriced asset or a hidden risk that comps aren't pricing in. Stress-test before assuming the spread holds.
Location & tenants
- Location reads 70/100 on livability (#227 in CA) — a middle-class / working-renter tenant base. Strengths: employment A+, health & safety A+, amenities B+; Watch: commute F, cost of living F.
- Napa Valley Unified (urban): math 35% / reading 48% proficiency, ranked #599 of 1,400 in CA (top 43%) — families likely to look elsewhere, expect single-tenant / working-renter base with shorter leases.
- Market conditions: Rents soft (-0.5%/yr); 538 active listings in the ZIP; 2 comparable units currently listed for rent nearby; high-income renter base; 427 units permitted in Napa County in 2024 (189 in 5+ unit buildings).
- This rent runs 38% of the median local income ($113k/yr) — at the standard rent-burdened threshold; future hikes will face affordability resistance.
Forward outlook
- Local home prices are declining (-3.0%/yr); year-one equity from $2k of loan paydown is wiped out by about $9k of value loss. Plan a longer hold.
- Napa County population projected at +14% by 2050 — modest demand growth; plan on rents tracking national, not racing it.
Negotiation context
- It's been on market 46 days — a 3% lower offer ($291k) is reasonable based on typical stale-listing flexibility.
Risks & watch-outs
- Climate carrying-cost: moderate wildfire risk; extreme-heat days projected 7→14/yr by 2055 (HVAC capex compounding) — expect insurance premiums to compound above CPI over the hold.
Questions for the listing agent
- It's been on market 46 days. Have you received any prior offers? Is the seller open to a 3% concession, seller financing, or rate buy-down credit?
- Is there a deadline driving the sale (1031 exchange, divorce, estate, relocation)? That informs how much negotiation room exists.
- What's the average days-on-market for RENTAL listings here right now (not sales)? A rising rental-DOM trend means longer vacancies and softer asking-rent achievability than the comps imply.
- What's the recent tenant-quality profile in this submarket — average credit score on applications, eviction rate, late-payment / NSF rate, and stable-employment percentage? A property-management company in the area should have these aggregated.
- How much new for-sale + rental construction is in the pipeline within 1–3 miles? Heavy new supply typically softens prices + rents 12–24 months out; constrained supply supports both.
Investment metrics
- 1% rule
- 1.19% ✓
- Cap rate
- 9.32%
- Cash-on-cash
- 10.82%
- DSCR
- 1.48
- GRM
- 7.0
CMA / ARV
- ARV (median comp)
- $243,710
- List price
- $299,999
- Delta
- 23.10%
- Verdict
- OVERPRICED
- Comps
- 20 within 1.0 mi
Show comp detail 12 sales within ~0.75 mi
| Address | Dist | Beds/Ba | Sqft | Sold | Price | $/sf | Match |
|---|---|---|---|---|---|---|---|
| 212 Julie Pl | 0.40mi | 3/2.0 | 1,252 (+4%) | 3mo | $305,000 | $244 | 71 |
| 217 Bernadine Pl | 0.59mi | 3/2.0 | 1,200 (0%) | 8mo | $305,000 | $254 | 66 |
| 107 Mobile Ln | 0.31mi | 2/2.0 (-1) | 1,128 (-6%) | 7mo | $170,000 | $151 | 65 |
| 252 Clover Way | 0.42mi | 2/2.0 (-1) | 1,152 (-4%) | 8mo | $242,000 | $210 | 62 |
| 13 Hacienda Dr | 0.21mi | 2/2.0 (-1) | 1,368 (+14%) | 6mo | $255,000 | $186 | 57 |
| 206 Shirley Ct | 0.39mi | 2/2.0 (-1) | 1,064 (-11%) | 3mo | $249,000 | $234 | 56 |
| 317 Tammy Way | 0.54mi | 3/2.0 | 1,340 (+12%) | 1mo | $283,500 | $212 | 55 |
| 15 Camelia Dr | 0.49mi | 2/2.0 (-1) | 1,080 (-10%) | 3mo | $110,000 | $102 | 53 |
| 312 Stacey Way | 0.50mi | 2/2.0 (-1) | 1,083 (-10%) | 5mo | $230,000 | $212 | 51 |
| 315 Mark Way | 0.45mi | 2/2.0 (-1) | 1,344 (+12%) | 7mo | $225,000 | $167 | 48 |
| 312 Tammy Way | 0.56mi | 3/2.0 | 1,340 (+12%) | 9mo | $275,000 | $205 | 47 |
| 209 Bernadine Pl | 0.58mi | 2/2.0 (-1) | 1,344 (+12%) | 5mo | $389,000 | $289 | 44 |
Match score weights: distance 35% · size 25% · config 20% · recency 20%. Top-matched comps best support the ARV.
Projected returns pro-forma
-3.0% appreciation · 0.0% rent growth · sell at horizon
- IRR
- -3.5%
- Equity multiple
- 0.87×
- Total profit
- $-10,813
- Equity at exit
- $44,731
- IRR
- 2.4%
- Equity multiple
- 1.15×
- Total profit
- $12,346
- Equity at exit
- $25,938
Cash invested: $84,000 (down + closing). Projections, not guarantees.
Landlord ↔ Tenant lean methodology
- Overall (STATE)
- 18 Strongly Tenant-Friendly
- State California
- 18 Strongly Tenant-Friendly · D+13
- County
- — inherits STATE
- City
- — inherits STATE
ZIP-level market 94558
- Rents YoY
- -0.5%
- Active inventory
- 538
- Price-to-rent
- 7.0×
Monthly cashflow live
- Estimated rent
- $3,583 medium interval (Pro) →
- Mortgage (P&I)
- −$1,573
- Tax est. 1.5%
- −$375 /mo · $4,500/yr
- Insurance
- −$125
- HOA
- −$0
- Vacancy / Maint / Mgmt
- −$752
- Net cashflow
- $758
Break-even live
UW: 25.0% down · 7.5% · 30yr · 1.5% tax · 5.0% vac · 8.0% maint · 8.0% mgmt
Financing live
Cash to close
- Down payment
- $75,000
- Closing costs
- $9,000
- Reserves months
- —
- Total cash needed
- —
Loan-product check · same deal, 3 products live
Conventional
25% down · 7.5% · 30yr
- Down + closing
- —
- Monthly P&I
- —
- Monthly cashflow
- —
- DSCR
- —
- Eligible?
- —
Personal DTI + credit; lowest rate.
DSCR
20% down · 8.5% · 30yr
- Down + closing
- —
- Monthly P&I
- —
- Monthly cashflow
- —
- DSCR
- —
- Eligible?
- —
No personal income docs; deal must DSCR.
Hard money
10% down · 12.0% · 12mo
- Down + closing
- —
- Monthly P&I
- —
- Monthly cashflow
- —
- DSCR
- —
- Eligible?
- —
Short-term bridge; refi at stabilization.
Rent comps 2 comps
| Address | Beds | Baths | Sqft | Rent | $/sqft | DOM | Units | Dist |
|---|---|---|---|---|---|---|---|---|
| 4412 Moffitt Dr Unit 4412 Napa, CA | 4.0 | 2.0 | 1324 | $3,700 | $2.79 | 43d | 1 | 0.63mi |
| 3663 Solano Ave Napa, CA | 1.0–3.0 | 1.0–2.0 | 1122 | $3,150 | $2.81 | 13d | 7 | 1.44mi |
Listing history 25 events
-
2026-06-18days on market $299,999 Active 46 DOM
-
2026-06-17days on market $299,999 Active 45 DOM
-
2026-06-16days on market $299,999 Active 44 DOM
-
2026-06-15days on market $299,999 Active 43 DOM
-
2026-06-14days on market $299,999 Active 41 DOM
-
2026-06-13remarks 693-char remark
-
2026-06-13pricedays on market $299,999 Active 40 DOM
-
2026-06-10days on market $315,000 Active 38 DOM
-
2026-06-09days on market $315,000 Active 37 DOM
-
2026-06-08days on market $315,000 Active 36 DOM
-
2026-06-07days on market $315,000 Active 35 DOM
-
2026-06-05days on market $315,000 Active 32 DOM
-
2026-06-03days on market $315,000 Active 31 DOM
-
2026-06-03price $315,000 Active 30 DOM
-
2026-06-02days on market $325,000 Active 30 DOM
-
2026-06-01days on market $325,000 Active 29 DOM
-
2026-05-31days on market $325,000 Active 28 DOM
-
2026-05-30remarks 691-char remark
-
2026-05-30days on market $325,000 Active 27 DOM
-
2026-05-16price $325,000 1364-char remark
-
2026-05-03status Active 1364-char remark
-
2026-05-03price $335,000 1364-char remark
-
2026-04-26historical 1364-char remark
-
2026-04-25historical
-
2026-04-25historical $329,000 1364-char remark
ⓘ Source: listings_history table (triggers on properties + properties_extension) + one-shot
backfill from property_details.listing_events for pre-trigger history.
Climate risk First Street
- Flood 1/10 Low FEMA zone X (unshaded) · 0% chance over 30 yrs
- Wildfire 5/10 Major
- Heat 5/10 Major 7 d/yr ≥96°F today · 14 d/yr by 30 yrs out
- Wind 1/10 Low
- Air quality 9/10 Extreme 16 unhealthy d/yr today · 17 by 30 yrs out
Nearby sold comps map
Loading sold comps map…
Walkable amenities ~0.75 mi
Loading nearby amenities…
Taxation est. · year 1
- Rental income
- $42,999
- − Mortgage interest
- −$16,805
- − Property taxes
- −$4,500
- − Insurance
- −$1,500
- − Repairs & maintenance
- −$3,440
- − Management
- −$3,440
- − Depreciation
- −$8,727
- Taxable income
- $4,587
- Est. tax owed @ 24.0%
- −$1,101
- After-tax cash flow
- $7,989/yr
For passive investors: Depreciation is non-cash, so a rental often shows a tax loss while cash-flowing — sheltering income. Rental losses are passive: they offset passive income freely, and up to $25,000/yr can offset ordinary (W-2) income if you actively participate and your MAGI is under $100k (phasing out to $0 by $150k); unused losses carry forward. On sale, claimed depreciation is recaptured at up to 25%, and gains may owe capital-gains tax (a 1031 exchange can defer both). Figures are a year-1 estimate at your 24.0% rate — not tax advice; consult a CPA.
Condition & rehab AI · 12 photos
This corner lot home in La Siesta Village is in excellent condition with recent upgrades and is move-in ready.
Value-add opportunities
- Both Paint exterior and interior — Fresh paint enhances curb appeal and interior aesthetics
- Both Replace carpet with hardwood or tile — Hardwood or tile flooring is more durable and easier to maintain
- Both Install smart home devices — Smart home devices improve convenience and energy efficiency
- Both Add smart thermostat — Smart thermostat enhances comfort and energy efficiency
- Both Install smart lighting — Smart lighting enhances convenience and energy efficiency
Renovation cost estimate screening
Value-add ROI direction
- Both Paint exterior and interior — Fresh paint enhances curb appeal and interior aesthetics ↑
- Both Replace carpet with hardwood or tile — Hardwood or tile flooring is more durable and easier to maintain ↑
- Both Install smart home devices — Smart home devices improve convenience and energy efficiency ↑
- Both Add smart thermostat — Smart thermostat enhances comfort and energy efficiency ↑
- Both Install smart lighting — Smart lighting enhances convenience and energy efficiency ↑
ⓘ Cost ranges are severity-bucket heuristics (US national rule-of-thumb). Get contractor quotes + a written scope before underwriting a rehab budget.
Schools (NCES district)
- District
- Napa Valley Unified
- NCES district ID
- 0626640
- Math proficiency
- 35% ▲ 1.00%
- Reading proficiency
- 48% ▲ 2.00%
- Median HH income
- $72,007
- Composite
- 40.18/100
- National rank
- #7827
- State rank
- #599 of 1400 in CA
Livability — Napa
- Score
- 70/100
- State rank
- #227
- US rank
- #7435
Category grades
Schools grade is shown separately in the Schools card above.
Census & demographics
- Census place
- Napa, CA
- County
- Napa County · 120,669 people
- City population
- 91,371
- Metro
- Napa, CA
- Population (ZIP)
- 63,657
- Household income
- $113,269
- Rent vs Own
- Severe rent burden
- 2095.0
Population outlook (Napa County) Hauer SSP2
- Today (2025)
- 153,987 people
- By 2030
- 159,490 · +3.6%
- By 2040
- 168,796 · +9.6%
- By 2050
- 176,213 · +14.4%
- By 2075
- 190,113 · +23.5%
- By 2100
- 190,528 · +23.7%
Race, ethnicity, and origin ACS 2023
- Neighborhood character
- Diverse neighborhood (Simpson 0.56)
- Race & ethnicity
- White 54% Hispanic / Latino 37% Two or more races 15% Asian 3% Native American 1%
- Hispanic origin (detail)
- Mexican 31%
- Common ancestry
- Italian 4% Lithuanian 2% Portuguese 2%
- Foreign-born
- 21% · Canada
- Languages at home
- 68% English-only · Spanish 28% Other Indo-European 1% Tagalog/Filipino 1%
Political lean MEDSL · Napa
- 2024 margin
- Solid D (+34.9) · D 65.9% · R 31.1% · Other 3.0%
- 2008→2024 swing
- +2.4pp toward D · 2008: 32.5pp · 2024: 34.9pp
- All cycles
- 2024: D+34.9 2020: D+40.4 2016: D+35.2 2012: D+25.7 2008: D+32.5
Not yet ingested
- Civics
- —
Market trends
- HPI YoY
- ▼ -842.94%
- Current HPI
- 296.0661
- Rent YoY
- ▼ -0.50%
- Metro
- Napa, CA
- State GDP YoY
- ▲ 3.21%
- F500 in state
- 116
Industry mix (Fortune 500 HQ in CA)
| Industry | F500 HQs | Revenue |
|---|---|---|
| Technology | 27 | $1,492B |
|
||
| Financial Services | 3 | $174B |
|
||
| Retail | 3 | $44B |
|
||
| Insurance | 3 | $26B |
|
||
| Media / Entertainment | 2 | $115B |
|
||
| Pharmaceuticals / Biotech | 2 | $62B |
|
||
Price history
-8.8% since first listed8 events — show timeline
- 2026-06-12 Price Changed $299,999 bridgeMLS, Bay East AOR, or Contra Costa AOR
- 2026-06-02 Price Changed $315,000 bridgeMLS, Bay East AOR, or Contra Costa AOR
- 2026-05-16 Price Changed $325,000 bridgeMLS, Bay East AOR, or Contra Costa AOR
- 2026-05-03 Relisted — bridgeMLS, Bay East AOR, or Contra Costa AOR
- 2026-05-03 Price Changed $335,000 bridgeMLS, Bay East AOR, or Contra Costa AOR
- 2026-04-26 Listing Removed — bridgeMLS, Bay East AOR, or Contra Costa AOR
- 2026-04-25 Listing Removed — bridgeMLS, Bay East AOR, or Contra Costa AOR
- 2026-04-25 Coming Soon $329,000 bridgeMLS, Bay East AOR, or Contra Costa AOR
Cash-flow waterfall
monthlySold comps — $/sqft
last 12 mo · ≤1 miLoading sold comps…