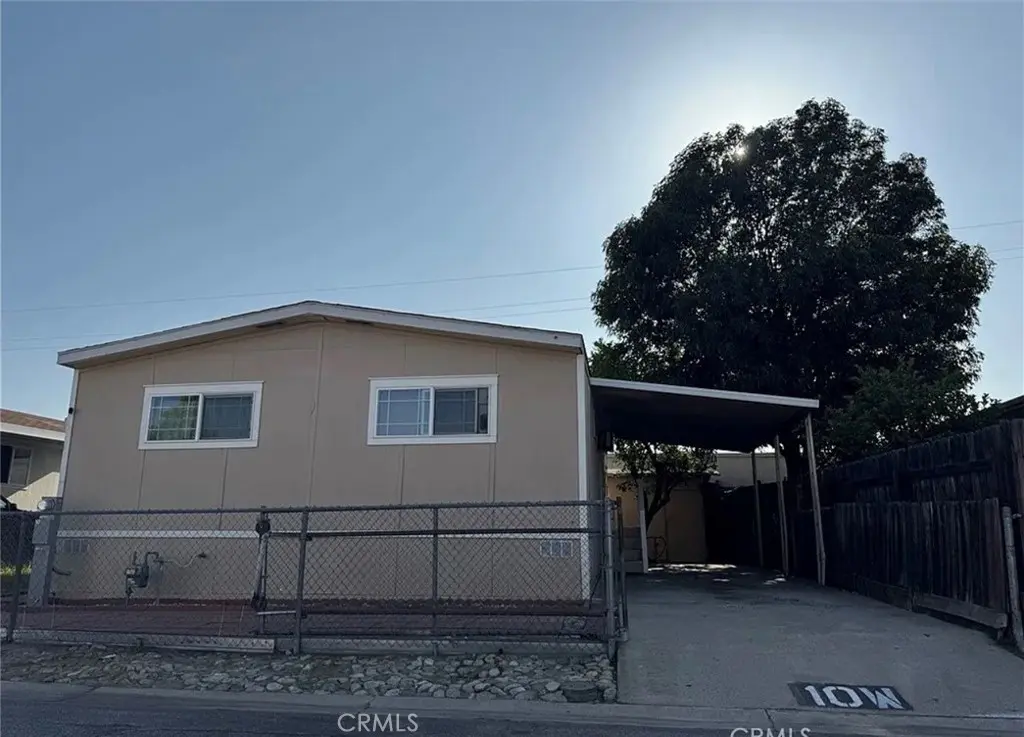
17225 Valley #10 · Fontana, CA
Flood risk 1/10 · Minimal
- FEMA flood zone
- X (unshaded)
- Chance of flooding over 30 yrs
- 0.0%
- Est. flood insurance / yr
- $507 – $1,088
Fire risk 2/10 · Minimal
- Est. fire insurance / yr
- $659 – $1,223
Heat risk 8/10 · Major
- Hot days now (above 103°F)
- 7 days/yr
- Hot days in 30 yrs
- 19 days/yr
Wind risk 1/10 · Minimal
- Chance of severe wind over 30 yrs
- —
Air-quality risk 10/10 · Severe
- Unhealthy air days now
- 27 days/yr
- Unhealthy air days in 30 yrs
- 32 days/yr
Risk factors via First Street. Map © Google.
Why this score? — see what drove the C+ grade
The composite is a weighted blend of 9 inputs, each scored 0–100. Each bar is that input's sub-score; the figure is the points it added to the 100-point composite (weight × sub-score).
- Cash flow +30.0/30.0
- 1% rule +10.0/10.0
- DSCR +10.0/10.0
- Livability +3.2/5.0
- Rent growth +3.1/5.0
- Condition / age +2.5/5.0
- Schools +2.4/10.0
- ARV discount +0.0/15.0
- Appreciation +0.0/10.0
$160,000
🖨 Deal sheet 📄 Offer letter ✓ Due diligence
Listing remarks MLS
Very Motivated seller, very well-Kept home, the best option to own your home instead of renting, good family neighborhood, close to shopping and transportation, across street from Kaiser Hospital, 3 good size bedrooms, dining area and living room, seller will leave washer and dryer, stove and refrigerator will stay too, send an offer that this motivated seller accept and give a step closer to your own home. ..
Key facts
- Washer and dryer
- Stove
- Living room
Tags
Neighborhood map
What this means for you Summary
Snapshot
- This is a 3-bed/2.0-bath manufactured listed at $160k.
Deal economics
- At list price, monthly cash flow is $858 ($10k/yr) — positive.
- The deal already cash-flows at list — no discount required.
- Meets the 1% rule at list price ($2k rent vs $160k).
- Recommended offer: $146k (9.0% below list) — sets the bar for market timing.
- Cap rate 12.7% vs local median 3.2% in Fontana — top-decile yield for the area; either an underpriced asset or a hidden risk that comps aren't pricing in. Stress-test before assuming the spread holds.
Location & tenants
- Location reads 64/100 on livability (#415 in CA) — a middle-class / working-renter tenant base. Strengths: housing A+, commute A-, employment A-; Watch: schools F, amenities F, cost of living F.
- Colton Joint Unified (suburban): math 16% / reading 38% proficiency, ranked #373 of 517 in CA (top 72%) — low school quality limits family demand, transient renter base, plan for 1-2y turnover; 70% free/reduced lunch — lower-income household profile, screen leases tightly.
- Market conditions: Rents rising (+2.3%/yr); 115 active listings in the ZIP; 7 comparable units currently listed for rent nearby; rentals at typical pace (median 25d on market — plan ~3-4 weeks tenant-placement turnaround); solid renter incomes; 5,458 units permitted in San Bernardino County in 2024 (1,500 in 5+ unit buildings).
- This rent runs 38% of the median local income ($78k/yr) — at the standard rent-burdened threshold; future hikes will face affordability resistance.
Forward outlook
- Local home prices are declining (-3.0%/yr); year-one equity from $1k of loan paydown is wiped out by about $5k of value loss. Plan a longer hold.
- San Bernardino County population projected at +15% by 2050 — modest demand growth; plan on rents tracking national, not racing it.
- At projected returns (-3.0% appreciation + 2.3% rent growth), your $45k cash investment doubles in ~6 years — after that, you're playing with house money.
Negotiation context
- It's been on market 91 days — a 9% lower offer ($146k) is reasonable based on typical stale-listing flexibility.
- 3 sale attempts since 17y ago; this cycle's ask has dropped $10k (6%) from the opening price — seller is motivated, your offer sets the floor, not the list.
Risks & watch-outs
- Climate carrying-cost: extreme-heat days projected 7→19/yr by 2055 (HVAC capex compounding) — expect insurance premiums to compound above CPI over the hold.
Questions for the listing agent
- It's been on market 91 days. Have you received any prior offers? Is the seller open to a 9% concession, seller financing, or rate buy-down credit?
- Built in 1975 — when were the roof, HVAC, electrical panel, plumbing, and water heater last replaced?
- Why hasn't it sold? Are there any deal-killer items the seller is aware of (foundation, flood, title, zoning, code violations)?
- Is there a deadline driving the sale (1031 exchange, divorce, estate, relocation)? That informs how much negotiation room exists.
- Schools are F-rated, which usually means shorter tenancies and higher turnover. Who's the typical renter profile here, and what's been the actual vacancy rate?
- What's the average days-on-market for RENTAL listings here right now (not sales)? A rising rental-DOM trend means longer vacancies and softer asking-rent achievability than the comps imply.
- What's the recent tenant-quality profile in this submarket — average credit score on applications, eviction rate, late-payment / NSF rate, and stable-employment percentage? A property-management company in the area should have these aggregated.
- How much new for-sale + rental construction is in the pipeline within 1–3 miles? Heavy new supply typically softens prices + rents 12–24 months out; constrained supply supports both.
Investment metrics
- 1% rule
- 1.55% ✓
- Cap rate
- 12.73%
- Cash-on-cash
- 22.99%
- DSCR
- 2.02
- GRM
- 5.4
CMA / ARV
- ARV (median comp)
- $131,821
- List price
- $160,000
- Delta
- 21.38%
- Verdict
- OVERPRICED
- Comps
- 5 within 1.0 mi
Show comp detail 5 sales within ~0.75 mi
| Address | Dist | Beds/Ba | Sqft | Sold | Price | $/sf | Match |
|---|---|---|---|---|---|---|---|
| 17225 Valley Blvd Unit 45W | 0.04mi | 3/2.0 | 960 (0%) | 15mo | $122,000 | $127 | 86 |
| 17377 Valley Blvd #46 | 0.17mi | 2/2.0 (-1) | 1,050 (+9%) | 23mo | $180,000 | $171 | 52 |
| 17377 Valley Blvd #23 | 0.17mi | 2/2.0 (-1) | 840 (-12%) | 19mo | $135,000 | $161 | 50 |
| 17455 Marygold Ave #39 | 0.35mi | 2/2.0 (-1) | 1,056 (+10%) | 17mo | $105,000 | $99 | 48 |
| 16860 Slover Ave #19 | 0.63mi | 2/2.0 (-1) | 1,056 (+10%) | 6mo | $133,800 | $127 | 44 |
Match score weights: distance 35% · size 25% · config 20% · recency 20%. Top-matched comps best support the ARV.
Projected returns pro-forma
-3.0% appreciation · 2.34% rent growth · sell at horizon
- IRR
- 15.2%
- Equity multiple
- 1.61×
- Total profit
- $27,139
- Equity at exit
- $23,857
- IRR
- 23.4%
- Equity multiple
- 2.95×
- Total profit
- $87,537
- Equity at exit
- $13,834
Cash invested: $44,800 (down + closing). Projections, not guarantees.
Landlord ↔ Tenant lean methodology
- Overall (STATE)
- 18 Strongly Tenant-Friendly
- State California
- 18 Strongly Tenant-Friendly · D+13
- County
- — inherits STATE
- City
- — inherits STATE
ZIP-level market 92335
- Rents YoY
- 2.3%
- Active inventory
- 115
- Price-to-rent
- 5.4×
Monthly cashflow live
- Estimated rent
- $2,486 high interval (Pro) →
- Mortgage (P&I)
- −$839
- Tax est. 1.5%
- −$200 /mo · $2,400/yr
- Insurance
- −$67
- HOA
- −$0
- Vacancy / Maint / Mgmt
- −$522
- Net cashflow
- $858
Break-even live
UW: 25.0% down · 7.5% · 30yr · 1.5% tax · 5.0% vac · 8.0% maint · 8.0% mgmt
Financing live
Cash to close
- Down payment
- $40,000
- Closing costs
- $4,800
- Reserves months
- —
- Total cash needed
- —
Loan-product check · same deal, 3 products live
Conventional
25% down · 7.5% · 30yr
- Down + closing
- —
- Monthly P&I
- —
- Monthly cashflow
- —
- DSCR
- —
- Eligible?
- —
Personal DTI + credit; lowest rate.
DSCR
20% down · 8.5% · 30yr
- Down + closing
- —
- Monthly P&I
- —
- Monthly cashflow
- —
- DSCR
- —
- Eligible?
- —
No personal income docs; deal must DSCR.
Hard money
10% down · 12.0% · 12mo
- Down + closing
- —
- Monthly P&I
- —
- Monthly cashflow
- —
- DSCR
- —
- Eligible?
- —
Short-term bridge; refi at stabilization.
Rent comps 7 comps
| Address | Beds | Baths | Sqft | Rent | $/sqft | DOM | Units | Dist |
|---|---|---|---|---|---|---|---|---|
| 16970 Marygold Ave Fontana, CA | 2.0 | 2.0 | 1045 | $2,275 | $2.18 | 20d | 2 | 0.57mi |
| 16770 San Bernardino Ave Fontana, CA | 2.0 | 1.5 | 968 | $2,275 | $2.35 | 24d | 2 | 0.94mi |
| 16770 San Bernardino Ave Unit 19B Fontana, CA | 2.0 | 1.5 | 968 | $2,350 | $2.43 | 44d | 1 | 0.94mi |
| 16816 Fontlee Ln Fontana, CA | 2.0 | 1.0 | 858 | $2,200 | $2.56 | 18d | 1 | 1.15mi |
| 18181 Valley Blvd Bloomington, CA | 2.0 | 1.5 | 814 | $1,960 | $2.41 | 44d | 2 | 1.16mi |
| 9281 Pepper Ave Unit 04 Fontana, CA | 2.0 | 1.0 | 850 | $1,800 | $2.12 | 24d | 1 | 1.38mi |
| 9223 Cypress Ave Unit 203 Fontana, CA | 2.0 | 1.5 | 1008 | $2,550 | $2.53 | 5d | 1 | 1.49mi |
Listing history 14 events
-
2026-06-04days on market $160,000 Active 91 DOM
-
2026-06-03days on market $160,000 Active 90 DOM
-
2026-06-02days on market $160,000 Active 89 DOM
-
2026-06-01days on market $160,000 Active 88 DOM
-
2026-05-31days on market $160,000 Active 87 DOM
-
2026-05-18price $160,000 413-char remark
Show marketing remark (413 chars)
Very Motivated seller, very well-Kept home, the best option to own your home instead of renting, good family neighborhood, close to shopping and transportation, across street from Kaiser Hospital, 3 good size bedrooms, dining area and living room, seller will leave washer and dryer, stove and refrigerator will stay too, send an offer that this motivated seller accept and give a step closer to your own home. ..
-
2026-03-05$170,000 Active 413-char remark
Show marketing remark (413 chars)
Very Motivated seller, very well-Kept home, the best option to own your home instead of renting, good family neighborhood, close to shopping and transportation, across street from Kaiser Hospital, 3 good size bedrooms, dining area and living room, seller will leave washer and dryer, stove and refrigerator will stay too, send an offer that this motivated seller accept and give a step closer to your own home. ..
-
2025-12-24historical
-
2025-08-18price $165,000
-
2025-07-10$190,000 Active
-
2025-06-28historical
-
2009-11-06historical
-
2009-08-31price $15,000
-
2009-08-05$20,000 Active
ⓘ Source: listings_history table (triggers on properties + properties_extension) + one-shot
backfill from property_details.listing_events for pre-trigger history.
Climate risk First Street
- Flood 1/10 Low FEMA zone X (unshaded) · 0% chance over 30 yrs
- Wildfire 2/10 Low
- Heat 8/10 Severe 7 d/yr ≥103°F today · 19 d/yr by 30 yrs out
- Wind 1/10 Low
- Air quality 10/10 Extreme 27 unhealthy d/yr today · 32 by 30 yrs out
Nearby sold comps map
Loading sold comps map…
Walkable amenities ~0.75 mi
Loading nearby amenities…
Taxation est. · year 1
- Rental income
- $29,834
- − Mortgage interest
- −$8,962
- − Property taxes
- −$2,400
- − Insurance
- −$800
- − Repairs & maintenance
- −$2,387
- − Management
- −$2,387
- − Depreciation
- −$4,655
- Taxable income
- $8,243
- Est. tax owed @ 24.0%
- −$1,978
- After-tax cash flow
- $8,322/yr
For passive investors: Depreciation is non-cash, so a rental often shows a tax loss while cash-flowing — sheltering income. Rental losses are passive: they offset passive income freely, and up to $25,000/yr can offset ordinary (W-2) income if you actively participate and your MAGI is under $100k (phasing out to $0 by $150k); unused losses carry forward. On sale, claimed depreciation is recaptured at up to 25%, and gains may owe capital-gains tax (a 1031 exchange can defer both). Figures are a year-1 estimate at your 24.0% rate — not tax advice; consult a CPA.
Schools (NCES district)
- District
- Colton Joint Unified
- NCES district ID
- 0609390
- Math proficiency
- 16% ▼ -9.00%
- Reading proficiency
- 38% ▼ -1.00%
- Median HH income
- $51,178
- Composite
- 23.74/100
- National rank
- #7820
- State rank
- #373 of 517 in CA
Livability — Fontana
- Score
- 64/100
- State rank
- #415
- US rank
- #14177
Category grades
Schools grade is shown separately in the Schools card above.
Census & demographics
- Census place
- Fontana, CA
- County
- San Bernardino County · 2,030,291 people
- City population
- 203,028
- Metro
- Riverside-San Bernardino-Ontario, CA
- Population (ZIP)
- 97,511
- Household income
- $77,949
- Rent vs Own
- Severe rent burden
- 3437.0
Population outlook (San Bernardino County) Hauer SSP2
- Today (2025)
- 2,300,329 people
- By 2030
- 2,378,907 · +3.4%
- By 2040
- 2,523,137 · +9.7%
- By 2050
- 2,642,388 · +14.9%
- By 2075
- 2,880,769 · +25.2%
- By 2100
- 2,909,436 · +26.5%
Race, ethnicity, and origin ACS 2023
- Neighborhood character
- Predominantly Hispanic (84%)
- Race & ethnicity
- Hispanic / Latino 84% Two or more races 13% White 8% Black 4% Asian 2% Native American 2%
- Hispanic origin (detail)
- Mexican 74%
- Common ancestry
- Italian 1%
- Foreign-born
- 34% · Canada, Vietnam
- Languages at home
- 27% English-only · Spanish 69% Arabic 1%
Political lean MEDSL · San Bernardino
- 2024 margin
- Toss-up / Even · D 47.5% · R 49.7% · Other 2.8%
- 2008→2024 swing
- -8.5pp toward R · 2008: 6.3pp · 2024: -2.1pp
- All cycles
- 2024: R+2.1 2020: D+10.7 2016: D+9.8 2012: D+5.4 2008: D+6.3
Not yet ingested
- Civics
- —
Market trends
- HPI YoY
- ▼ -804.67%
- Current HPI
- 507.5862
- Rent YoY
- ▲ 2.34%
- Metro
- Riverside-San Bernardino-Ontario, CA
- State GDP YoY
- ▲ 3.21%
- F500 in state
- 116
Industry mix (Fortune 500 HQ in CA)
| Industry | F500 HQs | Revenue |
|---|---|---|
| Technology | 27 | $1,492B |
|
||
| Financial Services | 3 | $174B |
|
||
| Retail | 3 | $44B |
|
||
| Insurance | 3 | $26B |
|
||
| Media / Entertainment | 2 | $115B |
|
||
| Pharmaceuticals / Biotech | 2 | $62B |
|
||
Price history
+700.0% since first listed9 events — show timeline
- 2026-05-18 Price Changed $160,000 CRMLS
- 2026-03-05 Listed $170,000 CRMLS
- 2025-12-24 Listing Removed — CRMLS
- 2025-08-18 Price Changed $165,000 CRMLS
- 2025-07-10 Listed $190,000 CRMLS
- 2025-06-28 Coming Soon — CRMLS
- 2009-11-06 Listing Removed — CRMLS
- 2009-08-31 Price Changed $15,000 CRMLS
- 2009-08-05 Listed $20,000 CRMLS
Property tax history
+0.8%/yrLatest (2025): $124 · +3.1% YoY. Source: county tax records.
Cash-flow waterfall
monthlySold comps — $/sqft
last 12 mo · ≤1 miLoading sold comps…