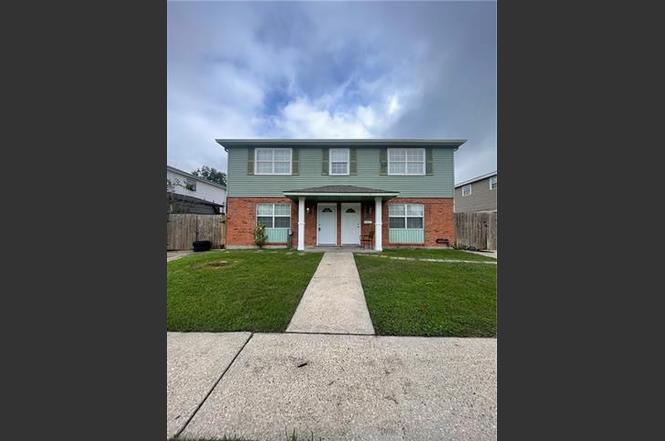
 Duplex
2421-23 Octavia Dr · Chalmette, LA
Flood risk No data
- FEMA flood zone
- —
- Chance of flooding over 30 yrs
- —
- Est. flood insurance / yr
- —
Fire risk No data
- Est. fire insurance / yr
- —
Heat risk No data
- Hot days now (above threshold)
- —
- Hot days in 30 yrs
- —
Wind risk No data
- Chance of severe wind over 30 yrs
- —
Air-quality risk No data
- Unhealthy air days now
- —
- Unhealthy air days in 30 yrs
- —
Risk factors via First Street. Map © Google.
Why this score? — see what drove the B grade
The composite is a weighted blend of 9 inputs, each scored 0–100. Each bar is that input's sub-score; the figure is the points it added to the 100-point composite (weight × sub-score).
- Cash flow +26.5/30.0
- ARV discount +15.0/15.0
- DSCR +9.1/10.0
- 1% rule +7.1/10.0
- Schools +5.0/10.0
- Rent growth +3.3/5.0
- Livability +3.2/5.0
- Condition / age +2.5/5.0
- Appreciation +0.0/10.0
$275,000
🖨 Deal sheet 📄 Offer letter ✓ Due diligence
Multi-family units
County records classify this as Multi-Family (5+ Unit). Listing-text estimate: 2 units. estimate disagrees with records
5+ unit building — per-unit beds/baths from public records are typically unavailable; the breakdown below (if shown) is an estimate from the listing text.
Listing remarks MLS
Really nice double in conveinent area close to schools. Rents for $850 each side. Renovated nicely. Upper unit has wood floors and carpeted hall and bedrooms. Down unit has all ceramic floors. Priced right to sell. Both sides are rented. Need appt. to show, 24 hours if possible.
Key facts
- In-unit laundry
- Off-street parking
- Duplex
Tags
Neighborhood map
What this means for you Summary
Snapshot
- This is a 2 × 3-bed/1.5-bath units multifamily listed at $275k.
Deal economics
- At list price, monthly cash flow is $729 ($9k/yr) — positive. Per door: $364/mo.
- The deal already cash-flows at list — no discount required.
- Meets the 1% rule at list price ($3k rent vs $275k).
- Recommended offer: $258k (6.0% below list) — sets the bar for market timing.
- Cap rate 9.5% vs local median 5.5% in Chalmette — top-decile yield for the area; either an underpriced asset or a hidden risk that comps aren't pricing in. Stress-test before assuming the spread holds.
Location & tenants
- Location reads 65/100 on livability (#137 in LA) — a middle-class / working-renter tenant base. Strengths: cost of living A+, housing A+, health & safety A; Watch: crime F, amenities F, commute F.
- Market conditions: Rents rising (+3.1%/yr); 209 active listings in the ZIP; 3 comparable units currently listed for rent nearby; rentals at typical pace (median 24d on market — plan ~3-4 weeks tenant-placement turnaround); 112 units permitted in St. Bernard Parish in 2024 (0 in 5+ unit buildings).
- At $3,328/mo this rent would consume 73% of the median local household income ($55k/yr) (locally 881% of renters already pay >50% of income on rent) — very limited rent-growth headroom before tenants either downsize or default.
Forward outlook
- Local home prices are declining (-3.0%/yr); year-one equity from $2k of loan paydown is wiped out by about $8k of value loss. Plan a longer hold.
- St. Bernard County population projected at +89% by 2050 — long-run rental-demand tailwind backs the buy-and-hold thesis.
- At projected returns (-3.0% appreciation + 3.1% rent growth), your $77k cash investment doubles in ~10 years — after that, you're playing with house money.
Negotiation context
- It's been on market 65 days — a 6% lower offer ($258k) is reasonable based on typical stale-listing flexibility.
- 5 sale attempts since 26y ago with the ask held roughly flat each time — persistent listings suggest the price (not the market) is what's stuck; bring a comps-based counter.
Questions for the listing agent
- It's been on market 65 days. Have you received any prior offers? Is the seller open to a 6% concession, seller financing, or rate buy-down credit?
- Can we see the unit-by-unit rent roll, current vacancy, and any below-market leases? What's the average tenancy length?
- What capital expenditures (roof, boiler, parking lot, exteriors) have been made in the last 5 years, and what's planned in the next 2?
- Why hasn't it sold? Are there any deal-killer items the seller is aware of (foundation, flood, title, zoning, code violations)?
- Is there a deadline driving the sale (1031 exchange, divorce, estate, relocation)? That informs how much negotiation room exists.
- Crime grade is F in this area — have there been break-ins, vandalism, or insurance claims at this property in the last 3 years? What carrier currently insures it and at what premium?
- What's the average days-on-market for RENTAL listings here right now (not sales)? A rising rental-DOM trend means longer vacancies and softer asking-rent achievability than the comps imply.
- What's the recent tenant-quality profile in this submarket — average credit score on applications, eviction rate, late-payment / NSF rate, and stable-employment percentage? A property-management company in the area should have these aggregated.
- How much new apartment / multifamily construction is in the pipeline within 1–3 miles? Heavy new supply (>2% of stock underway) typically softens rents 12–24 months out; light construction supports rent growth.
Investment metrics
- 1% rule
- 1.21% ✓
- Cap rate
- 9.47%
- Cash-on-cash
- 11.36%
- DSCR
- 1.51
- GRM
- 6.9
CMA / ARV
- ARV (on-the-fly)
- $391,500
- Comps found
- 3
Show comp detail 3 sales within ~0.75 mi
| Address | Dist | Beds/Ba | Sqft | Sold | Price | $/sf | Match |
|---|---|---|---|---|---|---|---|
| 2425-27 Octavia Dr | 0.02mi | —/— | 2,408 (-11%) | 2mo | $330,000 | $137 | 79 |
| 2027-2029 W Beauregard St | 0.44mi | 6/4.0 | 2,352 (-13%) | 1mo | $420,000 | $179 | 57 |
| 2009 Plaza Dr | 0.35mi | 6/6.0 | 3,040 (+13%) | 10mo | $440,000 | $145 | 54 |
Match score weights: distance 35% · size 25% · config 20% · recency 20%. Top-matched comps best support the ARV.
Projected returns pro-forma
-3.0% appreciation · 3.11% rent growth · sell at horizon
- IRR
- 0.8%
- Equity multiple
- 1.03×
- Total profit
- $2,266
- Equity at exit
- $41,003
- IRR
- 10.5%
- Equity multiple
- 1.82×
- Total profit
- $63,452
- Equity at exit
- $23,777
Cash invested: $77,000 (down + closing). Projections, not guarantees.
Landlord ↔ Tenant lean methodology
- Overall (STATE)
- 90 Strongly Landlord-Friendly
- State Louisiana
- 90 Strongly Landlord-Friendly · R+12
- County
- — inherits STATE
- City
- — inherits STATE
ZIP-level market 70043
- Rents YoY
- 3.1%
- Active inventory
- 209
- Price-to-rent
- 13.8×
Monthly cashflow live
- Estimated rent
- $3,328 high interval (Pro) →
- Mortgage (P&I)
- −$1,442
- Tax est. 1.5%
- −$344 /mo · $4,125/yr
- Insurance
- −$115
- HOA
- −$0
- Vacancy / Maint / Mgmt
- −$699
- Net cashflow
- $729
Break-even live
2-unit breakdown (identical units grouped — click to expand)
| Units | Beds | Baths | Est. rent |
|---|---|---|---|
| 2× units | 3 | 1.5 | $3,328 |
| #1 | 3 | 1.5 | $1,664 |
| #2 | 3 | 1.5 | $1,664 |
| Total (2 units) | $3,328 | ||
UW: 25.0% down · 7.5% · 30yr · 1.5% tax · 5.0% vac · 8.0% maint · 8.0% mgmt
Financing live
Cash to close
- Down payment
- $68,750
- Closing costs
- $8,250
- Reserves months
- —
- Total cash needed
- —
Loan-product check · same deal, 3 products live
Conventional
25% down · 7.5% · 30yr
- Down + closing
- —
- Monthly P&I
- —
- Monthly cashflow
- —
- DSCR
- —
- Eligible?
- —
Personal DTI + credit; lowest rate.
DSCR
20% down · 8.5% · 30yr
- Down + closing
- —
- Monthly P&I
- —
- Monthly cashflow
- —
- DSCR
- —
- Eligible?
- —
No personal income docs; deal must DSCR.
Hard money
10% down · 12.0% · 12mo
- Down + closing
- —
- Monthly P&I
- —
- Monthly cashflow
- —
- DSCR
- —
- Eligible?
- —
Short-term bridge; refi at stabilization.
Rent comps 3 comps
| Address | Beds | Baths | Sqft | Rent | $/sqft | DOM | Units | Dist |
|---|---|---|---|---|---|---|---|---|
| 1804 Wisconsin St Chalmette, LA | 3.0 | 3.0 | 2350 | $2,000 | $0.85 | 23d | 1 | 0.41mi |
| 3012 Volpe Dr Chalmette, LA | 3.0 | 2.0 | 1812 | $2,500 | $1.38 | 44d | 1 | 0.54mi |
| 3708 Veronica Dr Chalmette, LA | 3.0 | 2.0 | 1818 | $2,550 | $1.40 | 1d | 1 | 0.94mi |
Listing history 12 events
-
2026-06-18days on market $275,000 Active 65 DOM
-
2026-06-17days on market $275,000 Active 64 DOM
-
2026-06-16statusdays on market $275,000 Active 63 DOM
-
2026-04-06status Pending
-
2026-02-02$275,000 Active
-
2025-09-30price $289,000
-
2025-07-09$299,000 Active
-
2025-01-28historical $1,475
-
2025-01-08price $1,475
-
2024-11-28$1,600
-
2010-08-03$129,000 279-char remark
Show marketing remark (279 chars)
Really nice double in conveinent area close to schools. Rents for $850 each side. Renovated nicely. Upper unit has wood floors and carpeted hall and bedrooms. Down unit has all ceramic floors. Priced right to sell. Both sides are rented. Need appt. to show, 24 hours if possible.
-
2000-06-12$95,000
ⓘ Source: listings_history table (triggers on properties + properties_extension) + one-shot
backfill from property_details.listing_events for pre-trigger history.
Nearby sold comps map
Loading sold comps map…
Walkable amenities ~0.75 mi
Loading nearby amenities…
Taxation est. · year 1
- Rental income
- $39,936
- − Mortgage interest
- −$15,404
- − Property taxes
- −$4,125
- − Insurance
- −$1,375
- − Repairs & maintenance
- −$3,195
- − Management
- −$3,195
- − Depreciation
- −$8,000
- Taxable income
- $4,642
- Est. tax owed @ 24.0%
- −$1,114
- After-tax cash flow
- $7,630/yr
For passive investors: Depreciation is non-cash, so a rental often shows a tax loss while cash-flowing — sheltering income. Rental losses are passive: they offset passive income freely, and up to $25,000/yr can offset ordinary (W-2) income if you actively participate and your MAGI is under $100k (phasing out to $0 by $150k); unused losses carry forward. On sale, claimed depreciation is recaptured at up to 25%, and gains may owe capital-gains tax (a 1031 exchange can defer both). Figures are a year-1 estimate at your 24.0% rate — not tax advice; consult a CPA.
Schools (NCES district)
No district data.
Livability — Chalmette
- Score
- 65/100
- State rank
- #137
- US rank
- #12500
Category grades
Schools grade is shown separately in the Schools card above.
Census & demographics
- Census place
- Chalmette, LA
- County
- Saint Bernard Parish · 22,638 people
- City population
- 22,638
- Metro
- New Orleans-Metairie, LA
- Population (ZIP)
- 22,638
- Household income
- $55,068
- Rent vs Own
- Severe rent burden
- 881.0
Population outlook (St. Bernard County) Hauer SSP2
- Today (2025)
- 66,513 people
- By 2030
- 77,768 · +16.9%
- By 2040
- 101,296 · +52.3%
- By 2050
- 125,770 · +89.1%
- By 2075
- 188,160 · +182.9%
- By 2100
- 239,339 · +259.8%
Race, ethnicity, and origin ACS 2023
- Neighborhood character
- Diverse neighborhood (Simpson 0.61)
- Race & ethnicity
- White 55% Black 26% Hispanic / Latino 12% Two or more races 10% Asian 2%
- Hispanic origin (detail)
- Mexican 2%
- Common ancestry
- Lithuanian 13% Slovak 2%
- Foreign-born
- 6% · Canada, Vietnam
- Languages at home
- 88% English-only · Spanish 8% Arabic 1% Vietnamese 1%
Political lean MEDSL · St. Bernard
- 2024 margin
- Strong R (+29.3) · D 34.5% · R 63.8% · Other 1.7%
- 2008→2024 swing
- +16.1pp toward D · 2008: -45.4pp · 2024: -29.3pp
- All cycles
- 2024: R+29.3 2020: R+28.5 2016: R+33.4 2012: R+24.7 2008: R+45.4
Not yet ingested
- Civics
- —
Market trends
- HPI YoY
- ▼ -211.77%
- Current HPI
- 194.8123
- Rent YoY
- ▲ 3.11%
- Metro
- New Orleans-Metairie, LA
- State GDP YoY
- ▲ 3.29%
- F500 in state
- 10
Industry mix (Fortune 500 HQ in LA)
| Industry | F500 HQs | Revenue |
|---|---|---|
| Telecommunications | 2 | $23B |
|
||
| Utilities | 1 | $12B |
|
||
| Wholesale / Distribution | 1 | $5B |
|
||
| Advertising | 1 | $2B |
|
||
Price history
+189.5% since first listed9 events — show timeline
- 2026-04-06 Pending — AcadianaMLS
- 2026-02-02 Listed $275,000 AcadianaMLS
- 2025-09-30 Price Changed $289,000 AcadianaMLS
- 2025-07-09 Listed $299,000 AcadianaMLS
- 2025-01-28 Rental Removed $1,475 GSREIN
- 2025-01-08 Price Changed $1,475 GSREIN
- 2024-11-28 Listed for Rent $1,600 GSREIN
- 2010-08-03 Listed $129,000 AcadianaMLS
- 2000-06-12 Listed $95,000 AcadianaMLS
Cash-flow waterfall
monthlySold comps — $/sqft
last 12 mo · ≤1 miLoading sold comps…