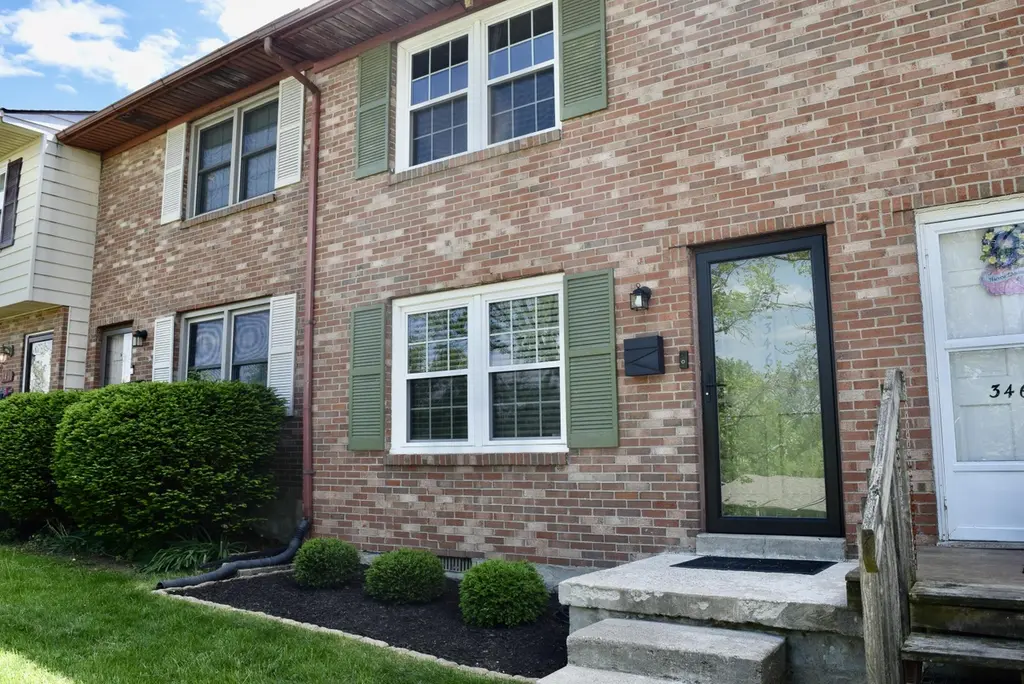
3464 Sutherland Dr · Lexington-Fayette, KY
Flood risk 1/10 · Minimal
- FEMA flood zone
- X (unshaded)
- Chance of flooding over 30 yrs
- 0.0%
- Est. flood insurance / yr
- $507 – $1,088
Fire risk 1/10 · Minimal
- Est. fire insurance / yr
- $839 – $1,559
Heat risk 4/10 · Minor
- Hot days now (above 101°F)
- 7 days/yr
- Hot days in 30 yrs
- 19 days/yr
Wind risk 2/10 · Minimal
- Chance of severe wind over 30 yrs
- 2.0%
Air-quality risk 1/10 · Minimal
- Unhealthy air days now
- 0 days/yr
- Unhealthy air days in 30 yrs
- 0 days/yr
Risk factors via First Street. Map © Google.
Why this score? — see what drove the D- grade
The composite is a weighted blend of 9 inputs, each scored 0–100. Each bar is that input's sub-score; the figure is the points it added to the 100-point composite (weight × sub-score).
- Cash flow +14.3/30.0
- DSCR +4.4/10.0
- ARV discount +4.0/15.0
- Rent growth +3.6/5.0
- 1% rule +3.5/10.0
- Schools +3.4/10.0
- Livability +2.5/5.0
- Condition / age +2.5/5.0
- Appreciation +0.0/10.0
$180,000
🖨 Deal sheet (PDF) 📄 Offer letter ✓ Due diligence
Listing remarks MLS
Updated townhome with new vinyl plank flooring throughout the main floor, white kitchen cabinets, and new vanities in the bathrooms! Downstairs features kitchen, laundry, living room, and half bath. Upstairs features the two bedrooms and full bath. It is turn key and ready for its new owner! Roof is only a year old and HVAC is only 5 years old! HOA includes access to the community pool which is steps away from the back door! Conveniently located to grocery, restaurants, shopping and more!
Key facts
- Community pool
- Fishing pond
- $87 HOA
Tags
Property features AI
Finance
- Other: Subdivision: Gainesway; County: Fayette
- Financial info: Owner pays pool maintenance
- HOA & community: Has association with monthly fee
Exterior
- Parking: Off-street parking; Includes garage
- Utilities: Public sewer; Electricity connected; Water connected; Sewer connected; Cable available; Phone available
- Home design: Two stories; Other structure type
- Construction: Brick veneer exterior; Block foundation; Shingle roof; Built area 1,044 (building area total provided)
- Exterior features: Privacy wood fencing; In-ground pool; Neighborhood view; Public water
Interior
- Kitchen: Range; Dishwasher; Refrigerator
- Bedrooms: 8 total rooms (bedrooms count not specified separately)
- Flooring: Carpet; Vinyl
- Bathrooms: 1 full bathroom; 1 half bathroom
- Heating & cooling: Forced air heating; Heat pump; Electric cooling
- Interior features: Ceiling fan(s); Blinds
- Laundry & utility: Washer hookup (main level); Electric dryer hookup; Dryer
Neighborhood map
What this means for you Summary
Snapshot
- This is a 2-bed/1.5-bath townhouse listed at $180k.
Deal economics
- At list price, monthly cash flow is $34 ($409/yr) — positive.
- The deal already cash-flows at list — no discount required.
- To meet the 1% rule (rent ≥ 1% of price), the offer needs to be $153k (15.2% below list).
- Recommended offer: $153k (15.2% below list) — sets the bar for 1% rule.
- Cap rate 6.5% vs local median 3.8% in Lexington-Fayette — top-decile yield for the area; either an underpriced asset or a hidden risk that comps aren't pricing in. Stress-test before assuming the spread holds.
Location & tenants
- Location reads: area grade D — affects rentability + tenant quality, not the cash-flow math above.
- Fayette County (urban): math 35% / reading 45% proficiency, ranked #27 of 165 in KY (top 16%) — families likely to look elsewhere, expect single-tenant / working-renter base with shorter leases.
- Zoned schools: Tates Creek Elementary School (math 31% / reading 37%, grade F, #329 of 676 statewide, top 49%, 642 students, 70% FRL); Tates Creek Middle School (math 29% / reading 38%, grade F, #105 of 217 statewide, top 51%, 769 students, 58% FRL); Tates Creek High School (math 29% / reading 32%, grade F, #121 of 254 statewide, top 47%, 1,734 students, 52% FRL) — zoned schools average 60% FRL vs 44% district-wide (16 pts higher); higher-poverty schools than district average — tighter screening recommended.
- Market conditions: Rents rising fast (+4.5%/yr); 104 active listings in the ZIP; 37 comparable units currently listed for rent nearby; rentals at typical pace (median 23d on market — plan ~3-4 weeks tenant-placement turnaround); 1,036 units permitted in Fayette County in 2024 (542 in 5+ unit buildings).
- This rent runs 34% of the median local income ($54k/yr) — at the standard rent-burdened threshold; future hikes will face affordability resistance.
Forward outlook
- Local home prices are declining (-3.0%/yr); year-one equity from $1k of loan paydown is wiped out by about $5k of value loss. Plan a longer hold.
- Fayette County population projected at +35% by 2050 — long-run rental-demand tailwind backs the buy-and-hold thesis.
Negotiation context
- It's been on market 34 days — a 3% lower offer ($175k) is reasonable based on typical stale-listing flexibility.
- 5 sale attempts since 10y ago with the ask held roughly flat each time — persistent listings suggest the price (not the market) is what's stuck; bring a comps-based counter.
Questions for the listing agent
- It's been on market 34 days. Have you received any prior offers? Is the seller open to a 15% concession, seller financing, or rate buy-down credit?
- Built in 1974 — when were the roof, HVAC, electrical panel, plumbing, and water heater last replaced?
- What does the HOA fee cover, when was the last increase, and are there any pending special assessments or reserve-fund shortfalls?
- Is there a deadline driving the sale (1031 exchange, divorce, estate, relocation)? That informs how much negotiation room exists.
- The area grade is low — what's the realistic commute time and amenity access for the typical tenant pool here? Any planned neighborhood developments (good or bad) we should know about?
- What's the average days-on-market for RENTAL listings here right now (not sales)? A rising rental-DOM trend means longer vacancies and softer asking-rent achievability than the comps imply.
- What's the recent tenant-quality profile in this submarket — average credit score on applications, eviction rate, late-payment / NSF rate, and stable-employment percentage? A property-management company in the area should have these aggregated.
- How much new for-sale + rental construction is in the pipeline within 1–3 miles? Heavy new supply typically softens prices + rents 12–24 months out; constrained supply supports both.
Investment metrics
- 1% rule
- 0.85% ✗
- Cap rate
- 6.52%
- Cash-on-cash
- 0.81%
- DSCR
- 1.04
- GRM
- 9.8
CMA / ARV
- ARV (on-the-fly)
- $167,040
- Comps found
- 12
Show comp detail 12 sales within ~0.75 mi
| Address | Dist | Beds/Ba | Sqft | Sold | Price | $/sf | Match |
|---|---|---|---|---|---|---|---|
| 3504 Sutherland Dr | 0.06mi | 2/1.5 | 1,044 (0%) | 10mo | $150,000 | $144 | 88 |
| 3436 Sutherland Dr | 0.04mi | 2/1.5 | 1,102 (+6%) | 2mo | $174,000 | $158 | 87 |
| 3520 Sutherland Dr | 0.07mi | 2/1.5 | 1,102 (+6%) | 7mo | $135,000 | $123 | 81 |
| 1076 Armstrong Mill Rd Unit D | 0.65mi | 2/2.0 | 965 (-8%) | 2mo | $145,000 | $150 | 54 |
| 1080 Armstrong Mill Rd Unit A | 0.64mi | 2/2.0 | 966 (-8%) | 4mo | $150,000 | $155 | 52 |
| 1032 Armstrong Mill Rd Unit B | 0.70mi | 2/2.0 | 963 (-8%) | 2mo | $160,000 | $166 | 51 |
| 1036 Armstrong Mill Rd Unit D | 0.70mi | 2/2.0 | 970 (-7%) | 5mo | $155,500 | $160 | 49 |
| 1048 Armstrong Mill Rd Unit C | 0.67mi | 2/2.0 | 972 (-7%) | 10mo | $145,000 | $149 | 47 |
| 1060 Armstrong Mill Rd | 0.66mi | 2/2.0 | 966 (-8%) | 12mo | $170,000 | $176 | 45 |
| 3611 Leisure Creek Ct | 0.65mi | 2/1.5 | 1,149 (+10%) | 14mo | $204,500 | $178 | 41 |
| 3656 Leisure Creek Ct | 0.73mi | 2/2.5 | 1,185 (+14%) | 3mo | $209,900 | $177 | 37 |
| 1069 Chinoe Rd | 0.70mi | 2/1.5 | 1,168 (+12%) | 12mo | $220,000 | $188 | 37 |
Match score weights: distance 35% · size 25% · config 20% · recency 20%. Top-matched comps best support the ARV.
Projected returns pro-forma
-3.0% appreciation · 4.52% rent growth · sell at horizon
- IRR
- -13.4%
- Equity multiple
- 0.51×
- Total profit
- $-24,648
- Equity at exit
- $26,839
- IRR
- -2.4%
- Equity multiple
- 0.83×
- Total profit
- $-8,718
- Equity at exit
- $15,563
Cash invested: $50,400 (down + closing). Projections, not guarantees.
Landlord ↔ Tenant lean methodology
- Overall (STATE)
- 83 Strongly Landlord-Friendly
- State Kentucky
- 83 Strongly Landlord-Friendly · R+16
- County
- — inherits STATE
- City
- — inherits STATE
ZIP-level market 40517
- Rents YoY
- 4.5%
- Active inventory
- 104
- Price-to-rent
- 9.8×
Monthly cashflow live
- Estimated rent
- $1,527 high interval (Pro) →
- Mortgage (P&I)
- −$944
- Tax from tax record
- −$67 /mo · $798/yr
- Insurance
- −$75
- HOA
- −$87
- Vacancy / Maint / Mgmt
- −$321
- Net cashflow
- $34
Break-even live
Sensitivity live
| Price | -10% $136 | -5% $85 | +0% $34 | +5% $-17 | +10% $-68 |
|---|---|---|---|---|---|
| Rent | -10% $-87 | -5% $-26 | +0% $34 | +5% $94 | +10% $155 |
| Rate | -1.0pp $125 | -0.5pp $80 | base $34 | +0.5pp $-13 | +1.0pp $-60 |
UW: 25.0% down · 7.5% · 30yr · 1.5% tax · 5.0% vac · 8.0% maint · 8.0% mgmt
Financing live
Cash to close
- Down payment
- $45,000
- Closing costs
- $5,400
- Reserves months
- —
- Total cash needed
- —
Loan-product check · same deal, 3 products live
Conventional
25% down · 7.5% · 30yr
- Down + closing
- —
- Monthly P&I
- —
- Monthly cashflow
- —
- DSCR
- —
- Eligible?
- —
Personal DTI + credit; lowest rate.
DSCR
20% down · 8.5% · 30yr
- Down + closing
- —
- Monthly P&I
- —
- Monthly cashflow
- —
- DSCR
- —
- Eligible?
- —
No personal income docs; deal must DSCR.
Hard money
10% down · 12.0% · 12mo
- Down + closing
- —
- Monthly P&I
- —
- Monthly cashflow
- —
- DSCR
- —
- Eligible?
- —
Short-term bridge; refi at stabilization.
Rent comps 37 comps
| Address | Beds | Baths | Sqft | Rent | $/sqft | DOM | Units | Dist |
|---|---|---|---|---|---|---|---|---|
| 3448 Dixiana Dr Lexington, KY | 3.0 | 1.5 | 1161 | $1,995 | $1.72 | 25d | 1 | 0.14mi |
| 3339 Sutherland Dr Lexington, KY | 3.0 | 1.5 | 1108 | $1,895 | $1.71 | 15d | 1 | 0.36mi |
| 3522 Creekwood Dr Lexington, KY | 1.0–2.0 | 1.0–2.0 | 838 | $1,593 | $1.90 | 15d | 14 | 0.61mi |
| 3260 Commodore Dr Lexington, KY | 1.0–3.0 | 1.0–2.5 | 1229 | $1,978 | $1.61 | 15d | 11 | 0.73mi |
| 3650 Tates Creek Rd Lexington, KY | 1.0–2.0 | 1.0–2.0 | 825 | $1,400 | $1.70 | 22d | 11 | 0.75mi |
| 3501 Pimlico Pkwy Lexington, KY | 1.0–3.0 | 1.0–2.0 | 832 | $1,205 | $1.45 | 15d | 11 | 0.78mi |
| 3375 Moundview Ct Unit B Lexington, KY | 2.0 | 1.5 | 1150 | $1,500 | $1.30 | 15d | 1 | 0.80mi |
| 1197 Appian Crossing Way Lexington, KY | 1.0–3.0 | 1.0–2.5 | 1066 | $1,259 | $1.18 | 25d | 5 | 0.81mi |
| 1176 Appian Crossing Way Lexington, KY | 2.0 | 2.0 | 970 | $1,029 | $1.06 | 25d | 1 | 0.85mi |
| 1391 Stephen Foster Dr Lexington, KY | 3.0 | 1.0 | 1000 | $1,500 | $1.50 | 15d | 1 | 0.90mi |
| 3628 Bold Bidder Dr Unit B Lexington, KY | 3.0 | 2.0 | 1400 | $1,495 | $1.07 | 25d | 1 | 0.90mi |
| 3504 Careto Ct Lexington, KY | 3.0 | 2.0 | 1200 | $1,800 | $1.50 | 15d | 1 | 0.92mi |
| 3300 Montavesta Rd Lexington, KY | 2.0 | 2.0 | 872 | $1,275 | $1.46 | 22d | 1 | 0.94mi |
| 3612 River Park Dr Lexington, KY | 3.0 | 1.0 | 1025 | $1,695 | $1.65 | 15d | 1 | 0.94mi |
| 1333 Ox Hill Dr Lexington, KY | 3.0 | 1.0 | 1000 | $1,600 | $1.60 | 15d | 1 | 0.97mi |
| 1179 Tatesbrook Dr Unit A Lexington, KY | 3.0 | 1.5 | 1408 | $1,500 | $1.07 | 25d | 1 | 1.03mi |
| 1176 Tatesbrook Dr Unit A Lexington, KY | 2.0 | 1.5 | 950 | $1,400 | $1.47 | 25d | 1 | 1.04mi |
| 1176 Tatesbrook Dr Unit A Lexington, KY | 2.0 | 1.5 | 950 | $1,400 | $1.47 | 15d | 1 | 1.04mi |
| 1230 Trent Blvd Unit Labs Lexington, KY | 3.0 | 1.0 | 1000 | $1,550 | $1.55 | 25d | 1 | 1.12mi |
| 3501 Windgate Way Lexington, KY | 3.0 | 2.0 | 1326 | $2,350 | $1.77 | 25d | 1 | 1.15mi |
| 2371 Chauvin Dr Lexington, KY | 1.0–2.0 | 1.0–1.5 | 875 | $1,499 | $1.71 | 15d | 2 | 1.19mi |
| 3401 Gatewood Ct Lexington, KY | 2.0 | 1.0–1.5 | 900 | $989 | $1.10 | 25d | 5 | 1.25mi |
| 2500 Alumni Dr Lexington, KY | 1.0–3.0 | 1.0–3.0 | 996 | $1,492 | $1.50 | 25d | 1 | 1.26mi |
| 3200 Baird Ct Unit A Lexington, KY | 2.0 | 1.0 | 990 | $1,450 | $1.46 | 25d | 1 | 1.28mi |
| 1552 Samara Glen Way Lexington, KY | 3.0 | 1.0 | 1145 | $1,550 | $1.35 | 25d | 1 | 1.29mi |
| 3203 Paxson Ct Unit 3203 Lexington, KY | 2.0 | 1.0 | 884 | $1,100 | $1.24 | 15d | 1 | 1.29mi |
| 1475 Vintage Cir Unit 1 Lexington, KY | 2.0 | 2.0 | 1306 | $1,595 | $1.22 | 22d | 1 | 1.29mi |
| 2020 Armstrong Mill Rd Lexington, KY | 1.0–2.0 | 1.0–2.0 | 806 | $1,309 | $1.62 | 15d | 7 | 1.30mi |
| 2653 Twinbrooke Ln Lexington, KY | 3.0 | 1.0 | 1400 | $1,600 | $1.14 | 25d | 1 | 1.30mi |
| 2848 Yellowstone Pkwy Unit A Lexington, KY | 2.0 | 1.5 | 1000 | $1,350 | $1.35 | 15d | 1 | 1.34mi |
| 2844 Yellowstone Pkwy Unit C Lexington, KY | 2.0 | 1.5 | 1000 | $1,350 | $1.35 | 25d | 1 | 1.35mi |
| 2941 Winter Gdn Unit 4 Lexington, KY | 2.0 | 1.0 | 1000 | $1,000 | $1.00 | 25d | 1 | 1.37mi |
| 3573 Laredo Dr Lexington, KY | 2.0–3.0 | 1.5–2.5 | 1172 | $1,320 | $1.13 | 25d | 3 | 1.38mi |
| 427 Lancelot Ln Lexington, KY | 3.0 | 1.0 | 1050 | $1,159 | $1.10 | 25d | 1 | 1.40mi |
| 3900 Crosby Dr Lexington, KY | 1.0–2.0 | 1.0–2.0 | 773 | $1,515 | $1.96 | 15d | 13 | 1.47mi |
| 3500 Warwick Dr #27 Lexington, KY | 3.0 | 1.5 | 1104 | $1,600 | $1.45 | 15d | 1 | 1.48mi |
| 3500 Warwick Dr #50 Lexington, KY | 2.0 | 1.5 | 914 | $1,395 | $1.53 | 25d | 1 | 1.49mi |
HOA detail
- Monthly dues
- $87 · $1,044/yr
- Likely covers
- pool
Listing history 21 events
-
2026-06-05statusdays on market $180,000 Pending 34 DOM
-
2026-06-03days on market $180,000 Contingent 33 DOM
-
2026-06-02days on market $180,000 Contingent 32 DOM
-
2026-06-01days on market $180,000 Contingent 31 DOM
-
2026-05-31days on market $180,000 Contingent 30 DOM
-
2026-05-06historical Contingent
-
2026-05-01$180,000 Active
-
2023-06-15soldstatus $160,000 Closed 493-char remark
Show marketing remark (493 chars)
Updated townhome with new vinyl plank flooring throughout the main floor, white kitchen cabinets, and new vanities in the bathrooms! Downstairs features kitchen, laundry, living room, and half bath. Upstairs features the two bedrooms and full bath. It is turn key and ready for its new owner! Roof is only a year old and HVAC is only 5 years old! HOA includes access to the community pool which is steps away from the back door! Conveniently located to grocery, restaurants, shopping and more!
-
2023-05-14historical Contingent 493-char remark
Show marketing remark (493 chars)
Updated townhome with new vinyl plank flooring throughout the main floor, white kitchen cabinets, and new vanities in the bathrooms! Downstairs features kitchen, laundry, living room, and half bath. Upstairs features the two bedrooms and full bath. It is turn key and ready for its new owner! Roof is only a year old and HVAC is only 5 years old! HOA includes access to the community pool which is steps away from the back door! Conveniently located to grocery, restaurants, shopping and more!
-
2023-05-11$150,000 Active 493-char remark
Show marketing remark (493 chars)
Updated townhome with new vinyl plank flooring throughout the main floor, white kitchen cabinets, and new vanities in the bathrooms! Downstairs features kitchen, laundry, living room, and half bath. Upstairs features the two bedrooms and full bath. It is turn key and ready for its new owner! Roof is only a year old and HVAC is only 5 years old! HOA includes access to the community pool which is steps away from the back door! Conveniently located to grocery, restaurants, shopping and more!
-
2020-07-20soldstatus $63,000
-
2017-01-28historical
-
2017-01-06status Active
-
2017-01-04historical
-
2016-11-18price $60,000
-
2016-09-26status Active
-
2016-09-20status Pending
-
2016-08-12price $62,000
-
2016-07-25price $64,000
-
2016-07-16price $65,000
-
2016-07-07$66,000 Active
ⓘ Source: listings_history table (triggers on properties + properties_extension) + one-shot
backfill from property_details.listing_events for pre-trigger history.
Tax reassessment forecast KY · Resets to sale price
- Current annual tax
- $798 · $67/mo
- Projected year-2 tax
- $1,548 · $129/mo
- Expected delta
- +$750/yr (+$62/mo · 93.9%)
ⓘ Screening estimate from a state-policy table — verify with the county assessor before closing.
Climate risk First Street
- Flood 1/10 Low FEMA zone X (unshaded) · 0% chance over 30 yrs
- Wildfire 1/10 Low
- Heat 4/10 Moderate 7 d/yr ≥101°F today · 19 d/yr by 30 yrs out
- Wind 2/10 Low 2% chance of damaging wind over 30 yrs
- Air quality 1/10 Low 0 unhealthy d/yr today · 0 by 30 yrs out
Nearby sold comps map
Loading sold comps map…
Walkable amenities ~0.75 mi
Loading nearby amenities…
Taxation est. · year 1
- Rental income
- $18,327
- − Mortgage interest
- −$10,083
- − Property taxes
- −$798
- − Insurance
- −$900
- − Repairs & maintenance
- −$1,466
- − Management
- −$1,466
- − HOA
- −$1,044
- − Depreciation
- −$5,236
- Taxable loss
- −$2,667
- Est. tax savings @ 24.0%
- +$640
- After-tax cash flow
- $1,049/yr
For passive investors: Depreciation is non-cash, so a rental often shows a tax loss while cash-flowing — sheltering income. Rental losses are passive: they offset passive income freely, and up to $25,000/yr can offset ordinary (W-2) income if you actively participate and your MAGI is under $100k (phasing out to $0 by $150k); unused losses carry forward. On sale, claimed depreciation is recaptured at up to 25%, and gains may owe capital-gains tax (a 1031 exchange can defer both). Figures are a year-1 estimate at your 24.0% rate — not tax advice; consult a CPA.
Schools (NCES district)
- District
- Fayette County
- NCES district ID
- 2101860
- Math proficiency
- 35% ▼ -16.00%
- Reading proficiency
- 45% ▼ -13.00%
- Median HH income
- $49,245
- Composite
- 34.38/100
- National rank
- #5211
- State rank
- #27 of 165 in KY
Livability — Lexington-Fayette
No livability data for this city. (Only ~50 U.S. cities are tracked.)
Census & demographics
- Census place
- Lexington-Fayette, KY
- County
- Fayette County · 317,143 people
- City population
- 321,882
- Metro
- Lexington-Fayette, KY
- Population (ZIP)
- 35,656
- Household income
- $53,670
- Rent vs Own
- Severe rent burden
- 2743.0
Population outlook (Fayette County) Hauer SSP2
- Today (2025)
- 363,454 people
- By 2030
- 388,270 · +6.8%
- By 2040
- 438,688 · +20.7%
- By 2050
- 490,667 · +35.0%
- By 2075
- 625,394 · +72.1%
- By 2100
- 721,354 · +98.5%
Race, ethnicity, and origin ACS 2023
- Neighborhood character
- Diverse neighborhood (Simpson 0.57)
- Race & ethnicity
- White 60% Black 24% Two or more races 9% Hispanic / Latino 8% Asian 2%
- Hispanic origin (detail)
- Mexican 5%
- Common ancestry
- Italian 3% Lithuanian 2% Slovak 1%
- Foreign-born
- 9% · Canada
- Languages at home
- 87% English-only · Spanish 6% Other Indo-European 2% Arabic 1%
Political lean MEDSL · Fayette
- 2024 margin
- D (+18.1) · D 58.0% · R 39.9% · Other 2.1%
- 2008→2024 swing
- +13.3pp toward D · 2008: 4.8pp · 2024: 18.1pp
- All cycles
- 2024: D+18.1 2020: D+20.8 2016: D+9.5 2012: D+1.0 2008: D+4.8
Not yet ingested
- Civics
- —
Market trends
- HPI YoY
- ▼ -182.53%
- Current HPI
- 248.0466
- Rent YoY
- ▲ 4.52%
- Metro
- Lexington-Fayette, KY
- State GDP YoY
- ▲ 1.81%
- F500 in state
- 4
Industry mix (Fortune 500 HQ in KY)
| Industry | F500 HQs | Revenue |
|---|---|---|
| Healthcare | 1 | $118B |
|
||
| Food / Beverage | 1 | $7B |
|
||
Price history
+172.7% since first listed16 events — show timeline
- 2026-05-06 Contingent — ImagineMLS
- 2026-05-01 Listed $180,000 ImagineMLS
- 2023-06-15 Sold (MLS) $160,000 ImagineMLS
- 2023-05-14 Contingent — ImagineMLS
- 2023-05-11 Listed $150,000 ImagineMLS
- 2020-07-20 Sold (Public Records) $63,000 Public Records
- 2017-01-28 Listing Removed — ImagineMLS
- 2017-01-06 Relisted — ImagineMLS
- 2017-01-04 Listing Removed — ImagineMLS
- 2016-11-18 Price Changed $60,000 ImagineMLS
- 2016-09-26 Relisted — ImagineMLS
- 2016-09-20 Pending — ImagineMLS
- 2016-08-12 Price Changed $62,000 ImagineMLS
- 2016-07-25 Price Changed $64,000 ImagineMLS
- 2016-07-16 Price Changed $65,000 ImagineMLS
- 2016-07-07 Listed $66,000 ImagineMLS
Property tax history
+1.8%/yrLatest (2015): $798 · +1.8% YoY. Source: county tax records.
Cash-flow waterfall
monthlySold comps — $/sqft
last 12 mo · ≤1 miLoading sold comps…