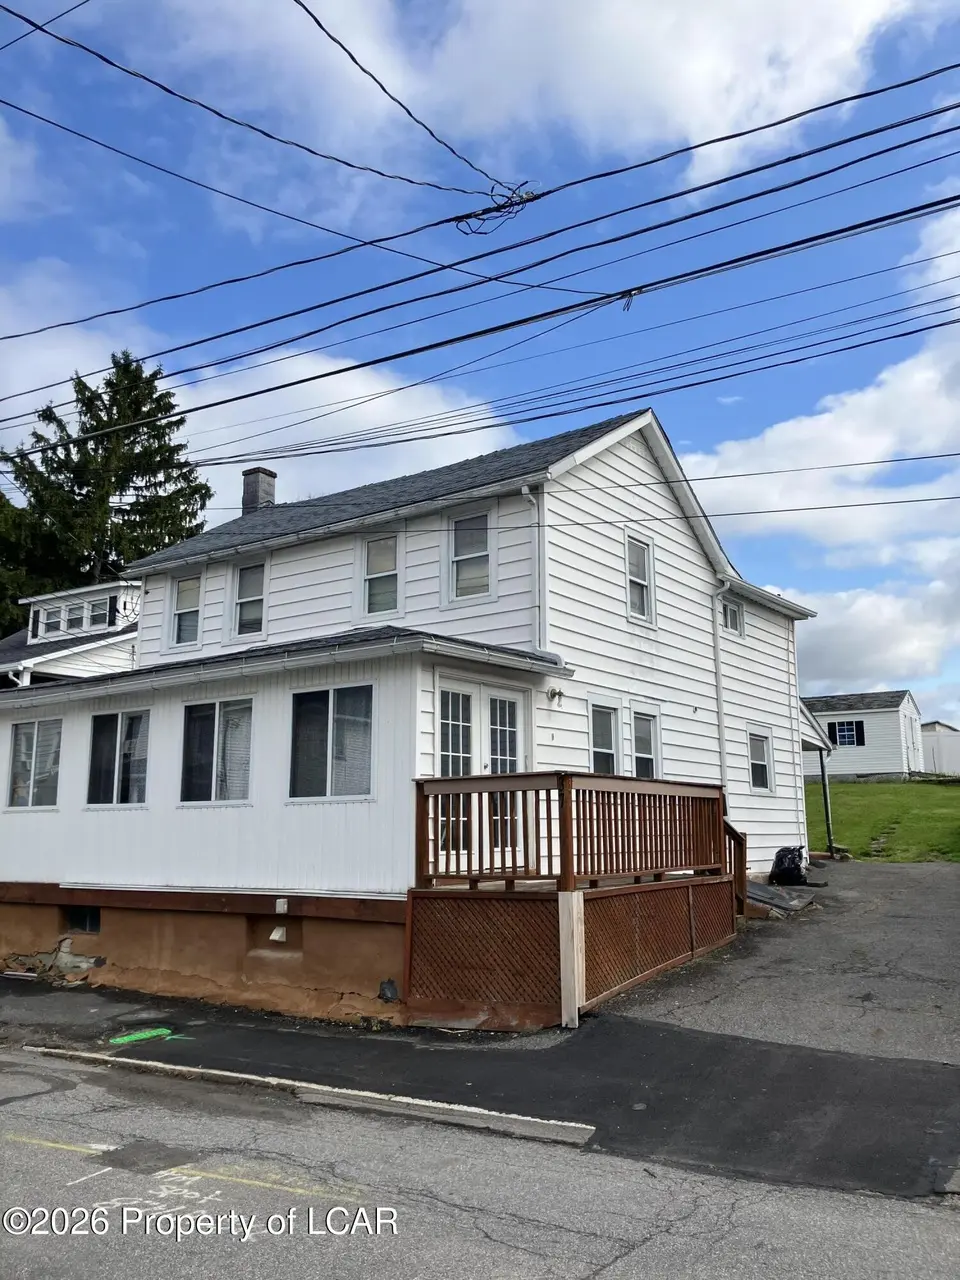
37 Spring St · Wilkes-Barre, PA
Flood risk 1/10 · Minimal
- FEMA flood zone
- X (unshaded)
- Chance of flooding over 30 yrs
- 0.0%
- Est. flood insurance / yr
- $507 – $1,088
Fire risk 4/10 · Minor
- Est. fire insurance / yr
- $511 – $949
Heat risk 4/10 · Minor
- Hot days now (above 94°F)
- 7 days/yr
- Hot days in 30 yrs
- 16 days/yr
Wind risk 3/10 · Minor
- Chance of severe wind over 30 yrs
- 4.0%
Air-quality risk 2/10 · Minimal
- Unhealthy air days now
- 1 days/yr
- Unhealthy air days in 30 yrs
- 2 days/yr
Risk factors via First Street. Map © Google.
Why this score? — see what drove the C grade
The composite is a weighted blend of 9 inputs, each scored 0–100. Each bar is that input's sub-score; the figure is the points it added to the 100-point composite (weight × sub-score).
- Cash flow +23.0/30.0
- ARV discount +13.4/15.0
- DSCR +7.4/10.0
- 1% rule +5.7/10.0
- Rent growth +2.5/5.0
- Livability +2.5/5.0
- Condition / age +2.5/5.0
- Schools +1.9/10.0
- Appreciation +0.0/10.0
$139,900
🖨 Deal sheet 📄 Offer letter ✓ Due diligence
Listing remarks
Come check out this great property priced to sell quick ! Wont last long
Key facts
- 6,307 sq ft lot
- Listed 15 days
Property features AI
Exterior
- Utilities: Public water; Public sewer
- Home design: Single-family residence; Two levels
- Construction: Aluminum siding
- Exterior features: Cleared lot
Interior
- Bathrooms: One full bathroom; One half bathroom
- Heating & cooling: Electric baseboard heating; Has heating
- Interior features: Dining room fireplace; Nine total rooms
Neighborhood map
What this means for you Summary
Snapshot
- This is a 3-bed/1.5-bath single-family listed at $140k.
Deal economics
- At list price, monthly cash flow is $248 ($3k/yr) — positive.
- The deal already cash-flows at list — no discount required.
- Meets the 1% rule at list price ($1k rent vs $140k).
- Recommended offer: $138k (1.5% below list) — sets the bar for market timing.
- Cap rate 8.4% vs local median 5.7% in Wilkes-Barre — top-decile yield for the area; either an underpriced asset or a hidden risk that comps aren't pricing in. Stress-test before assuming the spread holds.
Location & tenants
- Location reads: area grade C — affects rentability + tenant quality, not the cash-flow math above.
- Hanover Area SD (suburban): math 19% / reading 25% proficiency, ranked #484 of 539 in PA (top 90%) — low school quality limits family demand, transient renter base, plan for 1-2y turnover.
- Market conditions: 81 active listings in the ZIP; 34 comparable units currently listed for rent nearby; rentals lingering (median 44d on market — plan ~5-8 weeks vacancy on turnover, expect pricing pressure); 50% of comp listings sitting > 30 days — soft ceiling on asking rent; 349 units permitted in Luzerne County in 2024 (16 in 5+ unit buildings).
- This rent runs 31% of the median local income ($59k/yr) — at the standard rent-burdened threshold; future hikes will face affordability resistance.
Forward outlook
- Local home prices are declining (-3.0%/yr); year-one equity from $967 of loan paydown is wiped out by about $4k of value loss. Plan a longer hold.
- Luzerne County population projected at +4% by 2050 — modest demand growth; plan on rents tracking national, not racing it.
Negotiation context
- It's been on market 15 days — a 2% lower offer ($138k) is reasonable based on typical stale-listing flexibility.
- 2 sale attempts with the ask held roughly flat each time — persistent listings suggest the price (not the market) is what's stuck; bring a comps-based counter.
Risks & watch-outs
- Watch-outs: built in 1940 — expect roof / HVAC / electrical / plumbing capex.
Questions for the listing agent
- Built in 1940 — when were the roof, HVAC, electrical panel, plumbing, and water heater last replaced?
- Is there a deadline driving the sale (1031 exchange, divorce, estate, relocation)? That informs how much negotiation room exists.
- What's the average days-on-market for RENTAL listings here right now (not sales)? A rising rental-DOM trend means longer vacancies and softer asking-rent achievability than the comps imply.
- What's the recent tenant-quality profile in this submarket — average credit score on applications, eviction rate, late-payment / NSF rate, and stable-employment percentage? A property-management company in the area should have these aggregated.
- How much new for-sale + rental construction is in the pipeline within 1–3 miles? Heavy new supply typically softens prices + rents 12–24 months out; constrained supply supports both.
Investment metrics
- 1% rule
- 1.07% ✓
- Cap rate
- 8.42%
- Cash-on-cash
- 7.60%
- DSCR
- 1.34
- GRM
- 7.8
CMA / ARV
- ARV (median comp)
- $160,853
- List price
- $139,900
- Delta
- -13.03%
- Verdict
- UNDERPRICED
- Comps
- 20 within 1.0 mi
Show comp detail 12 sales within ~0.75 mi
| Address | Dist | Beds/Ba | Sqft | Sold | Price | $/sf | Match |
|---|---|---|---|---|---|---|---|
| 223 Poplar St | 0.31mi | 3/1.0 | 1,476 (+2%) | 1mo | $220,000 | $149 | 78 |
| 85 Brown St | 0.31mi | 3/1.0 | 1,422 (-1%) | 4mo | $140,000 | $98 | 78 |
| 323 Andover St | 0.19mi | 4/1.0 (+1) | 1,472 (+2%) | 3mo | $152,000 | $103 | 78 |
| 287 Andover St | 0.24mi | 3/2.0 | 1,312 (-9%) | 2mo | $120,000 | $91 | 71 |
| 421 Andover St | 0.14mi | 3/1.0 | 1,616 (+12%) | 1mo | $175,000 | $108 | 70 |
| 382 Parrish St | 0.47mi | 3/2.0 | 1,520 (+6%) | 0mo | $175,000 | $115 | 67 |
| 82 Newport St | 0.37mi | 3/2.0 | 1,600 (+11%) | 1mo | $265,000 | $166 | 61 |
| 17 Manhattan St | 0.42mi | 3/1.5 | 1,256 (-13%) | 1mo | $154,000 | $123 | 58 |
| 216 Jones St | 0.55mi | 3/2.5 | 1,570 (+9%) | 3mo | $205,000 | $131 | 53 |
| 21 W Hartford St | 0.48mi | 3/1.0 | 1,258 (-13%) | 3mo | $123,600 | $98 | 52 |
| 127 Loomis St | 0.50mi | 2/2.0 (-1) | 1,245 (-14%) | 0mo | $124,000 | $100 | 47 |
| 62 Jones St | 0.61mi | 3/2.0 | 1,655 (+15%) | 4mo | $110,000 | $66 | 42 |
Match score weights: distance 35% · size 25% · config 20% · recency 20%. Top-matched comps best support the ARV.
Projected returns pro-forma
-3.0% appreciation · 3.0% rent growth · sell at horizon
- IRR
- -4.7%
- Equity multiple
- 0.82×
- Total profit
- $-6,859
- Equity at exit
- $20,860
- IRR
- 5.0%
- Equity multiple
- 1.37×
- Total profit
- $14,384
- Equity at exit
- $12,096
Cash invested: $39,172 (down + closing). Projections, not guarantees.
Landlord ↔ Tenant lean methodology
- Overall (STATE)
- 62 Landlord-Friendly
- State Pennsylvania
- 62 Landlord-Friendly · EVEN
- County
- — inherits STATE
- City
- — inherits STATE
ZIP-level market 18706
- Active inventory
- 81
- Price-to-rent
- 7.8×
Monthly cashflow live
- Estimated rent
- $1,491 high interval (Pro) →
- Mortgage (P&I)
- −$734
- Tax from tax record
- −$137 /mo · $1,650/yr
- Insurance
- −$58
- HOA
- −$0
- Vacancy / Maint / Mgmt
- −$313
- Net cashflow
- $248
Break-even live
UW: 25.0% down · 7.5% · 30yr · 1.5% tax · 5.0% vac · 8.0% maint · 8.0% mgmt
Financing live
Cash to close
- Down payment
- $34,975
- Closing costs
- $4,197
- Reserves months
- —
- Total cash needed
- —
Loan-product check · same deal, 3 products live
Conventional
25% down · 7.5% · 30yr
- Down + closing
- —
- Monthly P&I
- —
- Monthly cashflow
- —
- DSCR
- —
- Eligible?
- —
Personal DTI + credit; lowest rate.
DSCR
20% down · 8.5% · 30yr
- Down + closing
- —
- Monthly P&I
- —
- Monthly cashflow
- —
- DSCR
- —
- Eligible?
- —
No personal income docs; deal must DSCR.
Hard money
10% down · 12.0% · 12mo
- Down + closing
- —
- Monthly P&I
- —
- Monthly cashflow
- —
- DSCR
- —
- Eligible?
- —
Short-term bridge; refi at stabilization.
Rent comps 34 comps
| Address | Beds | Baths | Sqft | Rent | $/sqft | DOM | Units | Dist |
|---|---|---|---|---|---|---|---|---|
| 233 Gilligan St Wilkes Barre, PA | 3.0 | 1.0 | 1440 | $1,600 | $1.11 | 21d | 1 | 0.09mi |
| 407 McLean St Wilkes Barre, PA | 3.0 | 1.0 | 1482 | $1,400 | $0.94 | 13d | 1 | 0.28mi |
| 239 Poplar St Wilkes Barre, PA | 3.0 | 1.5 | 1100 | $1,350 | $1.23 | 44d | 1 | 0.30mi |
| 100 E Newport St Hanover Township, PA | 2.0 | 1.5 | 1344 | $1,250 | $0.93 | 44d | 1 | 0.39mi |
| 134 Nicholson St Wilkes Barre, PA | 4.0 | 1.0 | 1200 | $1,600 | $1.33 | 21d | 1 | 0.47mi |
| 134 Nicholson St Unit 3 Wilkes-Barre Township, PA | 4.0 | 1.0 | 1200 | $1,500 | $1.25 | 13d | 1 | 0.47mi |
| 44 Eagle Ct Wilkes Barre, PA | 1.0–3.0 | 1.0–1.5 | 910 | $1,999 | $2.20 | 13d | 5 | 0.49mi |
| 96 McLean St Wilkes-Barre Township, PA | 3.0 | 1.0 | 1535 | $1,550 | $1.01 | 44d | 1 | 0.54mi |
| 32 Murray St Unit 34 Wilkes-Barre, PA | 3.0 | 1.0 | 930 | $1,100 | $1.18 | 21d | 1 | 0.59mi |
| 26 Bradford St Wilkes Barre, PA | 3.0 | 1.5 | 1056 | $1,400 | $1.33 | 13d | 1 | 0.62mi |
| 68 Circle Dr Hanover Township, PA | 3.0 | 1.5 | 950 | $1,800 | $1.89 | 13d | 1 | 0.78mi |
| 109 Barnes St Unit C Ashley, PA | 2.0 | 1.0 | 925 | $1,045 | $1.13 | 21d | 1 | 0.84mi |
| 62 Hutson St Wilkes Barre, PA | 2.0 | 1.0 | 1100 | $1,150 | $1.05 | 44d | 1 | 0.93mi |
| 100-102 Westminster St Wilkes-Barre, PA | 2.0 | 1.0 | 1200 | $1,150 | $0.96 | 21d | 1 | 0.95mi |
| 100-102 Westminster St Wilkes-Barre, PA | 2.0 | 1.0 | 1100 | $1,150 | $1.05 | 13d | 1 | 0.95mi |
| 100 Westminster St Wilkes Barre, PA | 4.0 | 1.0 | 1150 | $1,400 | $1.22 | 13d | 1 | 0.95mi |
| 284 Barney St Wilkes Barre, PA | 3.0 | 1.0 | 1070 | $1,600 | $1.50 | 44d | 1 | 0.97mi |
| 56 Kent Ln Wilkes Barre, PA | 3.0 | 2.0 | 1542 | $1,800 | $1.17 | 44d | 1 | 1.00mi |
| 75 Wood St Wilkes Barre, PA | 2.0 | 1.0 | 990 | $1,300 | $1.31 | 44d | 1 | 1.03mi |
| 132 Sambourne St Wilkes Barre, PA | 2.0 | 1.0 | 1000 | $1,250 | $1.25 | 21d | 1 | 1.04mi |
| 34 Barney St Fl Right Wilkes-Barre, PA | 2.0 | 1.0 | 1000 | $1,195 | $1.20 | 44d | 1 | 1.10mi |
| 75 Oxford St Hanover Township, PA | 2.0 | 1.0 | 900 | $950 | $1.06 | 13d | 1 | 1.14mi |
| 13 Woodbury St Hanover Township, PA | 2.0 | 1.0 | 1000 | $1,100 | $1.10 | 44d | 1 | 1.15mi |
| 129 Carlisle St Wilkes Barre, PA | 2.0 | 1.0 | 1005 | $1,200 | $1.19 | 13d | 1 | 1.15mi |
| 216 Horton St Wilkes Barre, PA | 3.0 | 1.5 | 1475 | $1,575 | $1.07 | 44d | 1 | 1.16mi |
| 403 S Franklin St Wilkes Barre, PA | 2.0 | 1.0 | 900 | $1,050 | $1.17 | 21d | 1 | 1.22mi |
| 131 Academy St Wilkes Barre, PA | 3.0 | 1.0 | 1300 | $1,500 | $1.15 | 44d | 1 | 1.32mi |
| 6 Magnolia St Wilkes Barre, PA | 3.0 | 2.5 | 1700 | $1,450 | $0.85 | 44d | 1 | 1.33mi |
| 27 Oak St Wilkes Barre, PA | 3.0 | 1.5 | 1500 | $1,700 | $1.13 | 44d | 1 | 1.36mi |
| 155 W River St Wilkes Barre, PA | 3.0 | 2.0 | 1100 | $1,425 | $1.30 | 44d | 1 | 1.40mi |
| 342 Horton St Wilkes Barre, PA | 3.0 | 1.5 | 1472 | $1,650 | $1.12 | 13d | 1 | 1.40mi |
| 1259 Sively St Wilkes-Barre, PA | 3.0 | 1.0 | 1232 | $1,550 | $1.26 | 44d | 1 | 1.43mi |
| 26 Stanley St Wilkes Barre, PA | 2.0 | 1.0 | 950 | $1,650 | $1.74 | 44d | 1 | 1.47mi |
| 104 Old River Rd Wilkes Barre, PA | 3.0 | 1.5 | 1600 | $1,800 | $1.12 | 44d | 1 | 1.49mi |
Listing history 3 events
-
2026-05-15status Active 72-char remark
-
2026-05-12status Pending 72-char remark
-
2026-05-10$139,900 Active 72-char remark
ⓘ Source: listings_history table (triggers on properties + properties_extension) + one-shot
backfill from property_details.listing_events for pre-trigger history.
Tax reassessment forecast PA · Partial reset (capped growth)
- Current annual tax
- $1,650 · $137/mo
- Projected year-2 tax
- $1,930 · $161/mo
- Expected delta
- +$280/yr (+$23/mo · 17.0%)
ⓘ Screening estimate from a state-policy table — verify with the county assessor before closing.
Climate risk First Street
- Flood 1/10 Low FEMA zone X (unshaded) · 0% chance over 30 yrs
- Wildfire 4/10 Moderate
- Heat 4/10 Moderate 7 d/yr ≥94°F today · 16 d/yr by 30 yrs out
- Wind 3/10 Moderate 4% chance of damaging wind over 30 yrs
- Air quality 2/10 Low 1 unhealthy d/yr today · 2 by 30 yrs out
Nearby sold comps map
Loading sold comps map…
Walkable amenities ~0.75 mi
Loading nearby amenities…
Taxation est. · year 1
- Rental income
- $17,889
- − Mortgage interest
- −$7,837
- − Property taxes
- −$1,650
- − Insurance
- −$700
- − Repairs & maintenance
- −$1,431
- − Management
- −$1,431
- − Depreciation
- −$4,070
- Taxable income
- $771
- Est. tax owed @ 24.0%
- −$185
- After-tax cash flow
- $2,794/yr
For passive investors: Depreciation is non-cash, so a rental often shows a tax loss while cash-flowing — sheltering income. Rental losses are passive: they offset passive income freely, and up to $25,000/yr can offset ordinary (W-2) income if you actively participate and your MAGI is under $100k (phasing out to $0 by $150k); unused losses carry forward. On sale, claimed depreciation is recaptured at up to 25%, and gains may owe capital-gains tax (a 1031 exchange can defer both). Figures are a year-1 estimate at your 24.0% rate — not tax advice; consult a CPA.
Schools (NCES district)
- District
- Hanover Area SD
- NCES district ID
- 4211420
- Math proficiency
- 19% ▼ -3.00%
- Reading proficiency
- 25% ▼ -21.00%
- Median HH income
- $40,015
- Composite
- 18.6/100
- National rank
- #8903
- State rank
- #484 of 539 in PA
Livability — Wilkes-Barre
No livability data for this city. (Only ~50 U.S. cities are tracked.)
Census & demographics
- County
- Luzerne County · 118,885 people
- City population
- 73,981
- Metro
- Scranton--Wilkes-Barre, PA
- Population (ZIP)
- 16,387
- Household income
- $58,558
- Rent vs Own
- Severe rent burden
- 568.0
Population outlook (Luzerne County) Hauer SSP2
- Today (2025)
- 319,505 people
- By 2030
- 319,943 · +0.1%
- By 2040
- 322,643 · +1.0%
- By 2050
- 330,817 · +3.5%
- By 2075
- 379,145 · +18.7%
- By 2100
- 431,908 · +35.2%
Race, ethnicity, and origin ACS 2023
- Neighborhood character
- Predominantly White (76%)
- Race & ethnicity
- White 76% Hispanic / Latino 17% Two or more races 11% Black 3%
- Hispanic origin (detail)
- Puerto Rican 9% Dominican 4%
- Common ancestry
- Romanian 18% Scotch-Irish 3% Subsaharan African 1%
- Foreign-born
- 6% · Canada
- Languages at home
- 88% English-only · Spanish 10% Other Asian/Pacific 1%
Political lean MEDSL · Luzerne
- 2024 margin
- R (+19.2) · D 40.0% · R 59.2%
- 2008→2024 swing
- -27.6pp toward R · 2008: 8.4pp · 2024: -19.2pp
- All cycles
- 2024: R+19.2 2020: R+14.4 2016: R+19.6 2012: D+4.8 2008: D+8.4
Not yet ingested
- Civics
- —
Market trends
- HPI YoY
- ▼ -150.02%
- Current HPI
- 196.19
- Rent YoY
- —
- Metro
- Scranton--Wilkes-Barre, PA
- State GDP YoY
- ▲ 1.68%
- F500 in state
- 34
Industry mix (Fortune 500 HQ in PA)
| Industry | F500 HQs | Revenue |
|---|---|---|
| Healthcare | 2 | $309B |
|
||
| Insurance | 2 | $27B |
|
||
| Telecommunications / Media | 1 | $124B |
|
||
| Industrial Distribution | 1 | $22B |
|
||
| Financial Services | 1 | $20B |
|
||
| Chemicals / Materials | 1 | $18B |
|
||
Price history
4 events — show timeline
- 2026-05-28 Pending — LCAR
- 2026-05-15 Relisted — LCAR
- 2026-05-12 Pending — LCAR
- 2026-05-10 Listed $139,900 LCAR
Property tax history
+0.8%/yrLatest (2026): $1,650 · +0.3% YoY. Source: county tax records.
Cash-flow waterfall
monthlySold comps — $/sqft
last 12 mo · ≤1 miLoading sold comps…