 Triplex
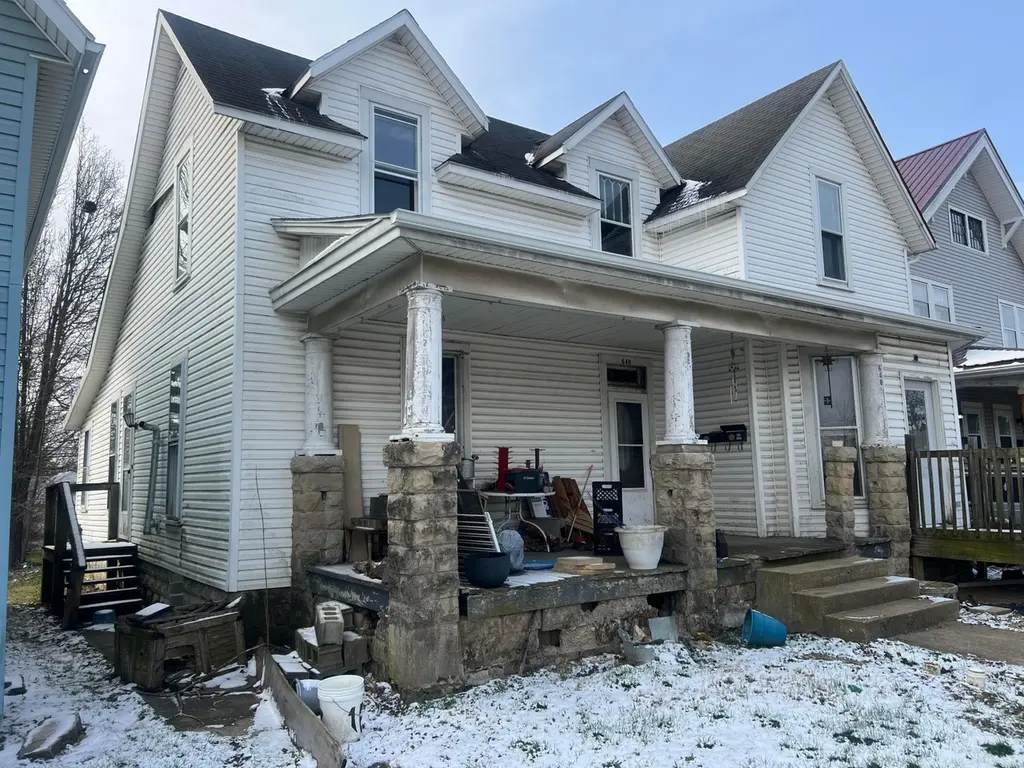
640 Jefferson St · Greenfield, OH
Flood risk 1/10 · Minimal
- FEMA flood zone
- X (unshaded)
- Chance of flooding over 30 yrs
- 0.0%
- Est. flood insurance / yr
- $473 – $860
Fire risk 1/10 · Minimal
- Est. fire insurance / yr
- $713 – $1,323
Heat risk 4/10 · Minor
- Hot days now (above 100°F)
- 7 days/yr
- Hot days in 30 yrs
- 18 days/yr
Wind risk 2/10 · Minimal
- Chance of severe wind over 30 yrs
- 1.0%
Air-quality risk 2/10 · Minimal
- Unhealthy air days now
- 1 days/yr
- Unhealthy air days in 30 yrs
- 1 days/yr
Risk factors via First Street. Map © Google.
Why this score? — see what drove the B grade
The composite is a weighted blend of 9 inputs, each scored 0–100. Each bar is that input's sub-score; the figure is the points it added to the 100-point composite (weight × sub-score).
- Cash flow +30.0/30.0
- ARV discount +11.5/15.0
- 1% rule +10.0/10.0
- DSCR +10.0/10.0
- Schools +4.7/10.0
- Livability +3.6/5.0
- Rent growth +2.5/5.0
- Condition / age +2.5/5.0
- Appreciation +0.0/10.0
$77,900
🖨 Deal sheet (PDF) 📄 Offer letter ✓ Due diligence
Multi-family units
County records classify this as Multi-Family (2-4 Unit). Listing-text estimate: 3 units. confirmed
Listing remarks MLS
Opportunity knocks in Greenfield--this 3-unit property offers immediate upside at an attractive price point. One unit is nearly rent-ready, while the other two need light cosmetic improvements, making this an ideal value-add for investors looking to build equity and cash flow quickly. Market rents support ~$600/month per unit, positioning the property for approximately $1,800/month ($21,600 annually) once stabilized. With conservative expenses, this asset has the potential to perform in the mid-to-high teens cap rate range. Low entry, strong rent potential, and a clear path to stabilization--this is a solid addition to any portfolio.
Key facts
- 6,534 sq ft lot
- Built 1920
- Listed 75 days
Neighborhood map
What this means for you Summary
Snapshot
- This is a 3 × 3-bed/1-bath units multifamily listed at $78k.
Deal economics
- At list price, monthly cash flow is $2k ($19k/yr) — positive. Per door: $518/mo.
- The deal already cash-flows at list — no discount required.
- Meets the 1% rule at list price ($3k rent vs $78k).
- Recommended offer: $73k (6.0% below list) — sets the bar for market timing.
- Cap rate 30.2% vs local median 4.0% in Greenfield — top-decile yield for the area; either an underpriced asset or a hidden risk that comps aren't pricing in. Stress-test before assuming the spread holds.
Location & tenants
- Location reads 72/100 on livability (#364 in OH) — a middle-class / working-renter tenant base. Strengths: crime A+, cost of living A+, housing A+; Watch: amenities F, commute F, employment F.
- Greenfield Exempted Village (town): math 56% / reading 56% proficiency, ranked #375 of 656 in OH (top 57%) — acceptable for families but not a draw, mixed tenant base, ~2y average lease.
- Zoned schools: Greenfield Middle School (math 53% / reading 53%, grade C+, #372 of 654 statewide, top 58%, 402 students, 59% FRL); Mcclain High School (math 42% / reading 57%, grade D, #390 of 781 statewide, top 54%, 537 students, 46% FRL) — zoned schools at 52% FRL track the district average.
- Market conditions: 28 active listings in the ZIP; 20 units permitted in Highland County in 2024 (0 in 5+ unit buildings).
- At $2,683/mo this rent would consume 53% of the median local household income ($61k/yr) — very limited rent-growth headroom before tenants either downsize or default.
Forward outlook
- Local home prices are declining (-3.0%/yr); year-one equity from $539 of loan paydown is wiped out by about $2k of value loss. Plan a longer hold.
- Highland County population projected at -21% by 2050 — secular population decline; favor cash flow + early exit over multi-decade hold.
- At projected returns (-3.0% appreciation + 3.0% rent growth), your $22k cash investment doubles in ~2 years — after that, you're playing with house money.
Negotiation context
- It's been on market 75 days — a 6% lower offer ($73k) is reasonable based on typical stale-listing flexibility.
- Current owner paid $16k; list at $78k implies a 384% gain — meaningful room to come down on a strong offer.
Risks & watch-outs
- Watch-outs: built in 1920 — expect roof / HVAC / electrical / plumbing capex.
Questions for the listing agent
- It's been on market 75 days. Have you received any prior offers? Is the seller open to a 6% concession, seller financing, or rate buy-down credit?
- Can we see the unit-by-unit rent roll, current vacancy, and any below-market leases? What's the average tenancy length?
- What capital expenditures (roof, boiler, parking lot, exteriors) have been made in the last 5 years, and what's planned in the next 2?
- Built in 1920 — when were the roof, HVAC, electrical panel, plumbing, and water heater last replaced?
- Why hasn't it sold? Are there any deal-killer items the seller is aware of (foundation, flood, title, zoning, code violations)?
- Is there a deadline driving the sale (1031 exchange, divorce, estate, relocation)? That informs how much negotiation room exists.
- What's the average days-on-market for RENTAL listings here right now (not sales)? A rising rental-DOM trend means longer vacancies and softer asking-rent achievability than the comps imply.
- What's the recent tenant-quality profile in this submarket — average credit score on applications, eviction rate, late-payment / NSF rate, and stable-employment percentage? A property-management company in the area should have these aggregated.
- How much new apartment / multifamily construction is in the pipeline within 1–3 miles? Heavy new supply (>2% of stock underway) typically softens rents 12–24 months out; light construction supports rent growth.
Investment metrics
- 1% rule
- 3.44% ✓
- Cap rate
- 30.23%
- Cash-on-cash
- 85.50%
- DSCR
- 4.80
- GRM
- 2.4
CMA / ARV
- ARV (median comp)
- $85,431
- List price
- $77,900
- Delta
- -8.82%
- Verdict
- FAIR
- Comps
- 4 within 1.0 mi
Projected returns pro-forma
-3.0% appreciation · 3.0% rent growth · sell at horizon
- IRR
- 86.0%
- Equity multiple
- 4.96×
- Total profit
- $86,414
- Equity at exit
- $11,615
- IRR
- 89.1%
- Equity multiple
- 10.30×
- Total profit
- $202,932
- Equity at exit
- $6,735
Cash invested: $21,812 (down + closing). Projections, not guarantees.
Landlord ↔ Tenant lean methodology
- Overall (STATE)
- 73 Landlord-Friendly
- State Ohio
- 73 Landlord-Friendly · R+6
- County
- — inherits STATE
- City
- — inherits STATE
ZIP-level market 45123
- Home prices YoY
- -15.3%
- Active inventory
- 28
- Price-to-rent
- 7.3×
Monthly cashflow live
- Estimated rent
- $2,683 medium interval (Pro) →
- Mortgage (P&I)
- −$409
- Tax from tax record
- −$125 /mo · $1,494/yr
- Insurance
- −$32
- HOA
- −$0
- Lot rent
- −$0
- Vacancy / Maint / Mgmt
- −$563
- Net cashflow
- $1,554
Break-even live
Sensitivity live
| Price | -10% $1,598 | -5% $1,576 | +0% $1,554 | +5% $1,532 | +10% $1,510 |
|---|---|---|---|---|---|
| Rent | -10% $1,342 | -5% $1,448 | +0% $1,554 | +5% $1,660 | +10% $1,766 |
| Rate | -1.0pp $1,593 | -0.5pp $1,574 | base $1,554 | +0.5pp $1,534 | +1.0pp $1,513 |
3-unit breakdown (identical units grouped — click to expand)
| Units | Beds | Baths | Est. rent |
|---|---|---|---|
| 3× units | 3 | 1 | $2,682 |
| #1 | 3 | 1 | $894 |
| #2 | 3 | 1 | $894 |
| #3 | 3 | 1 | $894 |
| Total (3 units) | $2,683 | ||
UW: 25.0% down · 7.5% · 30yr · 1.5% tax · 5.0% vac · 8.0% maint · 8.0% mgmt
Financing live
Cash to close
- Down payment
- $19,475
- Closing costs
- $2,337
- Reserves months
- —
- Total cash needed
- —
Loan-product check · same deal, 3 products live
Conventional
25% down · 7.5% · 30yr
- Down + closing
- —
- Monthly P&I
- —
- Monthly cashflow
- —
- DSCR
- —
- Eligible?
- —
Personal DTI + credit; lowest rate.
DSCR
20% down · 8.5% · 30yr
- Down + closing
- —
- Monthly P&I
- —
- Monthly cashflow
- —
- DSCR
- —
- Eligible?
- —
No personal income docs; deal must DSCR.
Hard money
10% down · 12.0% · 12mo
- Down + closing
- —
- Monthly P&I
- —
- Monthly cashflow
- —
- DSCR
- —
- Eligible?
- —
Short-term bridge; refi at stabilization.
Listing history 20 events
-
2026-06-22days on market $77,900 Active 75 DOM
-
2026-06-21days on market $77,900 Active 74 DOM
-
2026-06-21days on market $77,900 Active 73 DOM
-
2026-06-18days on market $77,900 Active 71 DOM
-
2026-06-17days on market $77,900 Active 70 DOM
-
2026-06-16days on market $77,900 Active 69 DOM
-
2026-06-15days on market $77,900 Active 68 DOM
-
2026-06-13days on market $77,900 Active 66 DOM
-
2026-06-12days on market $77,900 Active 65 DOM
-
2026-06-09days on market $77,900 Active 62 DOM
-
2026-06-08days on market $77,900 Active 61 DOM
-
2026-06-08days on market $77,900 Active 60 DOM
-
2026-06-07days on market $77,900 Active 59 DOM
-
2026-06-04days on market $77,900 Active 56 DOM
-
2026-06-02days on market $77,900 Active 55 DOM
-
2026-06-01days on market $77,900 Active 54 DOM
-
2026-05-31days on market $77,900 Active 53 DOM
-
2026-04-29price $77,900 641-char remark
Show marketing remark (641 chars)
Opportunity knocks in Greenfield--this 3-unit property offers immediate upside at an attractive price point. One unit is nearly rent-ready, while the other two need light cosmetic improvements, making this an ideal value-add for investors looking to build equity and cash flow quickly. Market rents support ~$600/month per unit, positioning the property for approximately $1,800/month ($21,600 annually) once stabilized. With conservative expenses, this asset has the potential to perform in the mid-to-high teens cap rate range. Low entry, strong rent potential, and a clear path to stabilization--this is a solid addition to any portfolio.
-
2026-04-08$79,900 Active 641-char remark
Show marketing remark (641 chars)
Opportunity knocks in Greenfield--this 3-unit property offers immediate upside at an attractive price point. One unit is nearly rent-ready, while the other two need light cosmetic improvements, making this an ideal value-add for investors looking to build equity and cash flow quickly. Market rents support ~$600/month per unit, positioning the property for approximately $1,800/month ($21,600 annually) once stabilized. With conservative expenses, this asset has the potential to perform in the mid-to-high teens cap rate range. Low entry, strong rent potential, and a clear path to stabilization--this is a solid addition to any portfolio.
-
1985-06-07soldstatus $16,100
ⓘ Source: listings_history table (triggers on properties + properties_extension) + one-shot
backfill from property_details.listing_events for pre-trigger history.
Tax reassessment forecast OH · Partial reset (capped growth)
- Current annual tax
- $1,494 · $125/mo
- Projected year-2 tax
- $1,494 · $125/mo
- Expected delta
- $0/yr ($0/mo · 0.0%)
ⓘ Screening estimate from a state-policy table — verify with the county assessor before closing.
Climate risk First Street
- Flood 1/10 Low FEMA zone X (unshaded) · 0% chance over 30 yrs
- Wildfire 1/10 Low
- Heat 4/10 Moderate 7 d/yr ≥100°F today · 18 d/yr by 30 yrs out
- Wind 2/10 Low 100% chance of damaging wind over 30 yrs
- Air quality 2/10 Low 1 unhealthy d/yr today · 1 by 30 yrs out
Nearby sold comps map
Loading sold comps map…
Walkable amenities ~0.75 mi
Loading nearby amenities…
Taxation est. · year 1
- Rental income
- $32,196
- − Mortgage interest
- −$4,364
- − Property taxes
- −$1,494
- − Insurance
- −$390
- − Repairs & maintenance
- −$2,576
- − Management
- −$2,576
- − Depreciation
- −$2,266
- Taxable income
- $18,531
- Est. tax owed @ 24.0%
- −$4,447
- After-tax cash flow
- $14,201/yr
For passive investors: Depreciation is non-cash, so a rental often shows a tax loss while cash-flowing — sheltering income. Rental losses are passive: they offset passive income freely, and up to $25,000/yr can offset ordinary (W-2) income if you actively participate and your MAGI is under $100k (phasing out to $0 by $150k); unused losses carry forward. On sale, claimed depreciation is recaptured at up to 25%, and gains may owe capital-gains tax (a 1031 exchange can defer both). Figures are a year-1 estimate at your 24.0% rate — not tax advice; consult a CPA.
Schools (NCES district)
- District
- Greenfield Exempted Village
- NCES district ID
- 3904540
- Math proficiency
- 56% ▼ -4.00%
- Reading proficiency
- 56% ▼ -10.00%
- Median HH income
- $38,037
- Composite
- 46.62/100
- National rank
- #2411
- State rank
- #375 of 656 in OH
Livability — Greenfield
- Score
- 72/100
- State rank
- #364
- US rank
- #5881
Category grades
Schools grade is shown separately in the Schools card above.
Census & demographics
- Census place
- Greenfield, OH
- County
- Highland · 42,279 people
- City population
- 8,739
- Population (ZIP)
- 8,739
- Household income
- $60,614
- Rent vs Own
- Severe rent burden
- 6.1
Population outlook (Highland County) Hauer SSP2
- Today (2025)
- 41,165 people
- By 2030
- 39,726 · -3.5%
- By 2040
- 36,377 · -11.6%
- By 2050
- 32,572 · -20.9%
- By 2075
- 23,690 · -42.5%
- By 2100
- 16,220 · -60.6%
Race, ethnicity, and origin ACS 2023
- Neighborhood character
- Predominantly White (92%)
- Race & ethnicity
- White 92% Two or more races 5% Black 2% Hispanic / Latino 1%
- Common ancestry
- Slovak 3% Italian 2% Iranian 1%
- Foreign-born
- 0%
- Languages at home
- 99% English-only · Spanish 1%
Political lean MEDSL · Highland
- 2024 margin
- Solid R (+63.4) · D 18.1% · R 81.4%
- 2008→2024 swing
- -37.0pp toward R · 2008: -26.3pp · 2024: -63.4pp
- All cycles
- 2024: R+63.4 2020: R+60.4 2016: R+56.1 2012: R+30.7 2008: R+26.3
Not yet ingested
- Civics
- —
Market trends
- HPI YoY
- ▼ -52.72%
- Current HPI
- 291.4543
- Rent YoY
- —
- Metro
- —
- State GDP YoY
- ▲ 1.98%
- F500 in state
- 48
Industry mix (Fortune 500 HQ in OH)
| Industry | F500 HQs | Revenue |
|---|---|---|
| Insurance | 3 | $145B |
|
||
| Industrial Machinery | 3 | $49B |
|
||
| Financial Services | 3 | $24B |
|
||
| Consumer Goods | 2 | $93B |
|
||
| Aerospace / Defense | 2 | $47B |
|
||
| Utilities | 2 | $33B |
|
||
Price history
+383.9% since first listed3 events — show timeline
- 2026-04-29 Price Changed $77,900 CBRMLS
- 2026-04-08 Listed $79,900 CBRMLS
- 1985-06-07 Sold (Public Records) $16,100 Public Records
Property tax history
+2.6%/yrLatest (2025): $1,494 · +0.0% YoY. Source: county tax records.
Cash-flow waterfall
monthlySold comps — $/sqft
last 12 mo · ≤1 miLoading sold comps…