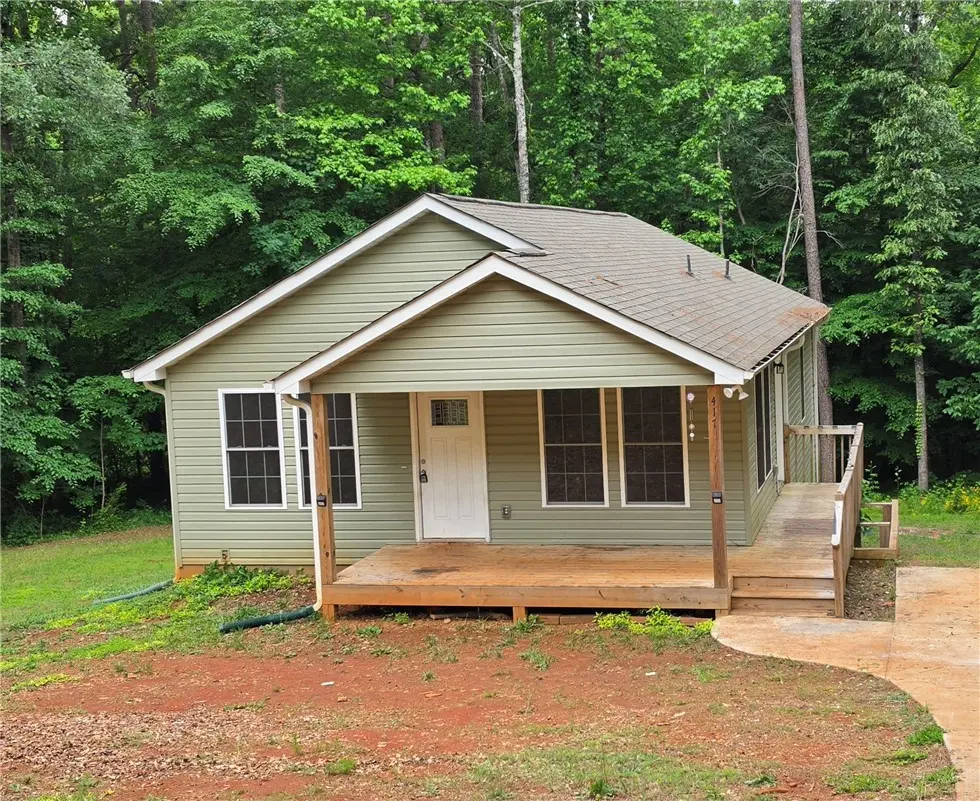
417 Forest Acres Cir · Walhalla, SC
Flood risk 1/10 · Minimal
- FEMA flood zone
- X (unshaded)
- Chance of flooding over 30 yrs
- 0.0%
- Est. flood insurance / yr
- $507 – $1,088
Fire risk 5/10 · Moderate
- Est. fire insurance / yr
- $783 – $1,453
Heat risk 5/10 · Moderate
- Hot days now (above 103°F)
- 7 days/yr
- Hot days in 30 yrs
- 18 days/yr
Wind risk 2/10 · Minimal
- Chance of severe wind over 30 yrs
- 0.0%
Air-quality risk 3/10 · Minor
- Unhealthy air days now
- 2 days/yr
- Unhealthy air days in 30 yrs
- 4 days/yr
Risk factors via First Street. Map © Google.
Why this score? — see what drove the D- grade
The composite is a weighted blend of 9 inputs, each scored 0–100. Each bar is that input's sub-score; the figure is the points it added to the 100-point composite (weight × sub-score).
- Cash flow +12.8/30.0
- ARV discount +7.2/15.0
- DSCR +3.8/10.0
- Schools +3.7/10.0
- 1% rule +3.6/10.0
- Livability +3.2/5.0
- Rent growth +2.5/5.0
- Condition / age +2.5/5.0
- Appreciation +0.0/10.0
$219,900
🖨 Deal sheet (PDF) 📄 Offer letter ✓ Due diligence
Listing remarks
* * HIGHEST AND BEST DEADLINE 5/28 @ 4:00PM * * Affordable housing opportunity in the Forest Acres subdivision of Walhalla! This property offers great potential for investors or buyers looking to personalize a home and build equity. Features include a fully unfinished basement with endless possibilities for additional living space, storage, workshop area, or future expansion. Conveniently located near local schools, shopping, and outdoor recreation. Foreclosure property being sold strictly as-is. Seller makes no representations or warranties. Buyer to verify all information deemed important.
Key facts
- Outdoor recreation
- Local schools
- 0.92 acre lot
Tags
Property features AI
Exterior
- Parking: Driveway
- Utilities: Public water; Septic tank
- Home design: 2 stories; Built within last 1–5 years; Basement foundation
- Construction: Vinyl siding; Architectural shingle roof
- Exterior features: Front porch; Porch; Patio; Walk-out basement access; Outside city limits; Subdivision
Interior
- Kitchen: Granite counters; Electric oven; Electric range; Microwave; Dishwasher; Refrigerator
- Bedrooms: 3 main level bedrooms
- Flooring: Ceramic tile; Luxury vinyl plank
- Bathrooms: 2 full bathrooms; 2 main level bathrooms
- Heating & cooling: Heat pump heating; Heat pump cooling
- Interior features: Cathedral ceilings; High ceilings; Smooth ceilings; Granite counters; Bath in primary bedroom; Shower only; Walk-in shower; Walk-in closet(s); Low threshold shower; Vinyl window frames
- Laundry & utility: Washer hookup; Electric dryer hookup; Washer; Dryer; Electric water heater
Neighborhood map
What this means for you Summary
Snapshot
- This is a 3-bed/2.0-bath single-family listed at $220k.
Deal economics
- At list price, monthly cash flow is $-19 ($-234/yr) — negative.
- To cash-flow at today's rent, offer at most $216k (1.6% below list).
- To meet the 1% rule (rent ≥ 1% of price), the offer needs to be $188k (14.5% below list).
- Recommended offer: $188k (14.5% below list) — sets the bar for 1% rule.
- Cap rate 6.2% vs local median 3.7% in Walhalla — top-decile yield for the area; either an underpriced asset or a hidden risk that comps aren't pricing in. Stress-test before assuming the spread holds.
Location & tenants
- Location reads 63/100 on livability (#171 in SC) — a middle-class / working-renter tenant base. Strengths: cost of living A+, housing A-, crime B+; Watch: amenities F, commute F, employment F.
- Oconee 01 (rural): math 41% / reading 47% proficiency, ranked #27 of 80 in SC (top 34%) — families likely to look elsewhere, expect single-tenant / working-renter base with shorter leases.
- Zoned schools: Walhalla Elementary (math 54% / reading 46%, grade D+, #163 of 597 statewide, top 28%, 595 students, 73% FRL); Walhalla Middle (math 44% / reading 47%, grade D+, #46 of 229 statewide, top 20%, 845 students, 68% FRL); Walhalla High (math 57% / reading 87%, grade B+, #48 of 196 statewide, top 26%, 1,139 students, 62% FRL) — zoned schools average 68% FRL vs 50% district-wide (18 pts higher); higher-poverty schools than district average — tighter screening recommended.
- Market conditions: 86 active listings in the ZIP; 648 units permitted in Oconee County in 2024 (40 in 5+ unit buildings).
Forward outlook
- Local home prices are declining (-3.0%/yr); year-one equity from $2k of loan paydown is wiped out by about $7k of value loss. Plan a longer hold.
Negotiation context
- It's been on market 21 days — a 2% lower offer ($217k) is reasonable based on typical stale-listing flexibility.
Risks & watch-outs
- Climate carrying-cost: moderate wildfire risk; extreme-heat days projected 7→18/yr by 2055 (HVAC capex compounding) — expect insurance premiums to compound above CPI over the hold.
Questions for the listing agent
- What do current leases actually rent for vs. the listed asking? Can we see a recent rent roll and the last 12 months of T-12 income?
- Is there a deadline driving the sale (1031 exchange, divorce, estate, relocation)? That informs how much negotiation room exists.
- Schools are D-rated, which usually means shorter tenancies and higher turnover. Who's the typical renter profile here, and what's been the actual vacancy rate?
- The area grade is low — what's the realistic commute time and amenity access for the typical tenant pool here? Any planned neighborhood developments (good or bad) we should know about?
- What's the average days-on-market for RENTAL listings here right now (not sales)? A rising rental-DOM trend means longer vacancies and softer asking-rent achievability than the comps imply.
- What's the recent tenant-quality profile in this submarket — average credit score on applications, eviction rate, late-payment / NSF rate, and stable-employment percentage? A property-management company in the area should have these aggregated.
- How much new for-sale + rental construction is in the pipeline within 1–3 miles? Heavy new supply typically softens prices + rents 12–24 months out; constrained supply supports both.
Investment metrics
- 1% rule
- 0.86% ✗
- Cap rate
- 6.19%
- Cash-on-cash
- -0.38%
- DSCR
- 0.98
- GRM
- 9.7
CMA / ARV
- ARV (on-the-fly)
- $218,400
- Comps found
- 1
Show comp detail 1 sale within ~0.75 mi
| Address | Dist | Beds/Ba | Sqft | Sold | Price | $/sf | Match |
|---|---|---|---|---|---|---|---|
| 515 Hillside Dr | 0.25mi | 3/1.5 | 1,181 (+14%) | 9mo | $247,500 | $210 | 56 |
Match score weights: distance 35% · size 25% · config 20% · recency 20%. Top-matched comps best support the ARV.
Projected returns pro-forma
-3.0% appreciation · 3.0% rent growth · sell at horizon
- IRR
- -16.9%
- Equity multiple
- 0.40×
- Total profit
- $-36,856
- Equity at exit
- $32,788
- IRR
- -8.8%
- Equity multiple
- 0.45×
- Total profit
- $-33,614
- Equity at exit
- $19,013
Cash invested: $61,572 (down + closing). Projections, not guarantees.
Landlord ↔ Tenant lean methodology
- Overall (STATE)
- 90 Strongly Landlord-Friendly
- State South Carolina
- 90 Strongly Landlord-Friendly · R+6
- County
- — inherits STATE
- City
- — inherits STATE
ZIP-level market 29691
- Home prices YoY
- -27.8%
- Active inventory
- 86
- Price-to-rent
- 9.7×
Monthly cashflow live
- Estimated rent
- $1,880 medium interval (Pro) →
- Mortgage (P&I)
- −$1,153
- Tax from tax record
- −$260 /mo · $3,120/yr
- Insurance
- −$92
- HOA
- −$0
- Vacancy / Maint / Mgmt
- −$395
- Net cashflow
- $-19
Break-even live
Sensitivity live
| Price | -10% $105 | -5% $43 | +0% $-19 | +5% $-82 | +10% $-144 |
|---|---|---|---|---|---|
| Rent | -10% $-168 | -5% $-94 | +0% $-19 | +5% $55 | +10% $129 |
| Rate | -1.0pp $91 | -0.5pp $36 | base $-19 | +0.5pp $-76 | +1.0pp $-134 |
UW: 25.0% down · 7.5% · 30yr · 1.5% tax · 5.0% vac · 8.0% maint · 8.0% mgmt
Financing live
Cash to close
- Down payment
- $54,975
- Closing costs
- $6,597
- Reserves months
- —
- Total cash needed
- —
Loan-product check · same deal, 3 products live
Conventional
25% down · 7.5% · 30yr
- Down + closing
- —
- Monthly P&I
- —
- Monthly cashflow
- —
- DSCR
- —
- Eligible?
- —
Personal DTI + credit; lowest rate.
DSCR
20% down · 8.5% · 30yr
- Down + closing
- —
- Monthly P&I
- —
- Monthly cashflow
- —
- DSCR
- —
- Eligible?
- —
No personal income docs; deal must DSCR.
Hard money
10% down · 12.0% · 12mo
- Down + closing
- —
- Monthly P&I
- —
- Monthly cashflow
- —
- DSCR
- —
- Eligible?
- —
Short-term bridge; refi at stabilization.
Listing history 12 events
-
2026-06-18status $219,900 Pending 21 DOM
-
2026-06-18days on market $219,900 Active 21 DOM
-
2026-06-10days on market $219,900 Active 19 DOM
-
2026-06-09days on market $219,900 Active 18 DOM
-
2026-06-08days on market $219,900 Active 17 DOM
-
2026-06-07days on market $219,900 Active 16 DOM
-
2026-06-05days on market $219,900 Active 13 DOM
-
2026-06-03days on market $219,900 Active 12 DOM
-
2026-06-03days on market $219,900 Active 11 DOM
-
2026-06-01days on market $219,900 Active 10 DOM
-
2026-05-31days on market $219,900 Active 9 DOM
-
2026-05-22$219,900 Active
ⓘ Source: listings_history table (triggers on properties + properties_extension) + one-shot
backfill from property_details.listing_events for pre-trigger history.
Tax reassessment forecast SC · Resets to sale price
- Current annual tax
- $3,120 · $260/mo
- Projected year-2 tax
- $3,120 · $260/mo
- Expected delta
- $0/yr ($0/mo · 0.0%)
ⓘ Screening estimate from a state-policy table — verify with the county assessor before closing.
Climate risk First Street
- Flood 1/10 Low FEMA zone X (unshaded) · 0% chance over 30 yrs
- Wildfire 5/10 Major
- Heat 5/10 Major 7 d/yr ≥103°F today · 18 d/yr by 30 yrs out
- Wind 2/10 Low 0% chance of damaging wind over 30 yrs
- Air quality 3/10 Moderate 2 unhealthy d/yr today · 4 by 30 yrs out
Nearby sold comps map
Loading sold comps map…
Walkable amenities ~0.75 mi
Loading nearby amenities…
Taxation est. · year 1
- Rental income
- $22,562
- − Mortgage interest
- −$12,318
- − Property taxes
- −$3,120
- − Insurance
- −$1,100
- − Repairs & maintenance
- −$1,805
- − Management
- −$1,805
- − Depreciation
- −$6,397
- Taxable loss
- −$3,983
- Est. tax savings @ 24.0%
- +$956
- After-tax cash flow
- $722/yr
For passive investors: Depreciation is non-cash, so a rental often shows a tax loss while cash-flowing — sheltering income. Rental losses are passive: they offset passive income freely, and up to $25,000/yr can offset ordinary (W-2) income if you actively participate and your MAGI is under $100k (phasing out to $0 by $150k); unused losses carry forward. On sale, claimed depreciation is recaptured at up to 25%, and gains may owe capital-gains tax (a 1031 exchange can defer both). Figures are a year-1 estimate at your 24.0% rate — not tax advice; consult a CPA.
Schools (NCES district)
- District
- Oconee 01
- NCES district ID
- 4503060
- Math proficiency
- 41% ▼ -7.00%
- Reading proficiency
- 47% ▼ -1.00%
- Median HH income
- $42,074
- Composite
- 37.03/100
- National rank
- #4516
- State rank
- #27 of 80 in SC
Livability — Walhalla
- Score
- 63/100
- State rank
- #171
- US rank
- #15277
Category grades
Schools grade is shown separately in the Schools card above.
Census & demographics
- Population (ZIP)
- 12,248
Population outlook (Oconee County) Hauer SSP2
- Today (2025)
- 77,950 people
- By 2030
- 78,551 · +0.8%
- By 2040
- 78,628 · +0.9%
- By 2050
- 77,052 · -1.2%
- By 2075
- 71,098 · -8.8%
- By 2100
- 61,216 · -21.5%
Race, ethnicity, and origin ACS 2023
- Neighborhood character
- Predominantly White (76%)
- Race & ethnicity
- White 76% Hispanic / Latino 16% Two or more races 10% Black 2%
- Hispanic origin (detail)
- Mexican 9%
- Common ancestry
- Romanian 2% Italian 2% Slovak 2%
- Foreign-born
- 10% · Canada
- Languages at home
- 86% English-only · Spanish 14%
Political lean MEDSL · Oconee
- 2024 margin
- Solid R (+51.5) · D 23.6% · R 75.2% · Other 1.2%
- 2008→2024 swing
- -14.0pp toward R · 2008: -37.5pp · 2024: -51.5pp
- All cycles
- 2024: R+51.5 2020: R+47.4 2016: R+48.1 2012: R+42.6 2008: R+37.5
Not yet ingested
- Civics
- —
Market trends
- HPI YoY
- ▼ -80.05%
- Current HPI
- 207.8251
- Rent YoY
- —
- Metro
- —
- State GDP YoY
- ▲ 4.51%
- F500 in state
- 2
Industry mix (Fortune 500 HQ in SC)
| Industry | F500 HQs | Revenue |
|---|---|---|
| Packaging | 1 | $7B |
|
||
Price history
1 event — show timeline
- 2026-05-22 Listed $219,900 WUMLS
Property tax history
+60.2%/yrLatest (2025): $3,120 · +0.0% YoY. Source: county tax records.
Cash-flow waterfall
monthlySold comps — $/sqft
last 12 mo · ≤1 miLoading sold comps…