None · Fremont, CA
Flood risk 4/10 · Minor
- FEMA flood zone
- X (shaded)
- Chance of flooding over 30 yrs
- 0.24%
- Est. flood insurance / yr
- $507 – $1,088
Fire risk 1/10 · Minimal
- Est. fire insurance / yr
- $659 – $1,223
Heat risk 4/10 · Minor
- Hot days now (above 90°F)
- 7 days/yr
- Hot days in 30 yrs
- 14 days/yr
Wind risk 1/10 · Minimal
- Chance of severe wind over 30 yrs
- —
Air-quality risk 8/10 · Major
- Unhealthy air days now
- 13 days/yr
- Unhealthy air days in 30 yrs
- 13 days/yr
Risk factors via First Street. Map © Google.
Why this score? — see what drove the B grade
The composite is a weighted blend of 9 inputs, each scored 0–100. Each bar is that input's sub-score; the figure is the points it added to the 100-point composite (weight × sub-score).
- Cash flow +30.0/30.0
- 1% rule +10.0/10.0
- DSCR +10.0/10.0
- Schools +7.3/10.0
- ARV discount +7.1/15.0
- Livability +4.2/5.0
- Rent growth +3.3/5.0
- Condition / age +2.5/5.0
- Appreciation +0.0/10.0
$166,888
🖨 Deal sheet 📄 Offer letter ✓ Due diligence
Listing remarks MLS
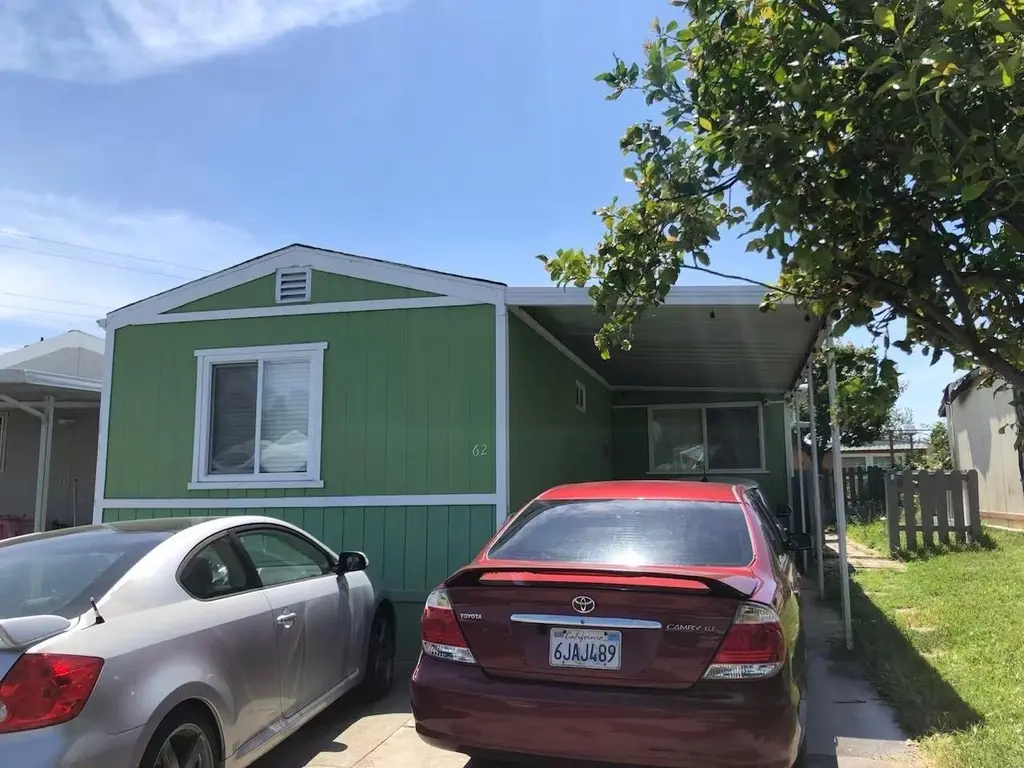
Charming and well-maintained 2-bedroom, 1-bathroom mobile home offering approximately 728 sq ft of comfortable living space. Functional floor plan with bright living area, practical kitchen layout, and two well-sized bedrooms. Home includes an enclosed former screen room currently configured with additional improvements. Buyers to verify permits, square footage, and condition to their satisfaction. Convenient Fremont location near shopping, dining, major freeways, and public transportation. Affordable opportunity to own in a desirable Bay Area community.
Key facts
- Community pool
- Listed 127 days
Neighborhood map
What this means for you Summary
Snapshot
- This is a 2-bed/1.0-bath manufactured listed at $167k.
Deal economics
- At list price, monthly cash flow is $1k ($18k/yr) — positive.
- The deal already cash-flows at list — no discount required.
- Meets the 1% rule at list price ($3k rent vs $167k).
- Recommended offer: $147k (12.0% below list) — sets the bar for market timing.
- Cap rate 17.0% vs local median 1.2% in Fremont — top-decile yield for the area; either an underpriced asset or a hidden risk that comps aren't pricing in. Stress-test before assuming the spread holds.
Location & tenants
- Location reads 85/100 on livability (#10 in CA, #561 nationally) — a professional / high-income tenant draw. Strengths: schools A+, amenities A+, commute A+; Watch: cost of living F.
- Fremont Unified (suburban): math 76% / reading 84% proficiency, ranked #23 of 517 in CA (top 4%) — strong family-tenant draw, lease renewals of 3-5y typical; only 15% free/reduced lunch — higher-income household profile.
- Market conditions: Rents rising (+3.3%/yr); 144 active listings in the ZIP; 7 comparable units currently listed for rent nearby; rentals leasing fast (median 13d on market — plan ~1-2 weeks tenant-placement turnaround); high-income renter base; 1,742 units permitted in Alameda County in 2024 (856 in 5+ unit buildings).
Forward outlook
- Local home prices are declining (-3.0%/yr); year-one equity from $1k of loan paydown is wiped out by about $5k of value loss. Plan a longer hold.
- Alameda County population projected at +34% by 2050 — long-run rental-demand tailwind backs the buy-and-hold thesis.
- At projected returns (-3.0% appreciation + 3.3% rent growth), your $47k cash investment doubles in ~4 years — after that, you're playing with house money.
Negotiation context
- It's been on market 127 days — a 12% lower offer ($147k) is reasonable based on typical stale-listing flexibility.
Questions for the listing agent
- It's been on market 127 days. Have you received any prior offers? Is the seller open to a 12% concession, seller financing, or rate buy-down credit?
- Why hasn't it sold? Are there any deal-killer items the seller is aware of (foundation, flood, title, zoning, code violations)?
- Is there a deadline driving the sale (1031 exchange, divorce, estate, relocation)? That informs how much negotiation room exists.
- Schools are A-rated — typically a magnet for longer-tenancy family renters. What's the average tenant stay here, and is there a school-zone premium baked into asking?
- What's the average days-on-market for RENTAL listings here right now (not sales)? A rising rental-DOM trend means longer vacancies and softer asking-rent achievability than the comps imply.
- What's the recent tenant-quality profile in this submarket — average credit score on applications, eviction rate, late-payment / NSF rate, and stable-employment percentage? A property-management company in the area should have these aggregated.
- How much new for-sale + rental construction is in the pipeline within 1–3 miles? Heavy new supply typically softens prices + rents 12–24 months out; constrained supply supports both.
Investment metrics
- 1% rule
- 2.00% ✓
- Cap rate
- 16.95%
- Cash-on-cash
- 38.07%
- DSCR
- 2.69
- GRM
- 4.2
CMA / ARV
- ARV (median comp)
- $165,515
- List price
- $166,888
- Delta
- 0.83%
- Verdict
- FAIR
- Comps
- 1 within 2.0 mi
Show comp detail 3 sales within ~0.75 mi
| Address | Dist | Beds/Ba | Sqft | Sold | Price | $/sf | Match |
|---|---|---|---|---|---|---|---|
| 208 Manitoba Ter | 0.30mi | 2/1.5 | 720 (-1%) | 7mo | $168,000 | $233 | 76 |
| 21 Eagle Ter | 0.11mi | 2/1.0 | 672 (-8%) | 14mo | $158,000 | $235 | 70 |
| 277 Winnipeg Ter | 0.37mi | 2/1.0 | 720 (-1%) | 18mo | $147,500 | $205 | 66 |
Match score weights: distance 35% · size 25% · config 20% · recency 20%. Top-matched comps best support the ARV.
Projected returns pro-forma
-3.0% appreciation · 3.33% rent growth · sell at horizon
- IRR
- 34.5%
- Equity multiple
- 2.47×
- Total profit
- $68,527
- Equity at exit
- $24,884
- IRR
- 41.5%
- Equity multiple
- 4.98×
- Total profit
- $186,034
- Equity at exit
- $14,429
Cash invested: $46,729 (down + closing). Projections, not guarantees.
Landlord ↔ Tenant lean methodology
- Overall (STATE)
- 18 Strongly Tenant-Friendly
- State California
- 18 Strongly Tenant-Friendly · D+13
- County
- — inherits STATE
- City
- — inherits STATE
ZIP-level market 94538
- Rents YoY
- 3.3%
- Active inventory
- 144
- Price-to-rent
- 4.2×
Monthly cashflow live
- Estimated rent
- $3,336 high interval (Pro) →
- Mortgage (P&I)
- −$875
- Tax est. 1.5%
- −$209 /mo · $2,503/yr
- Insurance
- −$70
- HOA
- −$0
- Vacancy / Maint / Mgmt
- −$701
- Net cashflow
- $1,482
Break-even live
UW: 25.0% down · 7.5% · 30yr · 1.5% tax · 5.0% vac · 8.0% maint · 8.0% mgmt
Financing live
Cash to close
- Down payment
- $41,722
- Closing costs
- $5,007
- Reserves months
- —
- Total cash needed
- —
Loan-product check · same deal, 3 products live
Conventional
25% down · 7.5% · 30yr
- Down + closing
- —
- Monthly P&I
- —
- Monthly cashflow
- —
- DSCR
- —
- Eligible?
- —
Personal DTI + credit; lowest rate.
DSCR
20% down · 8.5% · 30yr
- Down + closing
- —
- Monthly P&I
- —
- Monthly cashflow
- —
- DSCR
- —
- Eligible?
- —
No personal income docs; deal must DSCR.
Hard money
10% down · 12.0% · 12mo
- Down + closing
- —
- Monthly P&I
- —
- Monthly cashflow
- —
- DSCR
- —
- Eligible?
- —
Short-term bridge; refi at stabilization.
Rent comps 7 comps
| Address | Beds | Baths | Sqft | Rent | $/sqft | DOM | Units | Dist |
|---|---|---|---|---|---|---|---|---|
| 43608 Salem Way Fremont, CA | 2.0 | 2.0 | 745 | $3,251 | $4.36 | 19d | 1 | 0.82mi |
| 43416 Newport Dr Fremont, CA | 1.0 | 1.0 | 620 | $2,600 | $4.19 | 43d | 1 | 0.84mi |
| 44762 Old Warm Springs Blvd Fremont, CA | 1.0–3.0 | 1.0–2.0 | 959 | $4,164 | $4.34 | 1d | 20 | 1.06mi |
| 44758 Old Warm Springs Blvd Unit 2074 Fremont, CA | 1.0 | 1.0 | 613 | $3,170 | $5.17 | 16d | 1 | 1.08mi |
| 44758 Old Warm Springs Blvd Unit 2045 Fremont, CA | 1.0 | 1.0 | 615 | $3,180 | $5.17 | 12d | 1 | 1.11mi |
| 3301 Innovation Way Fremont, CA | 3.0 | 1.0–2.0 | 963 | $4,390 | $4.56 | 1d | 16 | 1.19mi |
| 45147 Lopes Rd Fremont, CA | 2.0 | 1.0–2.0 | 919 | $4,551 | $4.95 | 1d | 14 | 1.28mi |
Listing history 17 events
-
2026-06-18days on market $166,888 Active 127 DOM
-
2026-06-17days on market $166,888 Active 126 DOM
-
2026-06-16days on market $166,888 Active 125 DOM
-
2026-06-15days on market $166,888 Active 124 DOM
-
2026-06-13days on market $166,888 Active 122 DOM
-
2026-06-13days on market $166,888 Active 121 DOM
-
2026-06-09days on market $166,888 Active 118 DOM
-
2026-06-08days on market $166,888 Active 117 DOM
-
2026-06-07days on market $166,888 Active 116 DOM
-
2026-06-04days on market $166,888 Active 113 DOM
-
2026-06-03days on market $166,888 Active 112 DOM
-
2026-06-02days on market $166,888 Active 111 DOM
-
2026-06-01days on market $166,888 Active 110 DOM
-
2026-05-31pricedays on market $166,888 Active 109 DOM
-
2026-04-16price $169,888 562-char remark
Show marketing remark (562 chars)
Charming and well-maintained 2-bedroom, 1-bathroom mobile home offering approximately 728 sq ft of comfortable living space. Functional floor plan with bright living area, practical kitchen layout, and two well-sized bedrooms. Home includes an enclosed former screen room currently configured with additional improvements. Buyers to verify permits, square footage, and condition to their satisfaction. Convenient Fremont location near shopping, dining, major freeways, and public transportation. Affordable opportunity to own in a desirable Bay Area community.
-
2026-04-03price $175,000 562-char remark
Show marketing remark (562 chars)
Charming and well-maintained 2-bedroom, 1-bathroom mobile home offering approximately 728 sq ft of comfortable living space. Functional floor plan with bright living area, practical kitchen layout, and two well-sized bedrooms. Home includes an enclosed former screen room currently configured with additional improvements. Buyers to verify permits, square footage, and condition to their satisfaction. Convenient Fremont location near shopping, dining, major freeways, and public transportation. Affordable opportunity to own in a desirable Bay Area community.
-
2026-02-11$195,000 Active 562-char remark
Show marketing remark (562 chars)
Charming and well-maintained 2-bedroom, 1-bathroom mobile home offering approximately 728 sq ft of comfortable living space. Functional floor plan with bright living area, practical kitchen layout, and two well-sized bedrooms. Home includes an enclosed former screen room currently configured with additional improvements. Buyers to verify permits, square footage, and condition to their satisfaction. Convenient Fremont location near shopping, dining, major freeways, and public transportation. Affordable opportunity to own in a desirable Bay Area community.
ⓘ Source: listings_history table (triggers on properties + properties_extension) + one-shot
backfill from property_details.listing_events for pre-trigger history.
Climate risk First Street
- Flood 4/10 Moderate FEMA zone X (shaded) · 24% chance over 30 yrs
- Wildfire 1/10 Low
- Heat 4/10 Moderate 7 d/yr ≥90°F today · 14 d/yr by 30 yrs out
- Wind 1/10 Low
- Air quality 8/10 Severe 13 unhealthy d/yr today · 13 by 30 yrs out
Nearby sold comps map
Loading sold comps map…
Walkable amenities ~0.75 mi
Loading nearby amenities…
Taxation est. · year 1
- Rental income
- $40,035
- − Mortgage interest
- −$9,348
- − Property taxes
- −$2,503
- − Insurance
- −$834
- − Repairs & maintenance
- −$3,203
- − Management
- −$3,203
- − Depreciation
- −$4,855
- Taxable income
- $16,088
- Est. tax owed @ 24.0%
- −$3,861
- After-tax cash flow
- $13,926/yr
For passive investors: Depreciation is non-cash, so a rental often shows a tax loss while cash-flowing — sheltering income. Rental losses are passive: they offset passive income freely, and up to $25,000/yr can offset ordinary (W-2) income if you actively participate and your MAGI is under $100k (phasing out to $0 by $150k); unused losses carry forward. On sale, claimed depreciation is recaptured at up to 25%, and gains may owe capital-gains tax (a 1031 exchange can defer both). Figures are a year-1 estimate at your 24.0% rate — not tax advice; consult a CPA.
Schools (NCES district)
- District
- Fremont Unified
- NCES district ID
- 0614400
- Math proficiency
- 76% ▲ 3.00%
- Reading proficiency
- 84% ▲ 6.00%
- Median HH income
- $105,489
- Composite
- 72.94/100
- National rank
- #191
- State rank
- #23 of 517 in CA
Livability — Fremont
- Score
- 85/100
- State rank
- #10
- US rank
- #561
Category grades
Schools grade is shown separately in the Schools card above.
Census & demographics
- Census place
- Fremont, CA
- County
- Alameda County · 1,614,355 people
- City population
- 228,297
- Metro
- San Francisco-Oakland-Berkeley, CA
- Population (ZIP)
- 67,781
- Household income
- $147,301
- Rent vs Own
- Severe rent burden
- 2445.0
Population outlook (Alameda County) Hauer SSP2
- Today (2025)
- 1,928,884 people
- By 2030
- 2,069,146 · +7.3%
- By 2040
- 2,338,405 · +21.2%
- By 2050
- 2,586,608 · +34.1%
- By 2075
- 3,061,911 · +58.7%
- By 2100
- 3,234,133 · +67.7%
Race, ethnicity, and origin ACS 2023
- Neighborhood character
- Diverse neighborhood (Simpson 0.62)
- Race & ethnicity
- Asian 56% Hispanic / Latino 20% White 16% Two or more races 7% Black 3%
- Hispanic origin (detail)
- Mexican 16%
- Common ancestry
- Russian 1% Italian 1% Lithuanian 1%
- Foreign-born
- 50% · China, Canada, Vietnam
- Languages at home
- 34% English-only · Other Indo-European 21% Spanish 14% Chinese 11%
Political lean MEDSL · Alameda
- 2024 margin
- Solid D (+53.6) · D 74.6% · R 21.0% · Other 4.4%
- 2008→2024 swing
- -5.9pp toward R · 2008: 59.5pp · 2024: 53.6pp
- All cycles
- 2024: D+53.6 2020: D+62.5 2016: D+64.4 2012: D+59.8 2008: D+59.5
Not yet ingested
- Civics
- —
Market trends
- HPI YoY
- ▼ -1249.13%
- Current HPI
- 399.7533
- Rent YoY
- ▲ 3.33%
- Metro
- San Francisco-Oakland-Berkeley, CA
- State GDP YoY
- ▲ 3.21%
- F500 in state
- 116
Industry mix (Fortune 500 HQ in CA)
| Industry | F500 HQs | Revenue |
|---|---|---|
| Technology | 27 | $1,492B |
|
||
| Financial Services | 3 | $174B |
|
||
| Retail | 3 | $44B |
|
||
| Insurance | 3 | $26B |
|
||
| Media / Entertainment | 2 | $115B |
|
||
| Pharmaceuticals / Biotech | 2 | $62B |
|
||
Price history
-12.9% since first listed3 events — show timeline
- 2026-04-16 Price Changed $169,888 bridgeMLS, Bay East AOR, or Contra Costa AOR
- 2026-04-03 Price Changed $175,000 bridgeMLS, Bay East AOR, or Contra Costa AOR
- 2026-02-11 Listed $195,000 bridgeMLS, Bay East AOR, or Contra Costa AOR
Property tax history
-5.1%/yrLatest (2022): $87 · +22.7% YoY. Source: county tax records.
Cash-flow waterfall
monthlySold comps — $/sqft
last 12 mo · ≤1 miLoading sold comps…