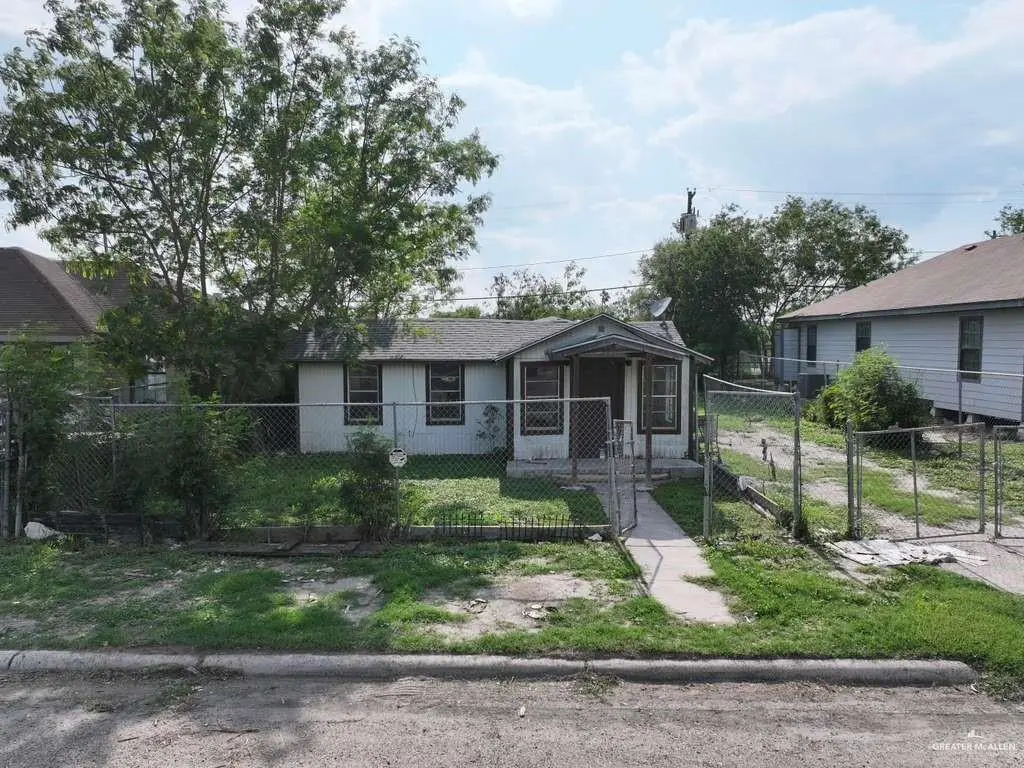
815 Extrumberto Solis Rd · Elsa, TX
Flood risk 3/10 · Minor
- FEMA flood zone
- —
- Chance of flooding over 30 yrs
- 0.2%
- Est. flood insurance / yr
- —
Fire risk 1/10 · Minimal
- Est. fire insurance / yr
- $1,222 – $2,270
Heat risk 9/10 · Severe
- Hot days now (above 111°F)
- 7 days/yr
- Hot days in 30 yrs
- 24 days/yr
Wind risk 8/10 · Major
- Chance of severe wind over 30 yrs
- 99.0%
Air-quality risk 1/10 · Minimal
- Unhealthy air days now
- 0 days/yr
- Unhealthy air days in 30 yrs
- 0 days/yr
Risk factors via First Street. Map © Google.
Why this score? — see what drove the B grade
The composite is a weighted blend of 9 inputs, each scored 0–100. Each bar is that input's sub-score; the figure is the points it added to the 100-point composite (weight × sub-score).
- Cash flow +30.0/30.0
- 1% rule +10.0/10.0
- DSCR +10.0/10.0
- ARV discount +7.5/15.0
- Appreciation +7.4/10.0
- Livability +3.3/5.0
- Rent growth +2.5/5.0
- Condition / age +2.2/5.0
- Schools +1.1/10.0
$57,500
🖨 Deal sheet (PDF) 📄 Offer letter ✓ Due diligence
Listing remarks
Great investment opportunity in the heart of Elsa! Ideally located near shopping, dining, and everyday conveniences, this property is priced to sell and offers strong potential for investors or value-driven buyers. Seller is motivated and seeking a quick closing—submit all offers!
Key facts
- 5,001 sq ft lot
- Built 1974
- Listed 45 days
Property features AI
Finance
- Other: Building area approximately 1,136 square feet; Lot size approximately 5,001 sq. ft. (0.1148 acres)
- HOA & community: No homeowners association
Exterior
- Parking: No designated parking spaces listed; Other garage or carport configuration
- Utilities: Sewer: other
- Home design: Single-family property (per property type data)
- Construction: Wood siding; Siding exterior; Shingle roof; Non-standard foundation
- Exterior features: Chain link fencing; Paved road access
Interior
- Kitchen: Water heater (type listed as other)
- Flooring: Tile
- Bathrooms: 1 full bathroom
- Interior features: Tile flooring; Window coverings; Custom or non-standard countertops
- Laundry & utility: Laundry area
Neighborhood map
What this means for you Summary
Snapshot
- This is a 3-bed/1.0-bath single-family listed at $58k. Condition is rated fair.
Deal economics
- At list price, monthly cash flow is $338 ($4k/yr) — positive.
- The deal already cash-flows at list — no discount required.
- Meets the 1% rule at list price ($931 rent vs $58k).
- Recommended offer: $56k (3.0% below list) — sets the bar for market timing.
Location & tenants
- Location reads 66/100 on livability (#648 in TX) — a middle-class / working-renter tenant base. Strengths: cost of living A+, housing A+, health & safety A+; Watch: crime D, employment D, schools F.
- Edcouch-Elsa ISD (suburban): math 9% / reading 20% proficiency, ranked #822 of 826 in TX (top 100%) — low school quality limits family demand, transient renter base, plan for 1-2y turnover; 74% free/reduced lunch — lower-income household profile, screen leases tightly.
- Market conditions: 40 active listings in the ZIP; 4 comparable units currently listed for rent nearby; rentals lingering (median 44d on market — plan ~5-8 weeks vacancy on turnover, expect pricing pressure); 100% of comp listings sitting > 30 days — soft ceiling on asking rent; 7,378 units permitted in Hidalgo County in 2024 (641 in 5+ unit buildings).
Forward outlook
- In year one you build about $3k of equity ($398 loan paydown + $3k appreciation (4.8% local appreciation)).
- Hidalgo County population projected at +28% by 2050 — long-run rental-demand tailwind backs the buy-and-hold thesis.
- At projected returns (4.8% appreciation + 3.0% rent growth), your $16k cash investment doubles in ~3 years — after that, you're playing with house money.
- By year 10, paydown + projected appreciation supports a ~$31k cash-out refi (75% LTV) — recoverable capital for the next deal without selling this one.
Negotiation context
- It's been on market 45 days — a 3% lower offer ($56k) is reasonable based on typical stale-listing flexibility.
- 3 sale attempts; this cycle's ask has dropped $5k (8%) from the opening price — seller is motivated, your offer sets the floor, not the list.
Risks & watch-outs
- Climate carrying-cost: severe wind risk, 99% chance of damaging wind over 30y; extreme-heat days projected 7→24/yr by 2055 (HVAC capex compounding) — expect insurance premiums to compound above CPI over the hold.
Questions for the listing agent
- It's been on market 45 days. Have you received any prior offers? Is the seller open to a 3% concession, seller financing, or rate buy-down credit?
- Have any recent inspections been done? Can we get a copy of the seller's disclosures and any deferred-maintenance estimates?
- Built in 1974 — when were the roof, HVAC, electrical panel, plumbing, and water heater last replaced?
- Is there a deadline driving the sale (1031 exchange, divorce, estate, relocation)? That informs how much negotiation room exists.
- Schools are F-rated, which usually means shorter tenancies and higher turnover. Who's the typical renter profile here, and what's been the actual vacancy rate?
- Crime grade is D in this area — have there been break-ins, vandalism, or insurance claims at this property in the last 3 years? What carrier currently insures it and at what premium?
- What's the average days-on-market for RENTAL listings here right now (not sales)? A rising rental-DOM trend means longer vacancies and softer asking-rent achievability than the comps imply.
- What's the recent tenant-quality profile in this submarket — average credit score on applications, eviction rate, late-payment / NSF rate, and stable-employment percentage? A property-management company in the area should have these aggregated.
- How much new for-sale + rental construction is in the pipeline within 1–3 miles? Heavy new supply typically softens prices + rents 12–24 months out; constrained supply supports both.
Investment metrics
- 1% rule
- 1.62% ✓
- Cap rate
- 13.34%
- Cash-on-cash
- 25.18%
- DSCR
- 2.12
- GRM
- 5.1
CMA / ARV
- ARV (median comp)
- $133,589
- List price
- $57,500
- Delta
- -56.96%
- Verdict
- UNDERPRICED
- Comps
- 20 within 1.0 mi
Show comp detail 6 sales within ~0.75 mi
| Address | Dist | Beds/Ba | Sqft | Sold | Price | $/sf | Match |
|---|---|---|---|---|---|---|---|
| 415 W Ciro Caceres St | 0.34mi | 3/1.5 | 1,180 (+4%) | 8mo | $110,000 | $93 | 69 |
| 500 E Vfw St | 0.46mi | 3/1.0 | 1,181 (+4%) | 4mo | $99,000 | $84 | 68 |
| 162 Valle Vista Dr | 0.24mi | 3/2.0 | 1,267 (+12%) | 3mo | $170,000 | $134 | 63 |
| 420 Vfw Ave | 0.50mi | 3/1.0 | 1,305 (+15%) | 9mo | $110,000 | $84 | 45 |
| 329 Gladiola Dr | 0.41mi | 3/2.0 | 1,239 (+9%) | 21mo | $185,000 | $149 | 44 |
| 202 Laureles Dr | 0.46mi | 3/2.0 | 1,260 (+11%) | 17mo | $135,000 | $107 | 42 |
Match score weights: distance 35% · size 25% · config 20% · recency 20%. Top-matched comps best support the ARV.
Projected returns pro-forma
4.77% appreciation · 3.0% rent growth · sell at horizon
- IRR
- 34.5%
- Equity multiple
- 3.11×
- Total profit
- $34,040
- Equity at exit
- $31,790
- IRR
- 33.0%
- Equity multiple
- 6.26×
- Total profit
- $84,698
- Equity at exit
- $54,221
Cash invested: $16,100 (down + closing). Projections, not guarantees.
Landlord ↔ Tenant lean methodology
- Overall (STATE)
- 87 Strongly Landlord-Friendly
- State Texas
- 87 Strongly Landlord-Friendly · R+5
- County
- — inherits STATE
- City
- — inherits STATE
ZIP-level market 78543
- Home prices YoY
- 1.9%
- Active inventory
- 40
- Price-to-rent
- 5.1×
Monthly cashflow live
- Estimated rent
- $931 medium interval (Pro) →
- Mortgage (P&I)
- −$302
- Tax est. 1.5%
- −$72 /mo · $862/yr
- Insurance
- −$24
- HOA
- −$0
- Vacancy / Maint / Mgmt
- −$195
- Net cashflow
- $338
Break-even live
Sensitivity live
| Price | -10% $378 | -5% $358 | +0% $338 | +5% $318 | +10% $298 |
|---|---|---|---|---|---|
| Rent | -10% $264 | -5% $301 | +0% $338 | +5% $375 | +10% $411 |
| Rate | -1.0pp $367 | -0.5pp $353 | base $338 | +0.5pp $323 | +1.0pp $308 |
UW: 25.0% down · 7.5% · 30yr · 1.5% tax · 5.0% vac · 8.0% maint · 8.0% mgmt
Financing live
Cash to close
- Down payment
- $14,375
- Closing costs
- $1,725
- Reserves months
- —
- Total cash needed
- —
Loan-product check · same deal, 3 products live
Conventional
25% down · 7.5% · 30yr
- Down + closing
- —
- Monthly P&I
- —
- Monthly cashflow
- —
- DSCR
- —
- Eligible?
- —
Personal DTI + credit; lowest rate.
DSCR
20% down · 8.5% · 30yr
- Down + closing
- —
- Monthly P&I
- —
- Monthly cashflow
- —
- DSCR
- —
- Eligible?
- —
No personal income docs; deal must DSCR.
Hard money
10% down · 12.0% · 12mo
- Down + closing
- —
- Monthly P&I
- —
- Monthly cashflow
- —
- DSCR
- —
- Eligible?
- —
Short-term bridge; refi at stabilization.
Rent comps 4 comps
| Address | Beds | Baths | Sqft | Rent | $/sqft | DOM | Units | Dist |
|---|---|---|---|---|---|---|---|---|
| 811 N Carlson St Elsa, TX | 3.0 | 2.0 | 750 | $950 | $1.27 | 44d | 1 | 0.27mi |
| 108 Tulipan Dr Elsa, TX | 2.0 | 1.0 | 1012 | $995 | $0.98 | 44d | 1 | 0.37mi |
| 300 Sylvia Handy Dr Unit 205 Elsa, TX | 2.0 | 2.0 | 904 | $825 | $0.91 | 44d | 1 | 0.93mi |
| 300 Sylvia Handy Dr Unit 217 Elsa, TX | 2.0 | 2.0 | 904 | $800 | $0.88 | 44d | 1 | 0.93mi |
Listing history 18 events
-
2026-06-18days on market $57,500 Active 45 DOM
-
2026-06-17days on market $57,500 Active 44 DOM
-
2026-06-16days on market $57,500 Active 43 DOM
-
2026-06-15days on market $57,500 Active 42 DOM
-
2026-06-13days on market $57,500 Active 40 DOM
-
2026-06-12days on market $57,500 Active 39 DOM
-
2026-06-09days on market $57,500 Active 36 DOM
-
2026-06-08days on market $57,500 Active 35 DOM
-
2026-06-08days on market $57,500 Active 34 DOM
-
2026-06-07pricedays on market $57,500 Active 33 DOM
-
2026-06-03days on market $59,900 Active 30 DOM
-
2026-06-02days on market $59,900 Active 29 DOM
-
2026-06-01days on market $59,900 Active 28 DOM
-
2026-05-31days on market $59,900 Active 27 DOM
-
2026-05-04status Active 287-char remark
-
2026-05-04$62,500 Active 287-char remark
-
2026-05-01price $64,900
-
2026-04-22$69,900 Active
ⓘ Source: listings_history table (triggers on properties + properties_extension) + one-shot
backfill from property_details.listing_events for pre-trigger history.
Climate risk First Street
- Flood 3/10 Moderate 20% chance over 30 yrs
- Wildfire 1/10 Low
- Heat 9/10 Extreme 7 d/yr ≥111°F today · 24 d/yr by 30 yrs out
- Wind 8/10 Severe 99% chance of damaging wind over 30 yrs
- Air quality 1/10 Low 0 unhealthy d/yr today · 0 by 30 yrs out
Nearby sold comps map
Loading sold comps map…
Walkable amenities ~0.75 mi
Loading nearby amenities…
Taxation est. · year 1
- Rental income
- $11,168
- − Mortgage interest
- −$3,221
- − Property taxes
- −$862
- − Insurance
- −$288
- − Repairs & maintenance
- −$893
- − Management
- −$893
- − Depreciation
- −$1,673
- Taxable income
- $3,338
- Est. tax owed @ 24.0%
- −$801
- After-tax cash flow
- $3,253/yr
For passive investors: Depreciation is non-cash, so a rental often shows a tax loss while cash-flowing — sheltering income. Rental losses are passive: they offset passive income freely, and up to $25,000/yr can offset ordinary (W-2) income if you actively participate and your MAGI is under $100k (phasing out to $0 by $150k); unused losses carry forward. On sale, claimed depreciation is recaptured at up to 25%, and gains may owe capital-gains tax (a 1031 exchange can defer both). Figures are a year-1 estimate at your 24.0% rate — not tax advice; consult a CPA.
Condition & rehab AI · 12 photos
This property offers a good investment opportunity with moderate rehab needed. It's located in a desirable area with potential for strong returns.
Repairs flagged
- Minor Ceiling fan — Ceiling fan is loose
- Minor Ceiling — Ceiling has minor cracks
Value-add opportunities
- Both Paint exterior — Enhances curb appeal and value
- Both Clean gutters — Improves drainage and aesthetics
- Both Replace ceiling fan — Fixes loose fan and improves functionality
Renovation cost estimate screening
| Repair item | Severity | Est. cost |
|---|---|---|
| Ceiling fan · Ceiling fan is loose | Minor | $500–3,000 |
| Ceiling · Ceiling has minor cracks | Minor | $500–3,000 |
| Total estimated repair cost · 2 items | $1,000–6,000 |
Value-add ROI direction
- Both Paint exterior — Enhances curb appeal and value ↑
- Both Clean gutters — Improves drainage and aesthetics ↑
- Both Replace ceiling fan — Fixes loose fan and improves functionality ↑
ⓘ Cost ranges are severity-bucket heuristics (US national rule-of-thumb). Get contractor quotes + a written scope before underwriting a rehab budget.
Schools (NCES district)
- District
- Edcouch-Elsa ISD
- NCES district ID
- 4818060
- Math proficiency
- 9% ▼ -27.00%
- Reading proficiency
- 20% ▼ -13.00%
- Median HH income
- $25,724
- Composite
- 10.99/100
- National rank
- #9744
- State rank
- #822 of 826 in TX
Livability — Elsa
- Score
- 66/100
- State rank
- #648
- US rank
- #12248
Category grades
Schools grade is shown separately in the Schools card above.
Census & demographics
- Census place
- Elsa, TX
- City population
- 8,608
- Population (ZIP)
- 8,608
Population outlook (Hidalgo County) Hauer SSP2
- Today (2025)
- 955,232 people
- By 2030
- 1,009,774 · +5.7%
- By 2040
- 1,120,332 · +17.3%
- By 2050
- 1,225,036 · +28.2%
- By 2075
- 1,439,189 · +50.7%
- By 2100
- 1,533,429 · +60.5%
Race, ethnicity, and origin ACS 2023
- Neighborhood character
- Predominantly Hispanic (98%)
- Race & ethnicity
- Hispanic / Latino 98% Two or more races 56% White 2%
- Hispanic origin (detail)
- Mexican 96%
- Foreign-born
- 15% · Canada
- Languages at home
- 19% English-only · Spanish 81%
Political lean MEDSL · Hidalgo
- 2024 margin
- Toss-up / Even · D 48.1% · R 51.0%
- 2008→2024 swing
- -41.6pp toward R · 2008: 38.7pp · 2024: -2.9pp
- All cycles
- 2024: R+2.9 2020: D+17.1 2016: D+40.5 2012: D+41.8 2008: D+38.7
Not yet ingested
- Civics
- —
Market trends
- HPI YoY
- ▲ 4.77%
- Current HPI
- 250.7357
- Rent YoY
- —
- Metro
- —
- State GDP YoY
- ▲ 3.95%
- F500 in state
- 110
Industry mix (Fortune 500 HQ in TX)
| Industry | F500 HQs | Revenue |
|---|---|---|
| Energy | 16 | $1,198B |
|
||
| Technology | 5 | $198B |
|
||
| Engineering / Construction | 4 | $72B |
|
||
| Energy Services | 3 | $60B |
|
||
| Utilities | 3 | $41B |
|
||
| Healthcare | 2 | $330B |
|
||
Price history
-17.7% since first listed6 events — show timeline
- 2026-06-05 Price Changed $57,500 MCALLENMLS
- 2026-05-25 Price Changed $59,900 MCALLENMLS
- 2026-05-04 Relisted — MCALLENMLS
- 2026-05-04 Listed $62,500 MCALLENMLS
- 2026-05-01 Price Changed $64,900 MCALLENMLS
- 2026-04-22 Listed $69,900 MCALLENMLS
Cash-flow waterfall
monthlySold comps — $/sqft
last 12 mo · ≤1 miLoading sold comps…