 Duplex
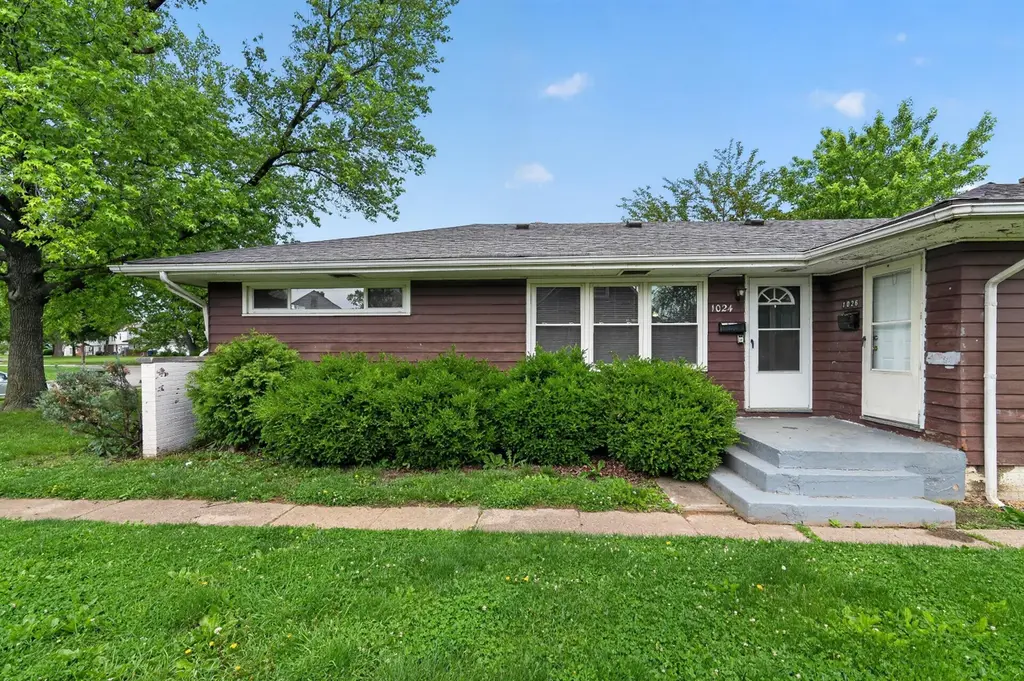
1024 S Kellner Rd · Columbus, OH
Flood risk 1/10 · Minimal
- FEMA flood zone
- X (unshaded)
- Chance of flooding over 30 yrs
- 0.0%
- Est. flood insurance / yr
- $473 – $860
Fire risk 1/10 · Minimal
- Est. fire insurance / yr
- $713 – $1,323
Heat risk 3/10 · Minor
- Hot days now (above 99°F)
- 7 days/yr
- Hot days in 30 yrs
- 18 days/yr
Wind risk 2/10 · Minimal
- Chance of severe wind over 30 yrs
- 1.0%
Air-quality risk 2/10 · Minimal
- Unhealthy air days now
- 1 days/yr
- Unhealthy air days in 30 yrs
- 3 days/yr
Risk factors via First Street. Map © Google.
Why this score? — see what drove the B grade
The composite is a weighted blend of 9 inputs, each scored 0–100. Each bar is that input's sub-score; the figure is the points it added to the 100-point composite (weight × sub-score).
- Cash flow +27.8/30.0
- ARV discount +15.0/15.0
- DSCR +9.8/10.0
- 1% rule +7.6/10.0
- Rent growth +4.8/5.0
- Livability +4.0/5.0
- Condition / age +3.8/5.0
- Schools +1.7/10.0
- Appreciation +0.0/10.0
$179,900
🖨 Deal sheet 📄 Offer letter ✓ Due diligence
Multi-family units
County records classify this as Multi-Family (2-4 Unit). Listing-text estimate: 2 units. confirmed
Listing remarks
Great investment opportunity in the heart of Eastmoor! This well-maintained duplex features spacious 2-bedroom, 1-bath units with hardwood floors and plenty of natural light. Situated on a large, oversized corner lot, the property offers a massive side yard and off-street parking. Conveniently located with easy access to E Main Street shopping, dining, and public transit. Perfect for an owner-occupant looking to house-hack or an investor seeking a turnkey addition to their portfolio.
Key facts
- Oversized corner lot
- Massive side yard
- Off street parking
Tags
Property features AI
Finance
- Financial info: Owner pays water and sewer
Exterior
- Utilities: Water available; Sewer available; Natural gas available; Electricity available
- Home design: Duplex; Built in 1953
- Construction: Built in 1953
- Exterior features: Lot approximately 0.24 acres
Interior
- Bedrooms: Duplex with 2 total units
- Heating & cooling: Forced air heating; Central cooling
- Interior features: Forced air heating; Central cooling
Neighborhood map
What this means for you Summary
Snapshot
- This is a 2 × 2-bed/1-bath units multifamily listed at $180k. Condition is rated good.
Deal economics
- At list price, monthly cash flow is $546 ($7k/yr) — positive. Per door: $273/mo.
- The deal already cash-flows at list — no discount required.
- Meets the 1% rule at list price ($2k rent vs $180k).
- Cap rate 9.9% vs local median 3.8% in Columbus — top-decile yield for the area; either an underpriced asset or a hidden risk that comps aren't pricing in. Stress-test before assuming the spread holds.
Location & tenants
- Location reads 81/100 on livability (#97 in OH, #1,491 nationally) — a professional / high-income tenant draw. Strengths: commute A+, cost of living A+, housing A+; Watch: employment C-, crime F.
- Columbus City School District (urban): math 15% / reading 26% proficiency, ranked #626 of 656 in OH (top 95%) — low school quality limits family demand, transient renter base, plan for 1-2y turnover; 72% free/reduced lunch — lower-income household profile, screen leases tightly.
- Market conditions: Rents rising fast (+9.4%/yr); 58 active listings in the ZIP; 14 comparable units currently listed for rent nearby; rentals at typical pace (median 24d on market — plan ~3-4 weeks tenant-placement turnaround); 43% of comp listings sitting > 30 days — soft ceiling on asking rent; solid renter incomes; 8,139 units permitted in Franklin County in 2024 (5,940 in 5+ unit buildings).
- This rent runs 30% of the median local income ($90k/yr) — at the standard rent-burdened threshold; future hikes will face affordability resistance.
Forward outlook
- Local home prices are declining (-3.0%/yr); year-one equity from $1k of loan paydown is wiped out by about $5k of value loss. Plan a longer hold.
- Franklin County population projected at +34% by 2050 — long-run rental-demand tailwind backs the buy-and-hold thesis.
- At projected returns (-3.0% appreciation + 8.0% rent growth), your $50k cash investment doubles in ~7 years — after that, you're playing with house money.
Negotiation context
- Only 6 days on market — expect competitive offers; lowballing is unlikely to land.
Risks & watch-outs
- Watch-outs: built in 1953 — expect roof / HVAC / electrical / plumbing capex.
Questions for the listing agent
- Can we see the unit-by-unit rent roll, current vacancy, and any below-market leases? What's the average tenancy length?
- What capital expenditures (roof, boiler, parking lot, exteriors) have been made in the last 5 years, and what's planned in the next 2?
- Built in 1953 — when were the roof, HVAC, electrical panel, plumbing, and water heater last replaced?
- Is there a deadline driving the sale (1031 exchange, divorce, estate, relocation)? That informs how much negotiation room exists.
- Crime grade is F in this area — have there been break-ins, vandalism, or insurance claims at this property in the last 3 years? What carrier currently insures it and at what premium?
- What's the average days-on-market for RENTAL listings here right now (not sales)? A rising rental-DOM trend means longer vacancies and softer asking-rent achievability than the comps imply.
- What's the recent tenant-quality profile in this submarket — average credit score on applications, eviction rate, late-payment / NSF rate, and stable-employment percentage? A property-management company in the area should have these aggregated.
- How much new apartment / multifamily construction is in the pipeline within 1–3 miles? Heavy new supply (>2% of stock underway) typically softens rents 12–24 months out; light construction supports rent growth.
Investment metrics
- 1% rule
- 1.26% ✓
- Cap rate
- 9.94%
- Cash-on-cash
- 13.01%
- DSCR
- 1.58
- GRM
- 6.6
CMA / ARV
- ARV (on-the-fly)
- $236,808
- Comps found
- 6
Show comp detail 6 sales within ~0.75 mi
| Address | Dist | Beds/Ba | Sqft | Sold | Price | $/sf | Match |
|---|---|---|---|---|---|---|---|
| 1077-1079 S James Rd | 0.08mi | 4/— | 1,536 (-10%) | 6mo | $195,000 | $127 | 74 |
| 1013 James Rd | 0.04mi | 4/— | 1,536 (-10%) | 14mo | $220,000 | $143 | 70 |
| 723-725 S Chesterfield Rd | 0.49mi | 4/— | 1,748 (+2%) | 7mo | $310,000 | $177 | 68 |
| 802 S Weyant Ave | 0.57mi | 4/— | 1,710 (-0%) | 10mo | $180,000 | $105 | 64 |
| 847-849 Byron Ave | 0.56mi | 5/— (+1) | 1,704 (-1%) | 20mo | $235,000 | $138 | 51 |
| 688-690 S James Rd | 0.51mi | 4/— | 1,900 (+11%) | 19mo | $225,000 | $118 | 42 |
Match score weights: distance 35% · size 25% · config 20% · recency 20%. Top-matched comps best support the ARV.
Projected returns pro-forma
-3.0% appreciation · 8.0% rent growth · sell at horizon
- IRR
- 8.4%
- Equity multiple
- 1.35×
- Total profit
- $17,634
- Equity at exit
- $26,824
- IRR
- 21.6%
- Equity multiple
- 3.28×
- Total profit
- $114,761
- Equity at exit
- $15,554
Cash invested: $50,372 (down + closing). Projections, not guarantees.
Landlord ↔ Tenant lean methodology
- Overall (STATE)
- 73 Landlord-Friendly
- State Ohio
- 73 Landlord-Friendly · R+6
- County
- — inherits STATE
- City
- — inherits STATE
ZIP-level market 43209
- Rents YoY
- 9.4%
- Active inventory
- 58
- Price-to-rent
- 13.2×
Monthly cashflow live
- Estimated rent
- $2,265 high interval (Pro) →
- Mortgage (P&I)
- −$943
- Tax est. 1.5%
- −$225 /mo · $2,698/yr
- Insurance
- −$75
- HOA
- −$0
- Vacancy / Maint / Mgmt
- −$476
- Net cashflow
- $546
Break-even live
2-unit breakdown (identical units grouped — click to expand)
| Units | Beds | Baths | Est. rent |
|---|---|---|---|
| 2× units | 2 | 1 | $2,266 |
| #1 | 2 | 1 | $1,133 |
| #2 | 2 | 1 | $1,133 |
| Total (2 units) | $2,265 | ||
UW: 25.0% down · 7.5% · 30yr · 1.5% tax · 5.0% vac · 8.0% maint · 8.0% mgmt
Financing live
Cash to close
- Down payment
- $44,975
- Closing costs
- $5,397
- Reserves months
- —
- Total cash needed
- —
Loan-product check · same deal, 3 products live
Conventional
25% down · 7.5% · 30yr
- Down + closing
- —
- Monthly P&I
- —
- Monthly cashflow
- —
- DSCR
- —
- Eligible?
- —
Personal DTI + credit; lowest rate.
DSCR
20% down · 8.5% · 30yr
- Down + closing
- —
- Monthly P&I
- —
- Monthly cashflow
- —
- DSCR
- —
- Eligible?
- —
No personal income docs; deal must DSCR.
Hard money
10% down · 12.0% · 12mo
- Down + closing
- —
- Monthly P&I
- —
- Monthly cashflow
- —
- DSCR
- —
- Eligible?
- —
Short-term bridge; refi at stabilization.
Rent comps 14 comps
| Address | Beds | Baths | Sqft | Rent | $/sqft | DOM | Units | Dist |
|---|---|---|---|---|---|---|---|---|
| 914 S Weyant Ave Columbus, OH | 3.0 | 1.5 | 1089 | $1,099 | $1.01 | 17d | 1 | 0.44mi |
| 1317 Barnett Rd Columbus, OH | 3.0 | 1.0 | 1057 | $1,299 | $1.23 | 12d | 1 | 0.60mi |
| 525 S Everett Ave Columbus, OH | 3.0 | 1.0 | 1137 | $1,500 | $1.32 | 15d | 1 | 0.77mi |
| 1634 S James Rd Columbus, OH | 3.0 | 1.5 | 1120 | $1,945 | $1.74 | 44d | 1 | 0.87mi |
| 1728 Penfield Rd Columbus, OH | 3.0 | 1.0 | 1224 | $1,925 | $1.57 | 44d | 1 | 1.00mi |
| 3409 Bexvie Ave Columbus, OH | 2.0–3.0 | 1.5 | 990 | $1,400 | $1.41 | 2d | 3 | 1.04mi |
| 3486 Roswell Dr Columbus, OH | 3.0 | 2.0 | 1116 | $1,625 | $1.46 | 44d | 1 | 1.06mi |
| 1246 Arkwood Ave Columbus, OH | 3.0 | 1.0 | 1094 | $1,740 | $1.59 | 44d | 1 | 1.10mi |
| 3855 E Mound St Columbus, OH | 3.0 | 1.0 | 1476 | $1,885 | $1.28 | 44d | 1 | 1.12mi |
| 384-386 S Napoleon Ave Columbus, OH | 3.0 | 1.5 | 1140 | $1,350 | $1.18 | 44d | 1 | 1.14mi |
| 1892 Somerset Ct E Columbus, OH | 4.0 | 2.0 | 1300 | $1,725 | $1.33 | 24d | 1 | 1.24mi |
| 65 S Gould Rd Columbus, OH | 3.0 | 2.5 | 1935 | $3,350 | $1.73 | 10d | 1 | 1.40mi |
| 2200 E Main St Bexley, OH | 3.0 | 1.0–3.0 | 1142 | $4,678 | $4.10 | 2d | 137 | 1.40mi |
| 3191 E Broad St Columbus, OH | 4.0 | 2.0 | 2048 | $2,200 | $1.07 | 19d | 1 | 1.46mi |
Listing history 6 events
-
2026-06-08status $179,900 Pending 6 DOM
-
2026-06-07days on market $179,900 Active 6 DOM
-
2026-06-05days on market $179,900 Active 3 DOM
-
2026-06-03days on market $179,900 Active 2 DOM
-
2026-06-02remarks 488-char remark
-
2026-06-02$179,900 Active 1 DOM
ⓘ Source: listings_history table (triggers on properties + properties_extension) + one-shot
backfill from property_details.listing_events for pre-trigger history.
Climate risk First Street
- Flood 1/10 Low FEMA zone X (unshaded) · 0% chance over 30 yrs
- Wildfire 1/10 Low
- Heat 3/10 Moderate 7 d/yr ≥99°F today · 18 d/yr by 30 yrs out
- Wind 2/10 Low 100% chance of damaging wind over 30 yrs
- Air quality 2/10 Low 1 unhealthy d/yr today · 3 by 30 yrs out
Nearby sold comps map
Loading sold comps map…
Walkable amenities ~0.75 mi
Loading nearby amenities…
Taxation est. · year 1
- Rental income
- $27,180
- − Mortgage interest
- −$10,077
- − Property taxes
- −$2,698
- − Insurance
- −$900
- − Repairs & maintenance
- −$2,174
- − Management
- −$2,174
- − Depreciation
- −$5,233
- Taxable income
- $3,923
- Est. tax owed @ 24.0%
- −$941
- After-tax cash flow
- $5,612/yr
For passive investors: Depreciation is non-cash, so a rental often shows a tax loss while cash-flowing — sheltering income. Rental losses are passive: they offset passive income freely, and up to $25,000/yr can offset ordinary (W-2) income if you actively participate and your MAGI is under $100k (phasing out to $0 by $150k); unused losses carry forward. On sale, claimed depreciation is recaptured at up to 25%, and gains may owe capital-gains tax (a 1031 exchange can defer both). Figures are a year-1 estimate at your 24.0% rate — not tax advice; consult a CPA.
Condition & rehab AI · 12 photos
This well-maintained duplex is in good condition with no major repairs needed. It offers a good investment opportunity with potential for cosmetic updates to increase its value.
Value-add opportunities
- Both Paint exterior siding — Painting the exterior siding can improve the curb appeal and increase the home's value.
- Both Clean gutters — Cleaning gutters can improve the home's appearance and prevent water damage to the exterior of the home.
Renovation cost estimate screening
Value-add ROI direction
- Both Paint exterior siding — Painting the exterior siding can improve the curb appeal and increase the home's value. ↑
- Both Clean gutters — Cleaning gutters can improve the home's appearance and prevent water damage to the exterior of the home. ↑
ⓘ Cost ranges are severity-bucket heuristics (US national rule-of-thumb). Get contractor quotes + a written scope before underwriting a rehab budget.
Schools (NCES district)
- District
- Columbus City School District
- NCES district ID
- 3904380
- Math proficiency
- 15% ▼ -17.00%
- Reading proficiency
- 26% ▼ -12.00%
- Median HH income
- $38,483
- Composite
- 17.19/100
- National rank
- #9105
- State rank
- #626 of 656 in OH
Livability — Columbus
- Score
- 81/100
- State rank
- #97
- US rank
- #1491
Category grades
Schools grade is shown separately in the Schools card above.
Census & demographics
- Census place
- Columbus, OH
- County
- Franklin County · 1,351,780 people
- City population
- 612,189
- Metro
- Columbus, OH
- Population (ZIP)
- 28,193
- Household income
- $89,713
- Rent vs Own
- Severe rent burden
- 1110.0
Population outlook (Franklin County) Hauer SSP2
- Today (2025)
- 1,456,139 people
- By 2030
- 1,556,890 · +6.9%
- By 2040
- 1,757,349 · +20.7%
- By 2050
- 1,950,539 · +34.0%
- By 2075
- 2,376,171 · +63.2%
- By 2100
- 2,636,796 · +81.1%
Race, ethnicity, and origin ACS 2023
- Neighborhood character
- Predominantly White (66%)
- Race & ethnicity
- White 66% Black 25% Two or more races 6% Hispanic / Latino 4% Asian 2%
- Common ancestry
- Romanian 4% Scotch-Irish 3% Lithuanian 2%
- Foreign-born
- 5% · Canada, China
- Languages at home
- 92% English-only · Spanish 2% Arabic 2% Russian/Polish/Slavic 1%
Political lean MEDSL · Franklin
- 2024 margin
- Strong D (+28.4) · D 63.7% · R 35.3% · Other 1.0%
- 2008→2024 swing
- +7.7pp toward D · 2008: 20.7pp · 2024: 28.4pp
- All cycles
- 2024: D+28.4 2020: D+31.4 2016: D+25.9 2012: D+21.7 2008: D+20.7
Not yet ingested
- Civics
- —
Market trends
- HPI YoY
- ▼ -405.11%
- Current HPI
- 287.281
- Rent YoY
- ▲ 9.36%
- Metro
- Columbus, OH
- State GDP YoY
- ▲ 1.98%
- F500 in state
- 48
Industry mix (Fortune 500 HQ in OH)
| Industry | F500 HQs | Revenue |
|---|---|---|
| Insurance | 3 | $145B |
|
||
| Industrial Machinery | 3 | $49B |
|
||
| Financial Services | 3 | $24B |
|
||
| Consumer Goods | 2 | $93B |
|
||
| Aerospace / Defense | 2 | $47B |
|
||
| Utilities | 2 | $33B |
|
||
Price history
1 event — show timeline
- 2026-06-01 Listed $179,900 CBRMLS
Cash-flow waterfall
monthlySold comps — $/sqft
last 12 mo · ≤1 miLoading sold comps…