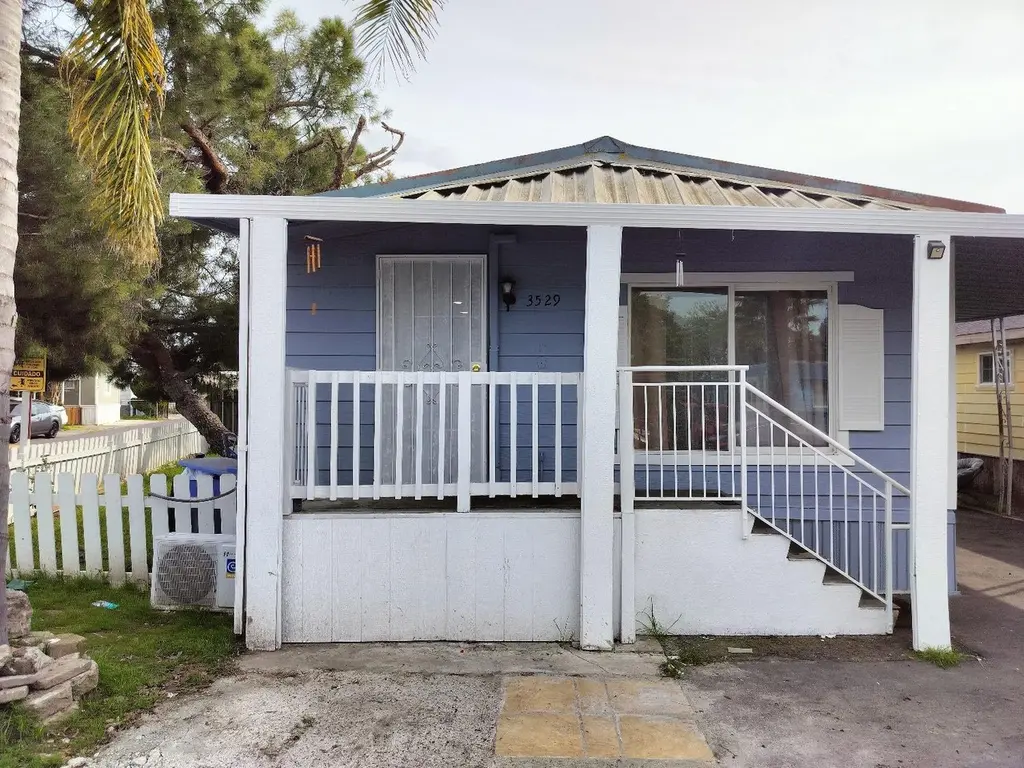
3529 Mobile Way · Sacramento, CA
Flood risk 1/10 · Minimal
- FEMA flood zone
- A99
- Chance of flooding over 30 yrs
- 0.0%
- Est. flood insurance / yr
- $1,009 – $1,996
Fire risk 1/10 · Minimal
- Est. fire insurance / yr
- $659 – $1,223
Heat risk 7/10 · Major
- Hot days now (above 103°F)
- 6 days/yr
- Hot days in 30 yrs
- 13 days/yr
Wind risk 1/10 · Minimal
- Chance of severe wind over 30 yrs
- —
Air-quality risk 10/10 · Severe
- Unhealthy air days now
- 27 days/yr
- Unhealthy air days in 30 yrs
- 33 days/yr
Risk factors via First Street. Map © Google.
Why this score? — see what drove the C+ grade
The composite is a weighted blend of 9 inputs, each scored 0–100. Each bar is that input's sub-score; the figure is the points it added to the 100-point composite (weight × sub-score).
- Cash flow +30.0/30.0
- 1% rule +10.0/10.0
- DSCR +10.0/10.0
- Livability +3.6/5.0
- Schools +3.1/10.0
- Rent growth +2.7/5.0
- Condition / age +2.5/5.0
- ARV discount +0.0/15.0
- Appreciation +0.0/10.0
$75,000
🖨 Deal sheet 📄 Offer letter ✓ Due diligence
Listing remarks
Don't miss the opportunity to own this 2-3 Bedroom 2 bath home in established ALL AGE Mobil Park Community. This home features dining/family combo with an open kitchen concept. Located on corner lot, this affordable home is close to shopping centers, schools and easy access to freeway. A MUST SEE!!
Key facts
- Open kitchen concept
- Corner lot
- 3 parking spots
Tags
Property features AI
Finance
- Other: Property subtype: Double wide; Property type: Manufactured in park; Other structures: Shed(s)
- HOA & community: No homeowners association; Not a senior community; Land lease: No (listed land lease amount present)
Exterior
- Parking: Covered parking (3 spaces)
- Utilities: Propane; 220 volts in kitchen; 220 volts in laundry; Public sewer; Public water
- Home design: Manufactured in park (double wide); Original condition; Built in 1977; Corner lot
- Construction: Shingle and metal roof; Skirting: wood and metal
- Exterior features: Carport awning; Storage shed(s); Fenced yard
Interior
- Kitchen: Free standing gas range; Free standing refrigerator; Pantry cabinet; Ceramic countertops; Dining bar
- Bedrooms: 2 bedrooms (possible 3rd bedroom)
- Flooring: Vinyl flooring
- Bathrooms: 1 full bathroom; 1 partial bathroom; Tub with shower over
- Heating & cooling: Multi-unit heating; Multi-zone heating; Ceiling fans; Wall unit cooling; Multi-zone cooling; Other heating/cooling features
- Interior features: Free standing gas range; Free standing refrigerator; Pantry cabinet; Ceramic countertops; Dining bar; Porch steps; Unfurnished; Pets allowed (cats and dogs, size limits apply)
- Laundry & utility: Washer and dryer included; Laundry closet with electric hookup; Laundry located inside
Neighborhood map
What this means for you Summary
Snapshot
- This is a 2-bed/1.5-bath manufactured listed at $75k.
Deal economics
- At list price, monthly cash flow is $770 ($9k/yr) — positive.
- The deal already cash-flows at list — no discount required.
- Meets the 1% rule at list price ($2k rent vs $75k).
- Cap rate 20.6% vs local median 3.0% in Sacramento — top-decile yield for the area; either an underpriced asset or a hidden risk that comps aren't pricing in. Stress-test before assuming the spread holds.
Location & tenants
- Location reads 71/100 on livability (#218 in CA) — a middle-class / working-renter tenant base. Strengths: amenities A+, commute A+, housing A; Watch: schools D+, crime F, cost of living F.
- Twin Rivers Unified (suburban): math 29% / reading 37% proficiency, ranked #970 of 1,400 in CA (top 69%) — families likely to look elsewhere, expect single-tenant / working-renter base with shorter leases; 76% free/reduced lunch — lower-income household profile, screen leases tightly.
- Market conditions: Rents flat; 145 active listings in the ZIP; 14 comparable units currently listed for rent nearby; rentals leasing fast (median 11d on market — plan ~1-2 weeks tenant-placement turnaround); solid renter incomes; 6,825 units permitted in Sacramento County in 2024 (1,752 in 5+ unit buildings).
Forward outlook
- Local home prices are declining (-3.0%/yr); year-one equity from $519 of loan paydown is wiped out by about $2k of value loss. Plan a longer hold.
- Sacramento County population projected at +17% by 2050 — long-run rental-demand tailwind backs the buy-and-hold thesis.
- At projected returns (-3.0% appreciation + 0.8% rent growth), your $21k cash investment doubles in ~3 years — after that, you're playing with house money.
Negotiation context
- Only 6 days on market — expect competitive offers; lowballing is unlikely to land.
Risks & watch-outs
- Watch-outs: flood insurance adds $125/mo.
- Climate carrying-cost: in FEMA flood zone A99 (mandatory federal flood insurance); extreme-heat days projected 6→13/yr by 2055 (HVAC capex compounding) — expect insurance premiums to compound above CPI over the hold.
Questions for the listing agent
- Built in 1977 — when were the roof, HVAC, electrical panel, plumbing, and water heater last replaced?
- What's the actual annual flood-insurance premium (NFIP or private), and is the property in a SFHA with mandatory coverage?
- Is there a deadline driving the sale (1031 exchange, divorce, estate, relocation)? That informs how much negotiation room exists.
- Schools are D-rated, which usually means shorter tenancies and higher turnover. Who's the typical renter profile here, and what's been the actual vacancy rate?
- Crime grade is F in this area — have there been break-ins, vandalism, or insurance claims at this property in the last 3 years? What carrier currently insures it and at what premium?
- What's the average days-on-market for RENTAL listings here right now (not sales)? A rising rental-DOM trend means longer vacancies and softer asking-rent achievability than the comps imply.
- What's the recent tenant-quality profile in this submarket — average credit score on applications, eviction rate, late-payment / NSF rate, and stable-employment percentage? A property-management company in the area should have these aggregated.
- How much new for-sale + rental construction is in the pipeline within 1–3 miles? Heavy new supply typically softens prices + rents 12–24 months out; constrained supply supports both.
Investment metrics
- 1% rule
- 2.39% ✓
- Cap rate
- 20.62%
- Cash-on-cash
- 51.17%
- DSCR
- 3.28
- GRM
- 3.5
CMA / ARV
- ARV (on-the-fly)
- $61,600
- Comps found
- 1
Show comp detail 1 sale within ~0.75 mi
| Address | Dist | Beds/Ba | Sqft | Sold | Price | $/sf | Match |
|---|---|---|---|---|---|---|---|
| 3557 Mobile Way | 0.07mi | 2/1.0 | 784 (-2%) | 9mo | $60,000 | $77 | 83 |
Match score weights: distance 35% · size 25% · config 20% · recency 20%. Top-matched comps best support the ARV.
Projected returns pro-forma
-3.0% appreciation · 0.82% rent growth · sell at horizon
- IRR
- 38.3%
- Equity multiple
- 2.58×
- Total profit
- $33,166
- Equity at exit
- $11,183
- IRR
- 43.6%
- Equity multiple
- 4.68×
- Total profit
- $77,380
- Equity at exit
- $6,485
Cash invested: $21,000 (down + closing). Projections, not guarantees.
Landlord ↔ Tenant lean methodology
- Overall (STATE)
- 18 Strongly Tenant-Friendly
- State California
- 18 Strongly Tenant-Friendly · D+13
- County
- — inherits STATE
- City
- — inherits STATE
ZIP-level market 95834
- Home prices YoY
- -13.2%
- Rents YoY
- 0.8%
- Active inventory
- 145
- Price-to-rent
- 3.5×
Monthly cashflow live
- Estimated rent
- $1,790 high interval (Pro) →
- Mortgage (P&I)
- −$393
- Tax est. 1.5%
- −$94 /mo · $1,125/yr
- Insurance
- −$31
- Flood insurance flood zone
- −$125 /mo · $1,502/yr
- HOA
- −$0
- Vacancy / Maint / Mgmt
- −$376
- Net cashflow
- $770
Break-even live
UW: 25.0% down · 7.5% · 30yr · 1.5% tax · 5.0% vac · 8.0% maint · 8.0% mgmt
Financing live
Cash to close
- Down payment
- $18,750
- Closing costs
- $2,250
- Reserves months
- —
- Total cash needed
- —
Loan-product check · same deal, 3 products live
Conventional
25% down · 7.5% · 30yr
- Down + closing
- —
- Monthly P&I
- —
- Monthly cashflow
- —
- DSCR
- —
- Eligible?
- —
Personal DTI + credit; lowest rate.
DSCR
20% down · 8.5% · 30yr
- Down + closing
- —
- Monthly P&I
- —
- Monthly cashflow
- —
- DSCR
- —
- Eligible?
- —
No personal income docs; deal must DSCR.
Hard money
10% down · 12.0% · 12mo
- Down + closing
- —
- Monthly P&I
- —
- Monthly cashflow
- —
- DSCR
- —
- Eligible?
- —
Short-term bridge; refi at stabilization.
Rent comps 14 comps
| Address | Beds | Baths | Sqft | Rent | $/sqft | DOM | Units | Dist |
|---|---|---|---|---|---|---|---|---|
| 801 San Juan Rd Sacramento, CA | 1.0–2.0 | 1.0–2.0 | 765 | $1,660 | $2.17 | 1d | 3 | 0.56mi |
| 3196 Kinnaird Way Sacramento, CA | 2.0 | 1.0 | 830 | $1,525 | $1.84 | 21d | 1 | 0.64mi |
| 300 Curran Ave Sacramento, CA | 2.0 | 1.0 | 710 | $1,695 | $2.39 | 43d | 1 | 0.77mi |
| 310 Graves Ave Sacramento, CA | 2.0 | 1.0 | 800 | $1,725 | $2.16 | 1d | 1 | 0.79mi |
| 2801 Grove Ave Sacramento, CA | 2.0 | 1.0 | 669 | $1,500 | $2.24 | 1d | 1 | 1.13mi |
| 3525 Cattle Dr Sacramento, CA | 3.0 | 2.0 | 1025 | $2,295 | $2.24 | 23d | 1 | 1.14mi |
| 4337 Norwood Ave Sacramento, CA | 2.0 | 1.0–2.0 | 811 | $1,945 | $2.40 | 3d | 9 | 1.27mi |
| 4337 Norwood Ave Sacramento, CA | 2.0 | 2.0 | 835 | $1,895 | $2.27 | 23d | 1 | 1.27mi |
| 4337 Norwood Ave Sacramento, CA | 2.0 | 1.0 | 788 | $1,895 | $2.40 | 17d | 1 | 1.27mi |
| 385 Bell Ave Sacramento, CA | 2.0 | 1.0 | 890 | $1,459 | $1.64 | 7d | 1 | 1.35mi |
| 410 Bell Ave Sacramento, CA | 1.0–2.0 | 1.0–2.0 | 729 | $1,899 | $2.60 | 10d | 9 | 1.36mi |
| 590 Las Palmas Ave Unit 7 Sacramento, CA | 1.0 | 1.0 | 650 | $1,075 | $1.65 | 1d | 1 | 1.40mi |
| 2720 Forrest St Unit 2 Sacramento, CA | 1.0 | 1.0 | 525 | $1,425 | $2.71 | 1d | 1 | 1.40mi |
| 600 Las Palmas Ave Unit 7 Sacramento, CA | 1.0 | 1.0 | 550 | $1,345 | $2.45 | 14d | 1 | 1.42mi |
Listing history 6 events
-
2026-06-18days on market $75,000 Active 6 DOM
-
2026-06-17days on market $75,000 Active 5 DOM
-
2026-06-16days on market $75,000 Active 4 DOM
-
2026-06-15days on market $75,000 Active 3 DOM
-
2026-06-13remarks 299-char remark
-
2026-06-13$75,000 Active 1 DOM
ⓘ Source: listings_history table (triggers on properties + properties_extension) + one-shot
backfill from property_details.listing_events for pre-trigger history.
Climate risk First Street
- Flood 1/10 Low FEMA zone A99 · 0% chance over 30 yrs
- Wildfire 1/10 Low
- Heat 7/10 Severe 6 d/yr ≥103°F today · 13 d/yr by 30 yrs out
- Wind 1/10 Low
- Air quality 10/10 Extreme 27 unhealthy d/yr today · 33 by 30 yrs out
Nearby sold comps map
Loading sold comps map…
Walkable amenities ~0.75 mi
Loading nearby amenities…
Taxation est. · year 1
- Rental income
- $21,475
- − Mortgage interest
- −$4,201
- − Property taxes
- −$1,125
- − Insurance
- −$1,877
- − Repairs & maintenance
- −$1,718
- − Management
- −$1,718
- − Depreciation
- −$2,182
- Taxable income
- $8,653
- Est. tax owed @ 24.0%
- −$2,077
- After-tax cash flow
- $7,166/yr
For passive investors: Depreciation is non-cash, so a rental often shows a tax loss while cash-flowing — sheltering income. Rental losses are passive: they offset passive income freely, and up to $25,000/yr can offset ordinary (W-2) income if you actively participate and your MAGI is under $100k (phasing out to $0 by $150k); unused losses carry forward. On sale, claimed depreciation is recaptured at up to 25%, and gains may owe capital-gains tax (a 1031 exchange can defer both). Figures are a year-1 estimate at your 24.0% rate — not tax advice; consult a CPA.
Schools (NCES district)
- District
- Twin Rivers Unified
- NCES district ID
- 0601332
- Math proficiency
- 29% ▲ 2.00%
- Reading proficiency
- 37% ▲ 2.00%
- Median HH income
- $42,481
- Composite
- 30.67/100
- National rank
- #11437
- State rank
- #970 of 1400 in CA
Livability — Sacramento
- Score
- 71/100
- State rank
- #218
- US rank
- #6957
Category grades
Schools grade is shown separately in the Schools card above.
Census & demographics
- Census place
- Sacramento, CA
- County
- Sacramento County · 1,539,646 people
- City population
- 761,410
- Metro
- Sacramento-Roseville-Folsom, CA
- Population (ZIP)
- 36,245
- Household income
- $101,260
- Rent vs Own
- Severe rent burden
- 1444.0
Population outlook (Sacramento County) Hauer SSP2
- Today (2025)
- 1,660,763 people
- By 2030
- 1,732,990 · +4.3%
- By 2040
- 1,855,755 · +11.7%
- By 2050
- 1,941,335 · +16.9%
- By 2075
- 2,046,162 · +23.2%
- By 2100
- 1,961,444 · +18.1%
Race, ethnicity, and origin ACS 2023
- Neighborhood character
- Highly diverse neighborhood (Simpson 0.78)
- Race & ethnicity
- Asian 29% Hispanic / Latino 28% White 19% Two or more races 16% Black 15% Pacific Islander 1%
- Hispanic origin (detail)
- Mexican 21%
- Common ancestry
- Lithuanian 2% Subsaharan African 1% Russian 1%
- Foreign-born
- 30% · Canada, China, Vietnam
- Languages at home
- 58% English-only · Spanish 15% Other Indo-European 14% Other Asian/Pacific 3%
Political lean MEDSL · Sacramento
- 2024 margin
- D (+19.7) · D 58.1% · R 38.4% · Other 3.5%
- 2008→2024 swing
- +0.7pp no change · 2008: 19.0pp · 2024: 19.7pp
- All cycles
- 2024: D+19.7 2020: D+25.3 2016: D+23.7 2012: D+16.3 2008: D+19.0
Not yet ingested
- Civics
- —
Market trends
- HPI YoY
- ▼ -45.12%
- Current HPI
- 295.8305
- Rent YoY
- ▲ 0.82%
- Metro
- Sacramento-Roseville-Folsom, CA
- State GDP YoY
- ▲ 3.21%
- F500 in state
- 116
Industry mix (Fortune 500 HQ in CA)
| Industry | F500 HQs | Revenue |
|---|---|---|
| Technology | 27 | $1,492B |
|
||
| Financial Services | 3 | $174B |
|
||
| Retail | 3 | $44B |
|
||
| Insurance | 3 | $26B |
|
||
| Media / Entertainment | 2 | $115B |
|
||
| Pharmaceuticals / Biotech | 2 | $62B |
|
||
Cash-flow waterfall
monthlySold comps — $/sqft
last 12 mo · ≤1 miLoading sold comps…