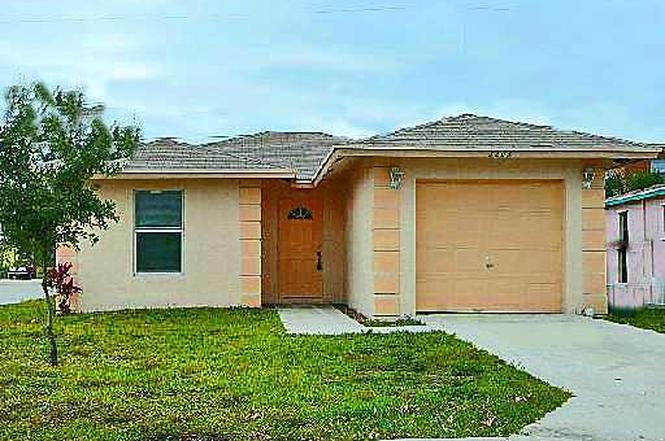
1201 W 32nd St · Riviera Beach, FL
Flood risk 6/10 · Moderate
- FEMA flood zone
- X (unshaded)
- Chance of flooding over 30 yrs
- 0.74%
- Est. flood insurance / yr
- $507 – $1,088
Fire risk 1/10 · Minimal
- Est. fire insurance / yr
- $947 – $1,759
Heat risk 10/10 · Severe
- Hot days now (above 106°F)
- 7 days/yr
- Hot days in 30 yrs
- 24 days/yr
Wind risk 10/10 · Severe
- Chance of severe wind over 30 yrs
- 99.0%
Air-quality risk 2/10 · Minimal
- Unhealthy air days now
- 0 days/yr
- Unhealthy air days in 30 yrs
- 1 days/yr
Risk factors via First Street. Map © Google.
Why this score? — see what drove the D+ grade
The composite is a weighted blend of 9 inputs, each scored 0–100. Each bar is that input's sub-score; the figure is the points it added to the 100-point composite (weight × sub-score).
- Cash flow +22.0/30.0
- DSCR +7.0/10.0
- 1% rule +5.3/10.0
- Schools +4.3/10.0
- Livability +3.4/5.0
- Condition / age +2.5/5.0
- Rent growth +2.3/5.0
- ARV discount +0.0/15.0
- Appreciation +0.0/10.0
$325,000
🖨 Deal sheet (PDF) 📄 Offer letter ✓ Due diligence
Listing remarks MLS
Bank Foreclosure Built 2004. Must see this one.
Key facts
- 5,266 sq ft lot
- Garage
- Built 2004
Property features AI
Finance
- Other: Resale property
- HOA & community: No association amenities listed
Exterior
- Parking: Garage (covered), 1 garage space
- Utilities: Three-phase electric; Cable available
- Home design: Single family residence; Single-story; North-facing
- Construction: Concrete/CBS construction
- Exterior features: Not waterfront
Interior
- Kitchen: Electric range; Microwave; Refrigerator
- Bedrooms: 3 bedrooms on the main level
- Flooring: Ceramic tile
- Bathrooms: 2 full bathrooms (both on the main level)
- Heating & cooling: Central heating; Central air conditioning
- Interior features: Electric water heater; Unfurnished; Entry level living area
- Laundry & utility: Washer hookup
Neighborhood map
What this means for you Summary
Snapshot
- This is a 3-bed/2.0-bath single-family listed at $325k.
Deal economics
- At list price, monthly cash flow is $518 ($6k/yr) — positive.
- The deal already cash-flows at list — no discount required.
- Meets the 1% rule at list price ($3k rent vs $325k).
- Recommended offer: $286k (12.0% below list) — sets the bar for market timing.
Location & tenants
- Location reads 67/100 on livability (#581 in FL) — a middle-class / working-renter tenant base. Strengths: housing A+, health & safety A+, cost of living A-; Watch: employment D, crime F, amenities F.
- Palm Beach (suburban): math 46% / reading 53% proficiency, ranked #34 of 73 in FL (top 47%) — families likely to look elsewhere, expect single-tenant / working-renter base with shorter leases.
- Zoned schools: Dr. Mary Mcleod Bethune Elementary (math 28% / reading 25%, grade F, #2,009 of 2,144 statewide, top 94%, 540 students, 87% FRL); Howell L. Watkins Middle School (math 18% / reading 33%, grade F, #512 of 571 statewide, top 90%, 794 students, 76% FRL); Palm Beach Gardens High School (math 19% / reading 40%, grade F, #447 of 667 statewide, top 68%, 2,570 students, 61% FRL) — zoned schools average 75% FRL vs 52% district-wide (23 pts higher); higher-poverty schools than district average — tighter screening recommended.
- Zoned-school proficiency averages 27% at this address vs 50% district-wide (-22 pts) — the specific schools serving this property underperform the Palm Beach average; the district grade overstates school quality for this exact location.
- Market conditions: Rents soft (-0.7%/yr); 506 active listings in the ZIP; 16 comparable units currently listed for rent nearby; rentals at typical pace (median 26d on market — plan ~3-4 weeks tenant-placement turnaround); 3,974 units permitted in Palm Beach County in 2024 (1,012 in 5+ unit buildings).
- At $3,350/mo this rent would consume 62% of the median local household income ($65k/yr) (locally 1838% of renters already pay >50% of income on rent) — very limited rent-growth headroom before tenants either downsize or default.
Forward outlook
- Local home prices are declining (-3.0%/yr); year-one equity from $2k of loan paydown is wiped out by about $10k of value loss. Plan a longer hold.
- Palm Beach County population projected at +30% by 2050 — long-run rental-demand tailwind backs the buy-and-hold thesis.
Negotiation context
- It's been on market 285 days — a 12% lower offer ($286k) is reasonable based on typical stale-listing flexibility.
- 4 sale attempts since 18y ago; this cycle's ask is 8% above the opening price — seller raised mid-cycle; expect resistance to lowballs.
- Current owner paid $47k; list at $325k implies a 591% gain — meaningful room to come down on a strong offer.
Risks & watch-outs
- Climate carrying-cost: major flood risk; severe wind risk, 99% chance of damaging wind over 30y; extreme-heat days projected 7→24/yr by 2055 (HVAC capex compounding) — expect insurance premiums to compound above CPI over the hold.
Questions for the listing agent
- It's been on market 285 days. Have you received any prior offers? Is the seller open to a 12% concession, seller financing, or rate buy-down credit?
- Why hasn't it sold? Are there any deal-killer items the seller is aware of (foundation, flood, title, zoning, code violations)?
- Is there a deadline driving the sale (1031 exchange, divorce, estate, relocation)? That informs how much negotiation room exists.
- Crime grade is F in this area — have there been break-ins, vandalism, or insurance claims at this property in the last 3 years? What carrier currently insures it and at what premium?
- The area grade is low — what's the realistic commute time and amenity access for the typical tenant pool here? Any planned neighborhood developments (good or bad) we should know about?
- What's the average days-on-market for RENTAL listings here right now (not sales)? A rising rental-DOM trend means longer vacancies and softer asking-rent achievability than the comps imply.
- What's the recent tenant-quality profile in this submarket — average credit score on applications, eviction rate, late-payment / NSF rate, and stable-employment percentage? A property-management company in the area should have these aggregated.
- How much new for-sale + rental construction is in the pipeline within 1–3 miles? Heavy new supply typically softens prices + rents 12–24 months out; constrained supply supports both.
Investment metrics
- 1% rule
- 1.03% ✓
- Cap rate
- 8.21%
- Cash-on-cash
- 6.83%
- DSCR
- 1.30
- GRM
- 8.1
CMA / ARV
- ARV (on-the-fly)
- $228,726
- Comps found
- 1
Show comp detail 1 sale within ~0.75 mi
| Address | Dist | Beds/Ba | Sqft | Sold | Price | $/sf | Match |
|---|---|---|---|---|---|---|---|
| 1259 W 26th St | 0.38mi | 3/1.0 | 1,136 (-4%) | 24mo | $220,000 | $194 | 52 |
Match score weights: distance 35% · size 25% · config 20% · recency 20%. Top-matched comps best support the ARV.
Projected returns pro-forma
-3.0% appreciation · 0.0% rent growth · sell at horizon
- IRR
- -9.1%
- Equity multiple
- 0.68×
- Total profit
- $-29,508
- Equity at exit
- $48,459
- IRR
- -4.1%
- Equity multiple
- 0.77×
- Total profit
- $-21,238
- Equity at exit
- $28,100
Cash invested: $91,000 (down + closing). Projections, not guarantees.
Landlord ↔ Tenant lean methodology
- Overall (STATE)
- 87 Strongly Landlord-Friendly
- State Florida
- 87 Strongly Landlord-Friendly · R+3
- County
- — inherits STATE
- City
- — inherits STATE
ZIP-level market 33404
- Home prices YoY
- -31.1%
- Rents YoY
- -0.7%
- Active inventory
- 506
- Price-to-rent
- 8.1×
Monthly cashflow live
- Estimated rent
- $3,350 high interval (Pro) →
- Mortgage (P&I)
- −$1,704
- Tax from tax record
- −$289 /mo · $3,465/yr
- Insurance
- −$135
- HOA
- −$0
- Vacancy / Maint / Mgmt
- −$704
- Net cashflow
- $518
Break-even live
Sensitivity live
| Price | -10% $702 | -5% $610 | +0% $518 | +5% $426 | +10% $334 |
|---|---|---|---|---|---|
| Rent | -10% $253 | -5% $386 | +0% $518 | +5% $650 | +10% $783 |
| Rate | -1.0pp $682 | -0.5pp $601 | base $518 | +0.5pp $434 | +1.0pp $348 |
UW: 25.0% down · 7.5% · 30yr · 1.5% tax · 5.0% vac · 8.0% maint · 8.0% mgmt
Financing live
Cash to close
- Down payment
- $81,250
- Closing costs
- $9,750
- Reserves months
- —
- Total cash needed
- —
Loan-product check · same deal, 3 products live
Conventional
25% down · 7.5% · 30yr
- Down + closing
- —
- Monthly P&I
- —
- Monthly cashflow
- —
- DSCR
- —
- Eligible?
- —
Personal DTI + credit; lowest rate.
DSCR
20% down · 8.5% · 30yr
- Down + closing
- —
- Monthly P&I
- —
- Monthly cashflow
- —
- DSCR
- —
- Eligible?
- —
No personal income docs; deal must DSCR.
Hard money
10% down · 12.0% · 12mo
- Down + closing
- —
- Monthly P&I
- —
- Monthly cashflow
- —
- DSCR
- —
- Eligible?
- —
Short-term bridge; refi at stabilization.
Rent comps 16 comps
| Address | Beds | Baths | Sqft | Rent | $/sqft | DOM | Units | Dist |
|---|---|---|---|---|---|---|---|---|
| 1400 W 28th St Unit 1 Riviera Beach, FL | 4.0 | 2.0 | 1100 | $3,200 | $2.91 | 26d | 1 | 0.26mi |
| 901 W 37th St Riviera Beach, FL | 3.0 | 1.0 | 900 | $2,895 | $3.22 | 26d | 1 | 0.41mi |
| 815 Silver Beach Rd Lake Park, FL | 4.0 | 3.0 | 1480 | $3,000 | $2.03 | 26d | 1 | 0.44mi |
| 855 Date Palm Dr West Palm Beach, FL | 3.0 | 3.0 | 1216 | $3,150 | $2.59 | 26d | 1 | 0.60mi |
| 520 W 28th St Riviera Beach, FL | 3.0 | 1.0 | 1296 | $6,000 | $4.63 | 4d | 1 | 0.68mi |
| 2016 Avenue S Riviera Beach, FL | 4.0 | 3.0 | 1128 | $3,800 | $3.37 | 26d | 1 | 0.76mi |
| 1401 W 9th St Riviera Beach, FL | 3.0 | 2.0 | 1304 | $3,200 | $2.45 | 26d | 1 | 1.22mi |
| 301 Hawthorne Dr West Palm Beach, FL | 3.0 | 2.0 | 1402 | $3,200 | $2.28 | 26d | 1 | 1.24mi |
| 220 Lake Shore Dr Lake Park, FL | 1.0–3.0 | 1.5–3.5 | 2134 | $25,000 | $11.72 | 0d | 19 | 1.29mi |
| 65 W 16th St Apt 1 Riviera Beach, FL | 4.0 | 2.0 | 1232 | $3,500 | $2.84 | 18d | 1 | 1.32mi |
| 65 W 16th St Apt 1 Riviera Beach, FL | 4.0 | 2.0 | 1200 | $3,500 | $2.92 | 9d | 1 | 1.32mi |
| 158 E 23rd St Riviera Beach, FL | 2.0 | 2.0 | 1110 | $2,900 | $2.61 | 26d | 1 | 1.35mi |
| 158 E 23rd St Riviera Beach, FL | 2.0 | 2.0 | 1110 | $2,900 | $2.61 | 23d | 1 | 1.35mi |
| 301 Lake Shore Dr #802 West Palm Beach, FL | 2.0 | 2.0 | 1316 | $3,000 | $2.28 | 26d | 1 | 1.37mi |
| 410 Wilma Cir #103 Riviera Beach, FL | 2.0 | 2.0 | 1056 | $4,000 | $3.79 | 16d | 1 | 1.38mi |
| 308 Southwind Ct Unit 8 North Palm Beach, FL | 2.0 | 2.0 | 1100 | $2,900 | $2.64 | 26d | 1 | 1.47mi |
Listing history 13 events
-
2026-05-31days on market $325,000 Active 285 DOM
-
2025-09-22price $325,000
-
2025-08-19$300,000 Active
-
2023-06-09historical
-
2009-06-09soldstatus $47,000 47-char remark
Show marketing remark (47 chars)
Bank Foreclosure Built 2004. Must see this one.
-
2009-05-09historical 47-char remark
Show marketing remark (47 chars)
Bank Foreclosure Built 2004. Must see this one.
-
2009-03-11historical
-
2009-02-14$65,900 47-char remark
Show marketing remark (47 chars)
Bank Foreclosure Built 2004. Must see this one.
-
2008-10-13$114,900
-
2008-09-03historical
-
2008-04-17$124,150
-
2003-10-28soldstatus $11,000
-
1986-03-01soldstatus $9,500
ⓘ Source: listings_history table (triggers on properties + properties_extension) + one-shot
backfill from property_details.listing_events for pre-trigger history.
Tax reassessment forecast FL · Resets to sale price
- Current annual tax
- $3,465 · $289/mo
- Projected year-2 tax
- $3,465 · $289/mo
- Expected delta
- $0/yr ($0/mo · 0.0%)
ⓘ Screening estimate from a state-policy table — verify with the county assessor before closing.
Climate risk First Street
- Flood 6/10 Major FEMA zone X (unshaded) · 74% chance over 30 yrs
- Wildfire 1/10 Low
- Heat 10/10 Extreme 7 d/yr ≥106°F today · 24 d/yr by 30 yrs out
- Wind 10/10 Extreme 99% chance of damaging wind over 30 yrs
- Air quality 2/10 Low 0 unhealthy d/yr today · 1 by 30 yrs out
Nearby sold comps map
Loading sold comps map…
Walkable amenities ~0.75 mi
Loading nearby amenities…
Taxation est. · year 1
- Rental income
- $40,201
- − Mortgage interest
- −$18,205
- − Property taxes
- −$3,465
- − Insurance
- −$1,625
- − Repairs & maintenance
- −$3,216
- − Management
- −$3,216
- − Depreciation
- −$9,455
- Taxable income
- $1,019
- Est. tax owed @ 24.0%
- −$245
- After-tax cash flow
- $5,972/yr
For passive investors: Depreciation is non-cash, so a rental often shows a tax loss while cash-flowing — sheltering income. Rental losses are passive: they offset passive income freely, and up to $25,000/yr can offset ordinary (W-2) income if you actively participate and your MAGI is under $100k (phasing out to $0 by $150k); unused losses carry forward. On sale, claimed depreciation is recaptured at up to 25%, and gains may owe capital-gains tax (a 1031 exchange can defer both). Figures are a year-1 estimate at your 24.0% rate — not tax advice; consult a CPA.
Schools (NCES district)
- District
- Palm Beach
- NCES district ID
- 1201500
- Math proficiency
- 46% ▼ -16.00%
- Reading proficiency
- 53% ▼ -4.00%
- Median HH income
- $53,943
- Composite
- 42.72/100
- National rank
- #3160
- State rank
- #34 of 73 in FL
Livability — Riviera Beach
- Score
- 67/100
- State rank
- #581
- US rank
- #11060
Category grades
Schools grade is shown separately in the Schools card above.
Census & demographics
- Census place
- Riviera Beach, FL
- County
- Palm Beach County · 1,438,312 people
- City population
- 30,912
- Metro
- Miami-Fort Lauderdale-Pompano Beach, FL
- Population (ZIP)
- 30,912
- Household income
- $65,063
- Rent vs Own
- Severe rent burden
- 1838.0
Population outlook (Palm Beach County) Hauer SSP2
- Today (2025)
- 1,637,487 people
- By 2030
- 1,743,255 · +6.5%
- By 2040
- 1,948,712 · +19.0%
- By 2050
- 2,132,979 · +30.3%
- By 2075
- 2,530,027 · +54.5%
- By 2100
- 2,706,979 · +65.3%
Race, ethnicity, and origin ACS 2023
- Neighborhood character
- Majority Black (64%)
- Race & ethnicity
- Black 64% White 22% Hispanic / Latino 9% Two or more races 8%
- Hispanic origin (detail)
- Mexican 1% Puerto Rican 1%
- Common ancestry
- Hispanic 8% Romanian 1% Italian 1%
- Foreign-born
- 21% · Canada, Jamaica
- Languages at home
- 82% English-only · Spanish 8% French/Haitian/Cajun 7% Other Indo-European 1%
Political lean MEDSL · Palm Beach
- 2024 margin
- Toss-up / Even · D 50.0% · R 49.2%
- 2008→2024 swing
- -22.1pp toward R · 2008: 22.9pp · 2024: 0.8pp
- All cycles
- 2024: D+0.8 2020: D+12.8 2016: D+15.3 2012: D+17.0 2008: D+22.9
Not yet ingested
- Civics
- —
Market trends
- HPI YoY
- ▼ -153.74%
- Current HPI
- 341.1761
- Rent YoY
- ▼ -0.72%
- Metro
- Miami-Fort Lauderdale-Pompano Beach, FL
- State GDP YoY
- ▲ 3.28%
- F500 in state
- 36
Industry mix (Fortune 500 HQ in FL)
| Industry | F500 HQs | Revenue |
|---|---|---|
| Industrial Technology | 2 | $29B |
|
||
| Insurance | 2 | $17B |
|
||
| Retail | 1 | $60B |
|
||
| Technology Distribution | 1 | $58B |
|
||
| Homebuilding | 1 | $35B |
|
||
| Technology Manufacturing | 1 | $35B |
|
||
Price history
+3321.1% since first listed12 events — show timeline
- 2025-09-22 Price Changed $325,000 Beaches MLS
- 2025-08-19 Listed $300,000 Beaches MLS
- 2023-06-09 Rental Removed — RMLSFL
- 2009-06-09 Sold (MLS) $47,000 Beaches MLS
- 2009-05-09 Listing Removed — Beaches MLS
- 2009-03-11 Listing Removed — Beaches MLS
- 2009-02-14 Listed $65,900 Beaches MLS
- 2008-10-13 Listed $114,900 Beaches MLS
- 2008-09-03 Listing Removed — Beaches MLS
- 2008-04-17 Listed $124,150 Beaches MLS
- 2003-10-28 Sold (Public Records) $11,000 Public Records
- 1986-03-01 Sold (Public Records) $9,500 Public Records
Property tax history
+8.8%/yrLatest (2025): $3,465 · +8.2% YoY. Source: county tax records.
Cash-flow waterfall
monthlySold comps — $/sqft
last 12 mo · ≤1 miLoading sold comps…