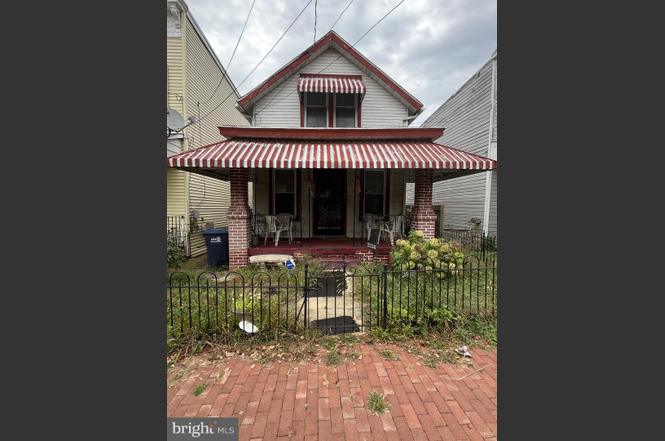
2236 Chester St SE · Washington, DC
Flood risk 6/10 · Moderate
- FEMA flood zone
- X (unshaded)
- Chance of flooding over 30 yrs
- 0.75%
- Est. flood insurance / yr
- $473 – $860
Fire risk 1/10 · Minimal
- Est. fire insurance / yr
- $631 – $1,173
Heat risk 7/10 · Major
- Hot days now (above 104°F)
- 7 days/yr
- Hot days in 30 yrs
- 15 days/yr
Wind risk 4/10 · Minor
- Chance of severe wind over 30 yrs
- 20.0%
Air-quality risk 4/10 · Minor
- Unhealthy air days now
- 4 days/yr
- Unhealthy air days in 30 yrs
- 5 days/yr
Risk factors via First Street. Map © Google.
Why this score? — see what drove the B- grade
The composite is a weighted blend of 9 inputs, each scored 0–100. Each bar is that input's sub-score; the figure is the points it added to the 100-point composite (weight × sub-score).
- Cash flow +25.1/30.0
- ARV discount +15.0/15.0
- DSCR +8.2/10.0
- 1% rule +5.2/10.0
- Livability +3.7/5.0
- Schools +3.6/10.0
- Rent growth +3.5/5.0
- Condition / age +2.5/5.0
- Appreciation +0.0/10.0
$299,000
🖨 Deal sheet (PDF) 📄 Offer letter ✓ Due diligence
Listing remarks
This three-bedroom, two-bathroom detached home offers a terrific opportunity for an investor or handy homeowner looking to build equity. Located on a quiet cul-de-sac, only blocks from Anacostia's bustling commercial corridor, this home has significant potential.
Key facts
- 2,886 sq ft lot
- Built 1920
- Listed 189 days
Property features AI
Exterior
- Parking: On-street parking
- Utilities: Public water; Public sewer; Natural gas hot water
- Home design: Detached property; Estimated year built
- Construction: Brick construction; Brick/mortar foundation; Above-grade and below-grade structures
- Exterior features: No tidal water
Interior
- Bedrooms: 3 bedrooms on the upper level
- Bathrooms: 2 full bathrooms (1 on main level, 1 on upper level)
- Heating & cooling: Hot water heating; Natural gas heating fuel; Window air conditioning units (electric)
- Interior features: Estimated living area; Basement with interior access
Neighborhood map
What this means for you Summary
Snapshot
- This is a 3-bed/2.0-bath single-family listed at $299k.
Deal economics
- At list price, monthly cash flow is $657 ($8k/yr) — positive.
- The deal already cash-flows at list — no discount required.
- Meets the 1% rule at list price ($3k rent vs $299k).
- Recommended offer: $263k (12.0% below list) — sets the bar for market timing.
- Cap rate 8.9% vs local median 2.5% in Washington — top-decile yield for the area; either an underpriced asset or a hidden risk that comps aren't pricing in. Stress-test before assuming the spread holds.
Location & tenants
- Location reads 73/100 on livability (#1 in DC) — a middle-class / working-renter tenant base. Strengths: amenities A+, commute A+, employment A+; Watch: crime F, cost of living F.
- District Of Columbia Public Schools (urban): math 33% / reading 40% proficiency, ranked #8 of 32 in DC (top 25%) — families likely to look elsewhere, expect single-tenant / working-renter base with shorter leases; 65% free/reduced lunch — lower-income household profile, screen leases tightly.
- Market conditions: Rents rising (+3.9%/yr); 296 active listings in the ZIP; 40 comparable units currently listed for rent nearby; rentals at typical pace (median 25d on market — plan ~3-4 weeks tenant-placement turnaround); 1,737 units permitted in District of Columbia in 2024 (1,506 in 5+ unit buildings).
- At $3,046/mo this rent would consume 68% of the median local household income ($54k/yr) (locally 5148% of renters already pay >50% of income on rent) — very limited rent-growth headroom before tenants either downsize or default.
Forward outlook
- Local home prices are declining (-3.0%/yr); year-one equity from $2k of loan paydown is wiped out by about $9k of value loss. Plan a longer hold.
- District of Columbia County population projected at +50% by 2050 — long-run rental-demand tailwind backs the buy-and-hold thesis.
Negotiation context
- It's been on market 189 days — a 12% lower offer ($263k) is reasonable based on typical stale-listing flexibility.
- 3 sale attempts; this cycle's ask has dropped $25k (8%) from the opening price — seller is motivated, your offer sets the floor, not the list.
- Current owner paid $14k; list at $299k implies a 1962% gain — meaningful room to come down on a strong offer.
Risks & watch-outs
- Watch-outs: built in 1920 — expect roof / HVAC / electrical / plumbing capex.
- Climate carrying-cost: major flood risk; extreme-heat days projected 7→15/yr by 2055 (HVAC capex compounding) — expect insurance premiums to compound above CPI over the hold.
Questions for the listing agent
- It's been on market 189 days. Have you received any prior offers? Is the seller open to a 12% concession, seller financing, or rate buy-down credit?
- Built in 1920 — when were the roof, HVAC, electrical panel, plumbing, and water heater last replaced?
- Why hasn't it sold? Are there any deal-killer items the seller is aware of (foundation, flood, title, zoning, code violations)?
- Is there a deadline driving the sale (1031 exchange, divorce, estate, relocation)? That informs how much negotiation room exists.
- Crime grade is F in this area — have there been break-ins, vandalism, or insurance claims at this property in the last 3 years? What carrier currently insures it and at what premium?
- What's the average days-on-market for RENTAL listings here right now (not sales)? A rising rental-DOM trend means longer vacancies and softer asking-rent achievability than the comps imply.
- What's the recent tenant-quality profile in this submarket — average credit score on applications, eviction rate, late-payment / NSF rate, and stable-employment percentage? A property-management company in the area should have these aggregated.
- How much new for-sale + rental construction is in the pipeline within 1–3 miles? Heavy new supply typically softens prices + rents 12–24 months out; constrained supply supports both.
Investment metrics
- 1% rule
- 1.02% ✓
- Cap rate
- 8.93%
- Cash-on-cash
- 9.42%
- DSCR
- 1.42
- GRM
- 8.2
CMA / ARV
- ARV (on-the-fly)
- $413,640
- Comps found
- 7
Show comp detail 7 sales within ~0.75 mi
| Address | Dist | Beds/Ba | Sqft | Sold | Price | $/sf | Match |
|---|---|---|---|---|---|---|---|
| 1226 U St SE | 0.22mi | 3/1.0 | 1,477 (-4%) | 0mo | $290,000 | $196 | 79 |
| 1317 W St SE | 0.06mi | 3/1.5 | 1,584 (+3%) | 18mo | $278,250 | $176 | 75 |
| 2016 14th St SE | 0.16mi | 3/3.5 | 1,516 (-1%) | 13mo | $581,600 | $384 | 74 |
| 1340 Valley Pl SE | 0.04mi | 3/1.5 | 1,444 (-6%) | 22mo | $535,000 | $370 | 69 |
| 1724 W St SE | 0.38mi | 4/2.5 (+1) | 1,479 (-4%) | 3mo | $400,000 | $270 | 67 |
| 1650 U St SE | 0.38mi | 3/1.5 | 1,620 (+6%) | 18mo | $434,000 | $268 | 55 |
| 1518 W St SE | 0.20mi | 2/1.5 (-1) | 1,714 (+12%) | 12mo | $485,000 | $283 | 54 |
Match score weights: distance 35% · size 25% · config 20% · recency 20%. Top-matched comps best support the ARV.
Projected returns pro-forma
-3.0% appreciation · 3.86% rent growth · sell at horizon
- IRR
- -1.3%
- Equity multiple
- 0.95×
- Total profit
- $-4,098
- Equity at exit
- $44,582
- IRR
- 9.2%
- Equity multiple
- 1.73×
- Total profit
- $60,806
- Equity at exit
- $25,852
Cash invested: $83,720 (down + closing). Projections, not guarantees.
Landlord ↔ Tenant lean methodology
- Overall (CITY)
- 0 Strongly Tenant-Friendly
- State District of Columbia
- 12 Strongly Tenant-Friendly · D+43
- County
- — inherits STATE
- City Washington
- 0 Strongly Tenant-Friendly · D+43
ZIP-level market 20020
- Rents YoY
- 3.9%
- Active inventory
- 296
- Price-to-rent
- 8.2×
Monthly cashflow live
- Estimated rent
- $3,046 high interval (Pro) →
- Mortgage (P&I)
- −$1,568
- Tax from tax record
- −$56 /mo · $677/yr
- Insurance
- −$125
- HOA
- −$0
- Vacancy / Maint / Mgmt
- −$640
- Net cashflow
- $657
Break-even live
Sensitivity live
| Price | -10% $826 | -5% $742 | +0% $657 | +5% $572 | +10% $488 |
|---|---|---|---|---|---|
| Rent | -10% $416 | -5% $537 | +0% $657 | +5% $777 | +10% $898 |
| Rate | -1.0pp $808 | -0.5pp $733 | base $657 | +0.5pp $580 | +1.0pp $501 |
UW: 25.0% down · 7.5% · 30yr · 1.5% tax · 5.0% vac · 8.0% maint · 8.0% mgmt
Financing live
Cash to close
- Down payment
- $74,750
- Closing costs
- $8,970
- Reserves months
- —
- Total cash needed
- —
Loan-product check · same deal, 3 products live
Conventional
25% down · 7.5% · 30yr
- Down + closing
- —
- Monthly P&I
- —
- Monthly cashflow
- —
- DSCR
- —
- Eligible?
- —
Personal DTI + credit; lowest rate.
DSCR
20% down · 8.5% · 30yr
- Down + closing
- —
- Monthly P&I
- —
- Monthly cashflow
- —
- DSCR
- —
- Eligible?
- —
No personal income docs; deal must DSCR.
Hard money
10% down · 12.0% · 12mo
- Down + closing
- —
- Monthly P&I
- —
- Monthly cashflow
- —
- DSCR
- —
- Eligible?
- —
Short-term bridge; refi at stabilization.
Rent comps 40 comps
| Address | Beds | Baths | Sqft | Rent | $/sqft | DOM | Units | Dist |
|---|---|---|---|---|---|---|---|---|
| 2227 14th St SE Washington, DC | 3.0 | 1.0 | 1222 | $2,495 | $2.04 | 25d | 1 | 0.05mi |
| 1325 Valley Pl SE Washington, DC | 4.0 | 2.0 | 2138 | $6,500 | $3.04 | 25d | 1 | 0.06mi |
| 1328 Morris Rd SE Washington, DC | 3.0 | 2.5 | 1372 | $3,250 | $2.37 | 18d | 1 | 0.16mi |
| 1351 Morris Rd SE Unit Upstairs Washington, DC | 3.0 | 2.0 | 1522 | $2,700 | $1.77 | 5d | 1 | 0.18mi |
| 1505 West St SE Unit 1 Washington, DC | 3.0 | 2.5 | 2100 | $3,300 | $1.57 | 2d | 1 | 0.19mi |
| 1430 V St SE Washington, DC | 3.0 | 2.0 | 1680 | $3,100 | $1.85 | 25d | 1 | 0.20mi |
| 1308 Talbert Ct SE Washington, DC | 3.0 | 2.5 | 1446 | $2,995 | $2.07 | 6d | 1 | 0.21mi |
| 1300 Dexter Ter SE Washington, DC | 2.0 | 1.5 | 1100 | $2,600 | $2.36 | 25d | 1 | 0.23mi |
| 1214 U St SE Washington, DC | 3.0 | 2.5 | 1350 | $3,375 | $2.50 | 25d | 1 | 0.26mi |
| 2322 Shannon Pl SE Washington, DC | 3.0 | 3.5 | 1800 | $2,800 | $1.56 | 25d | 1 | 0.30mi |
| 2648 Bowen Rd SE Washington, DC | 3.0 | 1.5 | 1220 | $2,500 | $2.05 | 25d | 1 | 0.31mi |
| 1516 Marion Barry Ave SE Unit 301 Washington, DC | 3.0 | 2.0 | 1100 | $1,795 | $1.63 | 8d | 1 | 0.32mi |
| 1919 16th St SE Washington, DC | 3.0 | 1.5 | 1920 | $2,100 | $1.09 | 25d | 1 | 0.35mi |
| 1527 Morris Rd SE Washington, DC | 3.0 | 2.5 | 1508 | $2,700 | $1.79 | 8d | 1 | 0.36mi |
| 2501 Sayles Pl SE #9 Washington, DC | 2.0 | 2.0 | 1157 | $2,500 | $2.16 | 25d | 1 | 0.36mi |
| 2501 Sayles Pl SE #9 Washington, DC | 2.0 | 2.0 | 1157 | $2,500 | $2.16 | 11d | 1 | 0.36mi |
| 1802 14th St SE Washington, DC | 3.0 | 2.0 | 1800 | $2,800 | $1.56 | 25d | 1 | 0.36mi |
| 1705 W St SE Washington, DC | 4.0 | 2.0 | 1550 | $2,500 | $1.61 | 3d | 1 | 0.37mi |
| 1750 Galen St SE Washington, DC | 3.0 | 3.0 | 1138 | $2,300 | $2.02 | 4d | 1 | 0.39mi |
| 1634 Ridge Pl SE Washington, DC | 3.0 | 3.5 | 1248 | $3,200 | $2.56 | 25d | 1 | 0.52mi |
| 2460 James Bank Rd SE Washington, DC | 3.0 | 3.5 | 1687 | $3,190 | $1.89 | 15d | 1 | 0.56mi |
| 2390 Elvans Rd SE Washington, DC | 3.0 | 2.5 | 2176 | $3,190 | $1.47 | 8d | 1 | 0.59mi |
| 2202 U Pl SE Washington, DC | 2.0 | 1.5 | 1232 | $3,500 | $2.84 | 25d | 1 | 0.63mi |
| 1722 Gainesville St SE Washington, DC | 4.0 | 2.5 | 2000 | $3,490 | $1.75 | 25d | 1 | 0.65mi |
| 650 Howard Rd SE Washington, DC | 3.0 | 1.0–2.0 | 852 | $4,431 | $5.20 | 2d | 53 | 0.70mi |
| 2300 Good Hope Rd SE Washington, DC | 2.0 | 1.0–2.0 | 1020 | $1,913 | $1.88 | 25d | 6 | 0.71mi |
| 1938 S St SE Washington, DC | 3.0 | 2.0 | 1522 | $2,999 | $1.97 | 25d | 1 | 0.72mi |
| 1516 18th St SE Washington, DC | 3.0 | 2.0 | 1941 | $3,200 | $1.65 | 25d | 1 | 0.73mi |
| 600 Howard Rd SE Washington, DC | 2.0 | 1.0–2.5 | 805 | $6,344 | $7.88 | 2d | 89 | 0.76mi |
| 2003 Fairlawn Ave SE Washington, DC | 4.0 | 2.0 | 1500 | $5,800 | $3.87 | 3d | 1 | 0.93mi |
| 2320 Minnesota Ave SE Washington, DC | 3.0 | 3.5 | 2052 | $3,150 | $1.54 | 25d | 1 | 1.03mi |
| 1346 4th St SE Washington, DC | 2.0 | 1.0–2.0 | 864 | $4,280 | $4.95 | 2d | 25 | 1.05mi |
| 1851 Tubman Rd SE Washington, DC | 3.0 | 2.0 | 1689 | $3,200 | $1.89 | 25d | 1 | 1.05mi |
| 3243 15th Pl SE Washington, DC | 2.0 | 2.0 | 1248 | $2,500 | $2.00 | 25d | 1 | 1.06mi |
| 1300 4th St SE Washington, DC | 1.0–2.0 | 1.0–2.0 | 820 | $3,799 | $4.63 | 4d | 5 | 1.06mi |
| 1300 4th St SE Washington, DC | 1.0–2.0 | 1.0–2.0 | 820 | $3,799 | $4.63 | 3d | 4 | 1.06mi |
| 1300 4th St SE Washington, DC | 1.0–2.0 | 1.0–2.0 | 854 | $3,950 | $4.63 | 20d | 4 | 1.06mi |
| 1331 4th St SE Washington, DC | 2.0 | 1.0–2.0 | 838 | $5,084 | $6.07 | 2d | 18 | 1.07mi |
| 1122 K St SE Washington, DC | 3.0 | 2.5 | 1540 | $4,000 | $2.60 | 25d | 1 | 1.09mi |
| 924 15th St SE Washington, DC | 2.0 | 2.0 | 1100 | $3,450 | $3.14 | 25d | 1 | 1.10mi |
Listing history 16 events
-
2026-06-18days on market $299,000 Active 189 DOM
-
2026-06-17days on market $299,000 Active 188 DOM
-
2026-06-16days on market $299,000 Active 187 DOM
-
2026-06-15days on market $299,000 Active 186 DOM
-
2026-06-13days on market $299,000 Active 184 DOM
-
2026-06-09days on market $299,000 Active 180 DOM
-
2026-06-08days on market $299,000 Active 179 DOM
-
2026-06-07pricedays on market $299,000 Active 178 DOM
-
2026-04-13status Active
-
2026-04-03status Pending
-
2025-11-24$324,000 Active
-
2025-06-30historical
-
2025-05-21price $360,050
-
2025-03-19price $380,000
-
2025-02-03$420,000 Active
-
1972-08-10soldstatus $14,500
ⓘ Source: listings_history table (triggers on properties + properties_extension) + one-shot
backfill from property_details.listing_events for pre-trigger history.
Tax reassessment forecast DC · Partial reset (capped growth)
- Current annual tax
- $677 · $56/mo
- Projected year-2 tax
- $1,251 · $104/mo
- Expected delta
- +$573/yr (+$48/mo · 84.7%)
ⓘ Screening estimate from a state-policy table — verify with the county assessor before closing.
Climate risk First Street
- Flood 6/10 Major FEMA zone X (unshaded) · 75% chance over 30 yrs
- Wildfire 1/10 Low
- Heat 7/10 Severe 7 d/yr ≥104°F today · 15 d/yr by 30 yrs out
- Wind 4/10 Moderate 20% chance of damaging wind over 30 yrs
- Air quality 4/10 Moderate 4 unhealthy d/yr today · 5 by 30 yrs out
Nearby sold comps map
Loading sold comps map…
Walkable amenities ~0.75 mi
Loading nearby amenities…
Taxation est. · year 1
- Rental income
- $36,547
- − Mortgage interest
- −$16,749
- − Property taxes
- −$677
- − Insurance
- −$1,495
- − Repairs & maintenance
- −$2,924
- − Management
- −$2,924
- − Depreciation
- −$8,698
- Taxable income
- $3,080
- Est. tax owed @ 24.0%
- −$739
- After-tax cash flow
- $7,145/yr
For passive investors: Depreciation is non-cash, so a rental often shows a tax loss while cash-flowing — sheltering income. Rental losses are passive: they offset passive income freely, and up to $25,000/yr can offset ordinary (W-2) income if you actively participate and your MAGI is under $100k (phasing out to $0 by $150k); unused losses carry forward. On sale, claimed depreciation is recaptured at up to 25%, and gains may owe capital-gains tax (a 1031 exchange can defer both). Figures are a year-1 estimate at your 24.0% rate — not tax advice; consult a CPA.
Schools (NCES district)
- District
- District Of Columbia Public Schools
- NCES district ID
- 1100030
- Math proficiency
- 33% ▲ 3.00%
- Reading proficiency
- 40% ▲ 5.00%
- Median HH income
- $67,671
- Composite
- 35.84/100
- National rank
- #9606
- State rank
- #8 of 32 in DC
Livability — Washington
- Score
- 73/100
- State rank
- #1
- US rank
- #5327
Category grades
Schools grade is shown separately in the Schools card above.
Census & demographics
- Census place
- Washington, DC
- County
- District of Columbia · 671,873 people
- City population
- 671,873
- Metro
- Washington-Arlington-Alexandria, DC-VA-MD-WV
- Population (ZIP)
- 53,005
- Household income
- $54,032
- Rent vs Own
- Severe rent burden
- 5148.0
Population outlook (District of Columbia County) Hauer SSP2
- Today (2025)
- 821,926 people
- By 2030
- 899,517 · +9.4%
- By 2040
- 1,061,162 · +29.1%
- By 2050
- 1,231,493 · +49.8%
- By 2075
- 1,603,312 · +95.1%
- By 2100
- 1,847,141 · +124.7%
Race, ethnicity, and origin ACS 2023
- Neighborhood character
- Predominantly Black (90%)
- Race & ethnicity
- Black 90% Two or more races 3% Hispanic / Latino 3% White 3%
- Common ancestry
- Lithuanian 1%
- Foreign-born
- 3% · Canada
- Languages at home
- 95% English-only · Spanish 2% French/Haitian/Cajun 1%
Political lean MEDSL · District of Columbia
- 2024 margin
- Solid D (+86.1) · D 91.2% · R 5.1% · Other 3.8%
- 2008→2024 swing
- +0.1pp no change · 2008: 85.9pp · 2024: 86.1pp
- All cycles
- 2024: D+86.1 2020: D+86.8 2016: D+88.7 2012: D+84.2 2008: D+85.9
Not yet ingested
- Civics
- —
Market trends
- HPI YoY
- ▼ -415.44%
- Current HPI
- 306.5068
- Rent YoY
- ▲ 3.86%
- Metro
- Washington-Arlington-Alexandria, DC-VA-MD-WV
- State GDP YoY
- ▲ 1.33%
- F500 in state
- 6
Industry mix (Fortune 500 HQ in DC)
| Industry | F500 HQs | Revenue |
|---|---|---|
| Financial Services | 1 | $153B |
|
||
| Life Sciences / Industrials | 1 | $25B |
|
||
| Industrial Machinery | 1 | $8B |
|
||
Price history
+2134.5% since first listed8 events — show timeline
- 2026-04-13 Relisted — BRIGHT MLS
- 2026-04-03 Pending — BRIGHT MLS
- 2025-11-24 Listed $324,000 BRIGHT MLS
- 2025-06-30 Listing Removed — BRIGHT MLS
- 2025-05-21 Price Changed $360,050 BRIGHT MLS
- 2025-03-19 Price Changed $380,000 BRIGHT MLS
- 2025-02-03 Listed $420,000 BRIGHT MLS
- 1972-08-10 Sold (Public Records) $14,500 Public Records
Property tax history
+6.5%/yrLatest (2025): $677 · +3.1% YoY. Source: county tax records.
Cash-flow waterfall
monthlySold comps — $/sqft
last 12 mo · ≤1 miLoading sold comps…