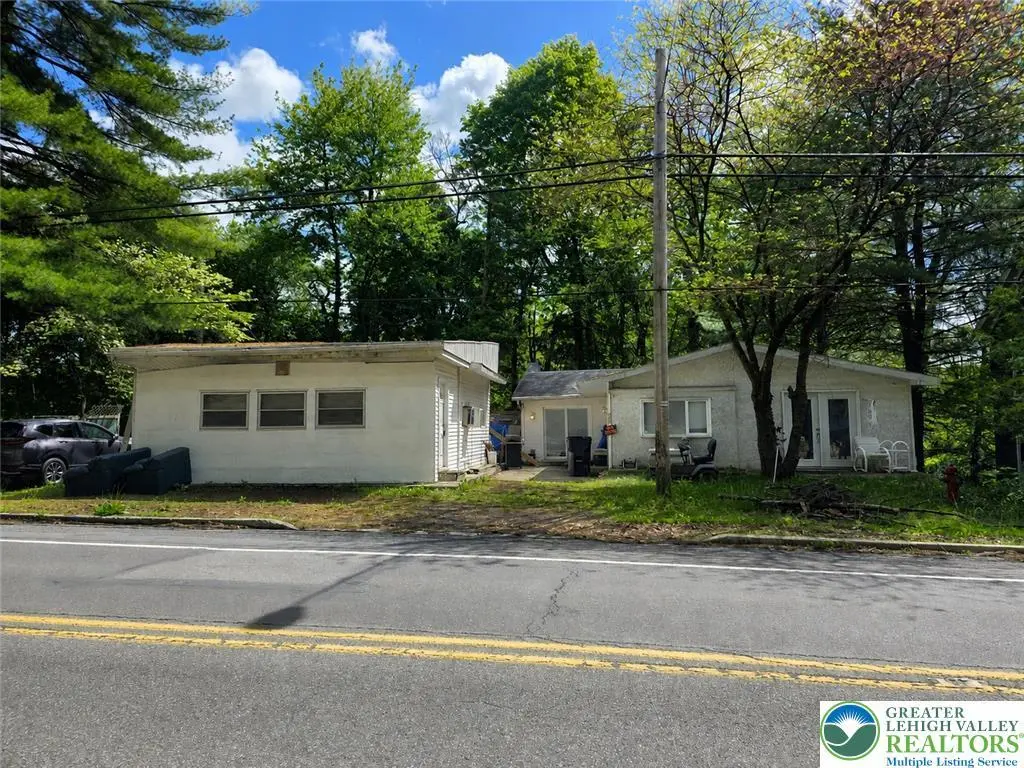
869 N 1st St · Lehighton, PA
Flood risk 1/10 · Minimal
- FEMA flood zone
- X (unshaded)
- Chance of flooding over 30 yrs
- 0.0%
- Est. flood insurance / yr
- $507 – $1,088
Fire risk 1/10 · Minimal
- Est. fire insurance / yr
- $511 – $949
Heat risk 4/10 · Minor
- Hot days now (above 98°F)
- 7 days/yr
- Hot days in 30 yrs
- 15 days/yr
Wind risk 4/10 · Minor
- Chance of severe wind over 30 yrs
- 8.0%
Air-quality risk 2/10 · Minimal
- Unhealthy air days now
- 1 days/yr
- Unhealthy air days in 30 yrs
- 2 days/yr
Risk factors via First Street. Map © Google.
Why this score? — see what drove the B- grade
The composite is a weighted blend of 9 inputs, each scored 0–100. Each bar is that input's sub-score; the figure is the points it added to the 100-point composite (weight × sub-score).
- Cash flow +30.0/30.0
- 1% rule +10.0/10.0
- DSCR +10.0/10.0
- ARV discount +7.5/15.0
- Livability +3.9/5.0
- Schools +3.5/10.0
- Rent growth +2.5/5.0
- Condition / age +2.5/5.0
- Appreciation +0.0/10.0
$100,000
🖨 Deal sheet 📄 Offer letter ✓ Due diligence
Listing remarks
MULTIPLE OFFERS RECEIVED HIGHEST AND BEST DUE FRIDAY MAY 22nd at 3:00PM Opportunity meets potential at 869 N 1st St in Lehighton, PA. Tucked among mature trees and offering a unique layout with flexible living space, this raised ranch is ideal for buyers, investors, flippers, contractors, or anyone looking to bring new life to a property with character and upside. Featuring 3 bedrooms and 1 full bath, the home offers a functional footprint with spacious rooms, multiple living areas, and plenty of natural light throughout. The property is in need of significant renovation and updates, but the possibilities here are hard to ignore for the right buyer with vision. One of the standout features
Key facts
- 0.23 acre lot
- Garage
- Built 1955
Property features AI
Finance
- Financial info: Zoning: R3
Exterior
- Parking: Attached garage (1 car); Carport; Driveway; Off-street parking
- Security: Smoke detector(s)
- Utilities: Public water; Public sewer; Cable available; Electric service with 100 amps and circuit breakers; Electric water heater
- Home design: Single-story home; Slab foundation; Has a view
- Construction: Brick and vinyl siding exterior; Asphalt/fiberglass roof; Year built unknown
- Exterior features: Flat lot with views; Not in a subdivision; Public road frontage; Workshop (outbuilding)
Interior
- Kitchen: Electric cooktop; Electric oven; Electric range; Refrigerator; Eat-in kitchen
- Bedrooms: Bedroom with slider to the outside (First level); Two additional bedrooms (First level)
- Flooring: Carpet; Linoleum
- Bathrooms: One full bathroom with Safe Step walk-in tub and electric heater (First level)
- Heating & cooling: Electric heating; Wall/window cooling units
- Interior features: Eat-in kitchen; Mud room; Utility room; Wired for data; Basement with exterior entry and walk-out access; Partially finished basement; Plumbing rough-in in basement; Safe Step walk-in tub with electric heater; Smoke detector(s)
- Laundry & utility: Washer; Electric dryer; Electric dryer hookup on main level; Utility room
Neighborhood map
What this means for you Summary
Snapshot
- This is a 2-bed/1.0-bath single-family listed at $100k.
Deal economics
- At list price, monthly cash flow is $436 ($5k/yr) — positive.
- The deal already cash-flows at list — no discount required.
- Meets the 1% rule at list price ($2k rent vs $100k).
- Cap rate 11.5% vs local median 4.7% in Lehighton — top-decile yield for the area; either an underpriced asset or a hidden risk that comps aren't pricing in. Stress-test before assuming the spread holds.
Location & tenants
- Location reads 77/100 on livability (#321 in PA, #2,848 nationally) — a middle-class / working-renter tenant base. Strengths: cost of living A+, health & safety A+, crime A-; Watch: employment D, commute F.
- Lehighton Area SD (suburban): math 32% / reading 50% proficiency, ranked #336 of 539 in PA (top 62%) — families likely to look elsewhere, expect single-tenant / working-renter base with shorter leases.
- Market conditions: 139 active listings in the ZIP; 4 comparable units currently listed for rent nearby; rentals leasing fast (median 3d on market — plan ~1-2 weeks tenant-placement turnaround); 180 units permitted in Carbon County in 2024 (10 in 5+ unit buildings).
Forward outlook
- Local home prices are declining (-3.0%/yr); year-one equity from $691 of loan paydown is wiped out by about $3k of value loss. Plan a longer hold.
- Carbon County population projected at -18% by 2050 — secular population decline; favor cash flow + early exit over multi-decade hold.
- At projected returns (-3.0% appreciation + 3.0% rent growth), your $28k cash investment doubles in ~7 years — after that, you're playing with house money.
Negotiation context
- Only 3 days on market — expect competitive offers; lowballing is unlikely to land.
- Current owner paid $20k; list at $100k implies a 400% gain — meaningful room to come down on a strong offer.
Risks & watch-outs
- Watch-outs: built in 1955 — expect roof / HVAC / electrical / plumbing capex.
Questions for the listing agent
- Built in 1955 — when were the roof, HVAC, electrical panel, plumbing, and water heater last replaced?
- Is there a deadline driving the sale (1031 exchange, divorce, estate, relocation)? That informs how much negotiation room exists.
- What's the average days-on-market for RENTAL listings here right now (not sales)? A rising rental-DOM trend means longer vacancies and softer asking-rent achievability than the comps imply.
- What's the recent tenant-quality profile in this submarket — average credit score on applications, eviction rate, late-payment / NSF rate, and stable-employment percentage? A property-management company in the area should have these aggregated.
- How much new for-sale + rental construction is in the pipeline within 1–3 miles? Heavy new supply typically softens prices + rents 12–24 months out; constrained supply supports both.
Investment metrics
- 1% rule
- 1.51% ✓
- Cap rate
- 11.52%
- Cash-on-cash
- 18.67%
- DSCR
- 1.83
- GRM
- 5.5
CMA / ARV
- ARV (on-the-fly)
- $244,200
- Comps found
- 4
Show comp detail 4 sales within ~0.75 mi
| Address | Dist | Beds/Ba | Sqft | Sold | Price | $/sf | Match |
|---|---|---|---|---|---|---|---|
| 92 Packerton Dam Dr | 0.37mi | 2/1.5 | 1,310 (-1%) | 8mo | $245,000 | $187 | 72 |
| 90 Packerton Dam Dr | 0.37mi | 2/1.5 | 1,310 (-1%) | 11mo | $242,000 | $185 | 70 |
| 226 Coal St | 0.62mi | 2/1.5 | 1,277 (-3%) | 11mo | $212,000 | $166 | 55 |
| 65 Spring St | 0.64mi | 2/1.0 | 1,196 (-9%) | 11mo | $40,000 | $33 | 45 |
Match score weights: distance 35% · size 25% · config 20% · recency 20%. Top-matched comps best support the ARV.
Projected returns pro-forma
-3.0% appreciation · 3.0% rent growth · sell at horizon
- IRR
- 10.5%
- Equity multiple
- 1.41×
- Total profit
- $11,609
- Equity at exit
- $14,910
- IRR
- 19.6%
- Equity multiple
- 2.65×
- Total profit
- $46,100
- Equity at exit
- $8,646
Cash invested: $28,000 (down + closing). Projections, not guarantees.
Landlord ↔ Tenant lean methodology
- Overall (STATE)
- 62 Landlord-Friendly
- State Pennsylvania
- 62 Landlord-Friendly · EVEN
- County
- — inherits STATE
- City
- — inherits STATE
ZIP-level market 18235
- Home prices YoY
- -27.1%
- Active inventory
- 139
- Price-to-rent
- 5.5×
Monthly cashflow live
- Estimated rent
- $1,510 medium interval (Pro) →
- Mortgage (P&I)
- −$524
- Tax from tax record
- −$191 /mo · $2,298/yr
- Insurance
- −$42
- HOA
- −$0
- Vacancy / Maint / Mgmt
- −$317
- Net cashflow
- $436
Break-even live
UW: 25.0% down · 7.5% · 30yr · 1.5% tax · 5.0% vac · 8.0% maint · 8.0% mgmt
Financing live
Cash to close
- Down payment
- $25,000
- Closing costs
- $3,000
- Reserves months
- —
- Total cash needed
- —
Loan-product check · same deal, 3 products live
Conventional
25% down · 7.5% · 30yr
- Down + closing
- —
- Monthly P&I
- —
- Monthly cashflow
- —
- DSCR
- —
- Eligible?
- —
Personal DTI + credit; lowest rate.
DSCR
20% down · 8.5% · 30yr
- Down + closing
- —
- Monthly P&I
- —
- Monthly cashflow
- —
- DSCR
- —
- Eligible?
- —
No personal income docs; deal must DSCR.
Hard money
10% down · 12.0% · 12mo
- Down + closing
- —
- Monthly P&I
- —
- Monthly cashflow
- —
- DSCR
- —
- Eligible?
- —
Short-term bridge; refi at stabilization.
Rent comps 4 comps
| Address | Beds | Baths | Sqft | Rent | $/sqft | DOM | Units | Dist |
|---|---|---|---|---|---|---|---|---|
| 339 N 2nd St Lehighton, PA | 3.0 | 1.0 | 1073 | $1,700 | $1.58 | 2d | 1 | 0.55mi |
| 206 N 2nd St Lehighton, PA | 3.0 | 1.0 | 1000 | $1,450 | $1.45 | 2d | 1 | 0.73mi |
| 204 N 2nd St Lehighton, PA | 3.0 | 1.0 | 1000 | $1,600 | $1.60 | 2d | 1 | 0.73mi |
| 318 Bridge St Unit A Weissport, PA | 2.0 | 1.0 | 900 | $975 | $1.08 | 2d | 1 | 1.18mi |
Listing history 2 events
-
2026-05-20$100,000 Active
-
2018-07-02soldstatus $20,000
ⓘ Source: listings_history table (triggers on properties + properties_extension) + one-shot
backfill from property_details.listing_events for pre-trigger history.
Tax reassessment forecast PA · Partial reset (capped growth)
- Current annual tax
- $2,298 · $191/mo
- Projected year-2 tax
- $2,298 · $191/mo
- Expected delta
- $0/yr ($0/mo · 0.0%)
ⓘ Screening estimate from a state-policy table — verify with the county assessor before closing.
Climate risk First Street
- Flood 1/10 Low FEMA zone X (unshaded) · 0% chance over 30 yrs
- Wildfire 1/10 Low
- Heat 4/10 Moderate 7 d/yr ≥98°F today · 15 d/yr by 30 yrs out
- Wind 4/10 Moderate 8% chance of damaging wind over 30 yrs
- Air quality 2/10 Low 1 unhealthy d/yr today · 2 by 30 yrs out
Nearby sold comps map
Loading sold comps map…
Walkable amenities ~0.75 mi
Loading nearby amenities…
Taxation est. · year 1
- Rental income
- $18,126
- − Mortgage interest
- −$5,602
- − Property taxes
- −$2,298
- − Insurance
- −$500
- − Repairs & maintenance
- −$1,450
- − Management
- −$1,450
- − Depreciation
- −$2,909
- Taxable income
- $3,917
- Est. tax owed @ 24.0%
- −$940
- After-tax cash flow
- $4,288/yr
For passive investors: Depreciation is non-cash, so a rental often shows a tax loss while cash-flowing — sheltering income. Rental losses are passive: they offset passive income freely, and up to $25,000/yr can offset ordinary (W-2) income if you actively participate and your MAGI is under $100k (phasing out to $0 by $150k); unused losses carry forward. On sale, claimed depreciation is recaptured at up to 25%, and gains may owe capital-gains tax (a 1031 exchange can defer both). Figures are a year-1 estimate at your 24.0% rate — not tax advice; consult a CPA.
Schools (NCES district)
- District
- Lehighton Area SD
- NCES district ID
- 4213500
- Math proficiency
- 32% ▼ -7.00%
- Reading proficiency
- 50% ▼ -11.00%
- Median HH income
- $51,115
- Composite
- 35.36/100
- National rank
- #4958
- State rank
- #336 of 539 in PA
Livability — Lehighton
- Score
- 77/100
- State rank
- #321
- US rank
- #2848
Category grades
Schools grade is shown separately in the Schools card above.
Census & demographics
- Population (ZIP)
- 19,121
Population outlook (Carbon County) Hauer SSP2
- Today (2025)
- 61,643 people
- By 2030
- 59,840 · -2.9%
- By 2040
- 55,413 · -10.1%
- By 2050
- 50,843 · -17.5%
- By 2075
- 43,326 · -29.7%
- By 2100
- 37,126 · -39.8%
Race, ethnicity, and origin ACS 2023
- Neighborhood character
- Predominantly White (94%)
- Race & ethnicity
- White 94% Two or more races 4% Hispanic / Latino 3%
- Common ancestry
- Romanian 6% Polish 5% Iranian 3%
- Foreign-born
- 2% · Canada, China
- Languages at home
- 96% English-only · Spanish 2% Russian/Polish/Slavic 1%
Political lean MEDSL · Carbon
- 2024 margin
- Solid R (+34.8) · D 32.2% · R 67.0%
- 2008→2024 swing
- -36.7pp toward R · 2008: 1.9pp · 2024: -34.8pp
- All cycles
- 2024: R+34.8 2020: R+32.0 2016: R+34.1 2012: R+6.9 2008: D+1.9
Not yet ingested
- Civics
- —
Market trends
- HPI YoY
- ▼ -69.77%
- Current HPI
- 187.4645
- Rent YoY
- —
- Metro
- —
- State GDP YoY
- ▲ 1.68%
- F500 in state
- 34
Industry mix (Fortune 500 HQ in PA)
| Industry | F500 HQs | Revenue |
|---|---|---|
| Healthcare | 2 | $309B |
|
||
| Insurance | 2 | $27B |
|
||
| Telecommunications / Media | 1 | $124B |
|
||
| Industrial Distribution | 1 | $22B |
|
||
| Financial Services | 1 | $20B |
|
||
| Chemicals / Materials | 1 | $18B |
|
||
Price history
+400.0% since first listed2 events — show timeline
- 2026-05-20 Listed $100,000 GLVRMLS
- 2018-07-02 Sold (Public Records) $20,000 Public Records
Property tax history
+1.8%/yrLatest (2026): $2,298 · +0.8% YoY. Source: county tax records.
Cash-flow waterfall
monthlySold comps — $/sqft
last 12 mo · ≤1 miLoading sold comps…