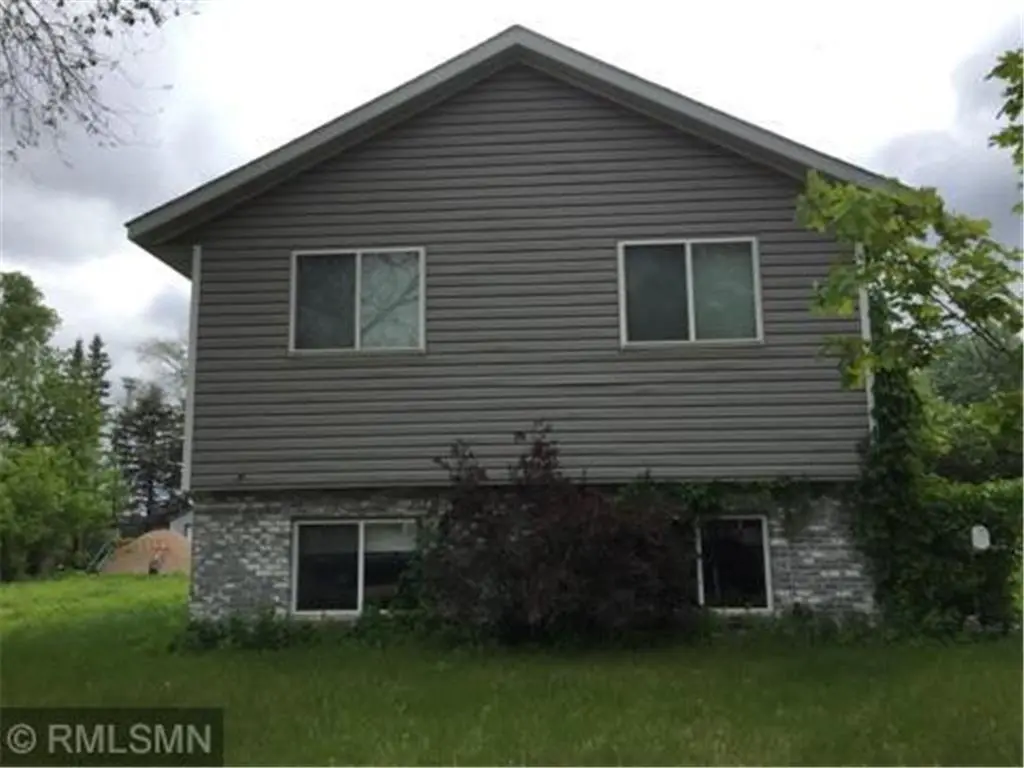
420 19 1/2 Ave N · St. Cloud, MN
Flood risk 1/10 · Minimal
- FEMA flood zone
- X (unshaded)
- Chance of flooding over 30 yrs
- 0.0%
- Est. flood insurance / yr
- $507 – $1,088
Fire risk 1/10 · Minimal
- Est. fire insurance / yr
- $888 – $1,650
Heat risk 2/10 · Minimal
- Hot days now (above 97°F)
- 7 days/yr
- Hot days in 30 yrs
- 13 days/yr
Wind risk 2/10 · Minimal
- Chance of severe wind over 30 yrs
- —
Air-quality risk 3/10 · Minor
- Unhealthy air days now
- 3 days/yr
- Unhealthy air days in 30 yrs
- 3 days/yr
Risk factors via First Street. Map © Google.
Why this score? — see what drove the C- grade
The composite is a weighted blend of 9 inputs, each scored 0–100. Each bar is that input's sub-score; the figure is the points it added to the 100-point composite (weight × sub-score).
- Cash flow +21.3/30.0
- ARV discount +7.5/15.0
- DSCR +6.8/10.0
- 1% rule +6.4/10.0
- Schools +2.8/10.0
- Rent growth +2.5/5.0
- Livability +2.5/5.0
- Condition / age +2.5/5.0
- Appreciation +0.0/10.0
$145,000
🖨 Deal sheet 📄 Offer letter ✓ Due diligence
Listing remarks MLS
Wonderful, centrally located 4 bedroom and 2 bath home. Vaulted ceilings and an open floor plan that gives the home a more spacious feel. Fenced in yard and ready to move in to.
Key facts
- 5,662 sq ft lot
- Built 2002
Neighborhood map
What this means for you Summary
Snapshot
- This is a 4-bed/2.0-bath single-family listed at $145k.
Deal economics
- At list price, monthly cash flow is $211 ($3k/yr) — positive.
- The deal already cash-flows at list — no discount required.
- Meets the 1% rule at list price ($2k rent vs $145k).
- Cap rate 8.0% vs local median 3.9% in St. Cloud — top-decile yield for the area; either an underpriced asset or a hidden risk that comps aren't pricing in. Stress-test before assuming the spread holds.
Location & tenants
- Location reads: area grade C — affects rentability + tenant quality, not the cash-flow math above.
- St. Cloud Public School District (urban): math 27% / reading 38% proficiency, ranked #264 of 301 in MN (top 88%) — families likely to look elsewhere, expect single-tenant / working-renter base with shorter leases.
- Market conditions: 150 active listings in the ZIP; 3 comparable units currently listed for rent nearby; rentals lingering (median 44d on market — plan ~5-8 weeks vacancy on turnover, expect pricing pressure); 100% of comp listings sitting > 30 days — soft ceiling on asking rent; 661 units permitted in Stearns County in 2024 (291 in 5+ unit buildings).
- This rent runs 31% of the median local income ($65k/yr) — at the standard rent-burdened threshold; future hikes will face affordability resistance.
Forward outlook
- Local home prices are declining (-3.0%/yr); year-one equity from $1k of loan paydown is wiped out by about $4k of value loss. Plan a longer hold.
- Stearns County population projected at +9% by 2050 — modest demand growth; plan on rents tracking national, not racing it.
Negotiation context
- Only 0 days on market — expect competitive offers; lowballing is unlikely to land.
- 8 sale attempts since 25y ago with the ask held roughly flat each time — persistent listings suggest the price (not the market) is what's stuck; bring a comps-based counter.
Questions for the listing agent
- Is there a deadline driving the sale (1031 exchange, divorce, estate, relocation)? That informs how much negotiation room exists.
- What's the average days-on-market for RENTAL listings here right now (not sales)? A rising rental-DOM trend means longer vacancies and softer asking-rent achievability than the comps imply.
- What's the recent tenant-quality profile in this submarket — average credit score on applications, eviction rate, late-payment / NSF rate, and stable-employment percentage? A property-management company in the area should have these aggregated.
- How much new for-sale + rental construction is in the pipeline within 1–3 miles? Heavy new supply typically softens prices + rents 12–24 months out; constrained supply supports both.
Investment metrics
- 1% rule
- 1.14% ✓
- Cap rate
- 8.04%
- Cash-on-cash
- 6.25%
- DSCR
- 1.28
- GRM
- 7.3
CMA / ARV
No comps found within radius.
Projected returns pro-forma
-3.0% appreciation · 3.0% rent growth · sell at horizon
- IRR
- -6.6%
- Equity multiple
- 0.75×
- Total profit
- $-9,951
- Equity at exit
- $21,620
- IRR
- 3.1%
- Equity multiple
- 1.22×
- Total profit
- $9,011
- Equity at exit
- $12,537
Cash invested: $40,600 (down + closing). Projections, not guarantees.
Landlord ↔ Tenant lean methodology
- Overall (STATE)
- 46 Balanced
- State Minnesota
- 46 Balanced · D+2
- County
- — inherits STATE
- City
- — inherits STATE
ZIP-level market 56303
- Active inventory
- 150
- Price-to-rent
- 7.3×
Monthly cashflow live
- Estimated rent
- $1,658 medium interval (Pro) →
- Mortgage (P&I)
- −$760
- Tax from tax record
- −$278 /mo · $3,334/yr
- Insurance
- −$60
- HOA
- −$0
- Vacancy / Maint / Mgmt
- −$348
- Net cashflow
- $211
Break-even live
UW: 25.0% down · 7.5% · 30yr · 1.5% tax · 5.0% vac · 8.0% maint · 8.0% mgmt
Financing live
Cash to close
- Down payment
- $36,250
- Closing costs
- $4,350
- Reserves months
- —
- Total cash needed
- —
Loan-product check · same deal, 3 products live
Conventional
25% down · 7.5% · 30yr
- Down + closing
- —
- Monthly P&I
- —
- Monthly cashflow
- —
- DSCR
- —
- Eligible?
- —
Personal DTI + credit; lowest rate.
DSCR
20% down · 8.5% · 30yr
- Down + closing
- —
- Monthly P&I
- —
- Monthly cashflow
- —
- DSCR
- —
- Eligible?
- —
No personal income docs; deal must DSCR.
Hard money
10% down · 12.0% · 12mo
- Down + closing
- —
- Monthly P&I
- —
- Monthly cashflow
- —
- DSCR
- —
- Eligible?
- —
Short-term bridge; refi at stabilization.
Rent comps 3 comps
| Address | Beds | Baths | Sqft | Rent | $/sqft | DOM | Units | Dist |
|---|---|---|---|---|---|---|---|---|
| 444 23rd Ave N Saint Cloud, MN | 3.0 | 2.0 | 1373 | $1,745 | $1.27 | 43d | 1 | 0.25mi |
| 801 15th Ave S Unit 1 St Cloud, MN | 4.0 | 2.0 | 1525 | $1,900 | $1.25 | 43d | 1 | 0.87mi |
| 723 5th Ave S Saint Cloud, MN | 4.0 | 2.5 | 2300 | $1,500 | $0.65 | 43d | 1 | 1.37mi |
Listing history 23 events
-
2025-11-18historical
-
2025-11-18$145,000
-
2018-09-06soldstatus $136,900 Sold 177-char remark
Show marketing remark (177 chars)
Wonderful, centrally located 4 bedroom and 2 bath home. Vaulted ceilings and an open floor plan that gives the home a more spacious feel. Fenced in yard and ready to move in to.
-
2018-09-06soldstatus $136,900
Show marketing remark (177 chars)
Wonderful, centrally located 4 bedroom and 2 bath home. Vaulted ceilings and an open floor plan that gives the home a more spacious feel. Fenced in yard and ready to move in to.
-
2018-08-31status Pending 177-char remark
Show marketing remark (177 chars)
Wonderful, centrally located 4 bedroom and 2 bath home. Vaulted ceilings and an open floor plan that gives the home a more spacious feel. Fenced in yard and ready to move in to.
-
2018-07-16historical Contingent - Inspection 177-char remark
Show marketing remark (177 chars)
Wonderful, centrally located 4 bedroom and 2 bath home. Vaulted ceilings and an open floor plan that gives the home a more spacious feel. Fenced in yard and ready to move in to.
-
2018-07-10status Active 177-char remark
Show marketing remark (177 chars)
Wonderful, centrally located 4 bedroom and 2 bath home. Vaulted ceilings and an open floor plan that gives the home a more spacious feel. Fenced in yard and ready to move in to.
-
2018-06-26status Pending 177-char remark
Show marketing remark (177 chars)
Wonderful, centrally located 4 bedroom and 2 bath home. Vaulted ceilings and an open floor plan that gives the home a more spacious feel. Fenced in yard and ready to move in to.
-
2018-06-18historical Contingent - Inspection 177-char remark
Show marketing remark (177 chars)
Wonderful, centrally located 4 bedroom and 2 bath home. Vaulted ceilings and an open floor plan that gives the home a more spacious feel. Fenced in yard and ready to move in to.
-
2018-06-04$139,900 Active 177-char remark
Show marketing remark (177 chars)
Wonderful, centrally located 4 bedroom and 2 bath home. Vaulted ceilings and an open floor plan that gives the home a more spacious feel. Fenced in yard and ready to move in to.
-
2012-08-23soldstatus $100,000 115-char remark
Show marketing remark (115 chars)
4 BR, 2 BA, Split Level, home features vaulted ceilings, open floor plan, maintenance free exterior. Move in ready!
-
2012-08-23soldstatus $100,000
Show marketing remark (115 chars)
4 BR, 2 BA, Split Level, home features vaulted ceilings, open floor plan, maintenance free exterior. Move in ready!
-
2012-07-25historical 115-char remark
Show marketing remark (115 chars)
4 BR, 2 BA, Split Level, home features vaulted ceilings, open floor plan, maintenance free exterior. Move in ready!
-
2011-12-02$108,500 115-char remark
Show marketing remark (115 chars)
4 BR, 2 BA, Split Level, home features vaulted ceilings, open floor plan, maintenance free exterior. Move in ready!
-
2004-06-11soldstatus $140,000
-
2004-03-25historical
-
2004-02-16$137,900
-
2002-05-01soldstatus $104,400
-
2002-01-25historical
-
2001-12-06$102,900
-
2001-09-25$99,900
-
2001-07-26soldstatus $17,900
-
2001-06-14$17,900
ⓘ Source: listings_history table (triggers on properties + properties_extension) + one-shot
backfill from property_details.listing_events for pre-trigger history.
Tax reassessment forecast MN · Partial reset (capped growth)
- Current annual tax
- $3,334 · $278/mo
- Projected year-2 tax
- $3,334 · $278/mo
- Expected delta
- $0/yr ($0/mo · 0.0%)
ⓘ Screening estimate from a state-policy table — verify with the county assessor before closing.
Climate risk First Street
- Flood 1/10 Low FEMA zone X (unshaded) · 0% chance over 30 yrs
- Wildfire 1/10 Low
- Heat 2/10 Low 7 d/yr ≥97°F today · 13 d/yr by 30 yrs out
- Wind 2/10 Low
- Air quality 3/10 Moderate 3 unhealthy d/yr today · 3 by 30 yrs out
Nearby sold comps map
Loading sold comps map…
Walkable amenities ~0.75 mi
Loading nearby amenities…
Taxation est. · year 1
- Rental income
- $19,899
- − Mortgage interest
- −$8,122
- − Property taxes
- −$3,334
- − Insurance
- −$725
- − Repairs & maintenance
- −$1,592
- − Management
- −$1,592
- − Depreciation
- −$4,218
- Taxable income
- $315
- Est. tax owed @ 24.0%
- −$76
- After-tax cash flow
- $2,460/yr
For passive investors: Depreciation is non-cash, so a rental often shows a tax loss while cash-flowing — sheltering income. Rental losses are passive: they offset passive income freely, and up to $25,000/yr can offset ordinary (W-2) income if you actively participate and your MAGI is under $100k (phasing out to $0 by $150k); unused losses carry forward. On sale, claimed depreciation is recaptured at up to 25%, and gains may owe capital-gains tax (a 1031 exchange can defer both). Figures are a year-1 estimate at your 24.0% rate — not tax advice; consult a CPA.
Schools (NCES district)
- District
- St. Cloud Public School District
- NCES district ID
- 2733510
- Math proficiency
- 27% ▼ -9.00%
- Reading proficiency
- 38% ▼ -5.00%
- Median HH income
- $46,638
- Composite
- 27.91/100
- National rank
- #6866
- State rank
- #264 of 301 in MN
Livability — St. Cloud
No livability data for this city. (Only ~50 U.S. cities are tracked.)
Census & demographics
- Census place
- St. Cloud, MN
- County
- Stearns County · 90,226 people
- City population
- 60,914
- Metro
- St. Cloud, MN
- Population (ZIP)
- 25,827
- Household income
- $65,198
- Rent vs Own
- Severe rent burden
- 887.0
Population outlook (Stearns County) Hauer SSP2
- Today (2025)
- 162,629 people
- By 2030
- 166,495 · +2.4%
- By 2040
- 172,661 · +6.2%
- By 2050
- 177,480 · +9.1%
- By 2075
- 192,907 · +18.6%
- By 2100
- 206,274 · +26.8%
Race, ethnicity, and origin ACS 2023
- Neighborhood character
- Predominantly White (77%)
- Race & ethnicity
- White 77% Black 8% Two or more races 6% Hispanic / Latino 6% Asian 3%
- Hispanic origin (detail)
- Mexican 4%
- Common ancestry
- Portuguese 7% Romanian 4% Lithuanian 2%
- Foreign-born
- 7% · Canada, Vietnam
- Languages at home
- 88% English-only · Spanish 5% French/Haitian/Cajun 1% Other Asian/Pacific 1%
Political lean MEDSL · Stearns
- 2024 margin
- Strong R (+26.8) · D 35.7% · R 62.5% · Other 1.9%
- 2008→2024 swing
- -19.8pp toward R · 2008: -7.0pp · 2024: -26.8pp
- All cycles
- 2024: R+26.8 2020: R+22.5 2016: R+27.9 2012: R+12.1 2008: R+7.0
Not yet ingested
- Civics
- —
Market trends
- HPI YoY
- ▼ -187.45%
- Current HPI
- 135.2097
- Rent YoY
- —
- Metro
- St. Cloud, MN
- State GDP YoY
- ▲ 2.41%
- F500 in state
- 34
Industry mix (Fortune 500 HQ in MN)
| Industry | F500 HQs | Revenue |
|---|---|---|
| Healthcare | 2 | $407B |
|
||
| Retail | 2 | $150B |
|
||
| Consumer Goods | 2 | $32B |
|
||
| Industrial Machinery | 2 | $6B |
|
||
| Agriculture | 1 | $40B |
|
||
| Healthcare / Medical Devices | 1 | $32B |
|
||
Price history
+710.1% since first listed23 events — show timeline
- 2025-11-18 Listed $145,000 NORTHSTARMLS as Distributed by MLS Grid
- 2025-11-18 Listing Removed — NORTHSTARMLS as Distributed by MLS Grid
- 2018-09-06 Sold (Public Records) $136,900 Public Records
- 2018-09-06 Sold (MLS) $136,900 NORTHSTARMLS as Distributed by MLS Grid
- 2018-08-31 Pending — NORTHSTARMLS as Distributed by MLS Grid
- 2018-07-16 Contingent — NORTHSTARMLS as Distributed by MLS Grid
- 2018-07-10 Relisted — NORTHSTARMLS as Distributed by MLS Grid
- 2018-06-26 Pending — NORTHSTARMLS as Distributed by MLS Grid
- 2018-06-18 Contingent — NORTHSTARMLS as Distributed by MLS Grid
- 2018-06-04 Listed $139,900 NORTHSTARMLS as Distributed by MLS Grid
- 2012-08-23 Sold (Public Records) $100,000 Public Records
- 2012-08-23 Sold (MLS) $100,000 NORTHSTARMLS as Distributed by MLS Grid
- 2012-07-25 Listing Removed — NORTHSTARMLS as Distributed by MLS Grid
- 2011-12-02 Listed $108,500 NORTHSTARMLS as Distributed by MLS Grid
- 2004-06-11 Sold (MLS) $140,000 NORTHSTARMLS as Distributed by MLS Grid
- 2004-03-25 Listing Removed — NORTHSTARMLS as Distributed by MLS Grid
- 2004-02-16 Listed $137,900 NORTHSTARMLS as Distributed by MLS Grid
- 2002-05-01 Sold (MLS) $104,400 NORTHSTARMLS as Distributed by MLS Grid
- 2002-01-25 Listing Removed — NORTHSTARMLS as Distributed by MLS Grid
- 2001-12-06 Listed $102,900 NORTHSTARMLS as Distributed by MLS Grid
- 2001-09-25 Listed $99,900 NORTHSTARMLS as Distributed by MLS Grid
- 2001-07-26 Sold (MLS) $17,900 NORTHSTARMLS as Distributed by MLS Grid
- 2001-06-14 Listed $17,900 NORTHSTARMLS as Distributed by MLS Grid
Property tax history
+8.6%/yrLatest (2025): $3,334 · +0.9% YoY. Source: county tax records.
Cash-flow waterfall
monthlySold comps — $/sqft
last 12 mo · ≤1 miLoading sold comps…