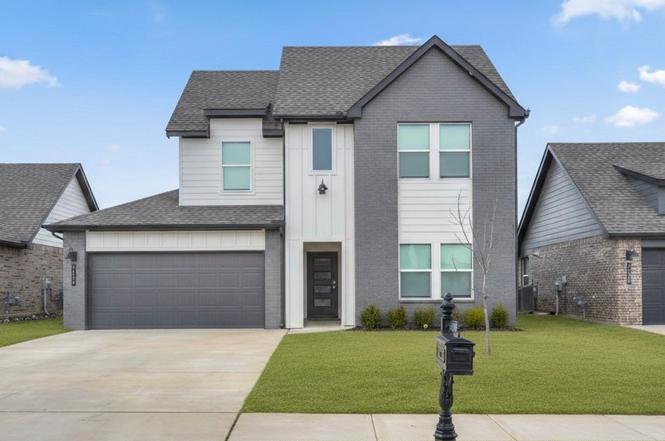
4632 S Chestnut Ave · Broken Arrow, OK
Flood risk No data
- FEMA flood zone
- —
- Chance of flooding over 30 yrs
- —
- Est. flood insurance / yr
- —
Fire risk No data
- Est. fire insurance / yr
- —
Heat risk No data
- Hot days now (above threshold)
- —
- Hot days in 30 yrs
- —
Wind risk No data
- Chance of severe wind over 30 yrs
- —
Air-quality risk No data
- Unhealthy air days now
- —
- Unhealthy air days in 30 yrs
- —
Risk factors via First Street. Map © Google.
Why this score? — see what drove the F grade
The composite is a weighted blend of 9 inputs, each scored 0–100. Each bar is that input's sub-score; the figure is the points it added to the 100-point composite (weight × sub-score).
- Cash flow +11.8/30.0
- Livability +3.9/5.0
- DSCR +3.5/10.0
- Rent growth +3.5/5.0
- 1% rule +3.3/10.0
- ARV discount +3.2/15.0
- Condition / age +2.5/5.0
- Schools +2.4/10.0
- Appreciation +0.0/10.0
$369,900
🖨 Deal sheet 📄 Offer letter ✓ Due diligence
Listing remarks
Welcome to this beautiful 4-bedroom, 3-bath contemporary home located in a sought-after gated addition Village @ 1Eleven within the Broken Arrow School District. Only two years old, this home offers modern design, thoughtful upgrades, and an open-concept layout perfect for everyday living and entertaining. Step inside to a spacious open floor plan featuring a sleek, color-changing electric fireplace that creates the perfect ambiance year-round. The modern kitchen offers ample space, stylish finishes, and flows seamlessly into the main living areas. You’ll love the upgraded lighting throughout the home, including designer fixtures, enhanced ceiling fans, and impressive exterior lightin
Key facts
- Gated addition
- Open floor plan
- Upgraded lighting
Tags
Neighborhood map
What this means for you Summary
Snapshot
- This is a 4-bed/3.0-bath single-family listed at $370k.
Deal economics
- At list price, monthly cash flow is $-104 ($-1k/yr) — negative.
- To cash-flow at today's rent, offer at most $352k (5.0% below list).
- To meet the 1% rule (rent ≥ 1% of price), the offer needs to be $308k (16.8% below list).
- Recommended offer: $308k (16.8% below list) — sets the bar for 1% rule.
- Cap rate 6.0% vs local median 4.0% in Broken Arrow — top-decile yield for the area; either an underpriced asset or a hidden risk that comps aren't pricing in. Stress-test before assuming the spread holds.
Location & tenants
- Location reads 78/100 on livability (#7 in OK, #2,691 nationally) — a middle-class / working-renter tenant base. Strengths: commute A+, cost of living A+, housing A+; Watch: schools D+, amenities F.
- Broken Arrow (suburban): math 23% / reading 28% proficiency, ranked #79 of 270 in OK (top 29%) — low school quality limits family demand, transient renter base, plan for 1-2y turnover.
- Market conditions: Rents rising fast (+4.1%/yr); 381 active listings in the ZIP; 2 comparable units currently listed for rent nearby; solid renter incomes; 2,818 units permitted in Tulsa County in 2024 (518 in 5+ unit buildings).
- This rent runs 37% of the median local income ($99k/yr) — at the standard rent-burdened threshold; future hikes will face affordability resistance.
Forward outlook
- Local home prices are declining (-3.0%/yr); year-one equity from $3k of loan paydown is wiped out by about $11k of value loss. Plan a longer hold.
- Tulsa County population projected at +30% by 2050 — long-run rental-demand tailwind backs the buy-and-hold thesis.
Negotiation context
- It's been on market 69 days — a 6% lower offer ($348k) is reasonable based on typical stale-listing flexibility.
- 3 sale attempts with the ask held roughly flat each time — persistent listings suggest the price (not the market) is what's stuck; bring a comps-based counter.
Questions for the listing agent
- What do current leases actually rent for vs. the listed asking? Can we see a recent rent roll and the last 12 months of T-12 income?
- It's been on market 69 days. Have you received any prior offers? Is the seller open to a 17% concession, seller financing, or rate buy-down credit?
- What does the HOA fee cover, when was the last increase, and are there any pending special assessments or reserve-fund shortfalls?
- Why hasn't it sold? Are there any deal-killer items the seller is aware of (foundation, flood, title, zoning, code violations)?
- Is there a deadline driving the sale (1031 exchange, divorce, estate, relocation)? That informs how much negotiation room exists.
- Schools are D-rated, which usually means shorter tenancies and higher turnover. Who's the typical renter profile here, and what's been the actual vacancy rate?
- The area grade is low — what's the realistic commute time and amenity access for the typical tenant pool here? Any planned neighborhood developments (good or bad) we should know about?
- What's the average days-on-market for RENTAL listings here right now (not sales)? A rising rental-DOM trend means longer vacancies and softer asking-rent achievability than the comps imply.
- What's the recent tenant-quality profile in this submarket — average credit score on applications, eviction rate, late-payment / NSF rate, and stable-employment percentage? A property-management company in the area should have these aggregated.
- How much new for-sale + rental construction is in the pipeline within 1–3 miles? Heavy new supply typically softens prices + rents 12–24 months out; constrained supply supports both.
Investment metrics
- 1% rule
- 0.83% ✗
- Cap rate
- 5.96%
- Cash-on-cash
- -1.20%
- DSCR
- 0.95
- GRM
- 10.0
CMA / ARV
- ARV (on-the-fly)
- $337,440
- Comps found
- 12
Show comp detail 12 sales within ~0.75 mi
| Address | Dist | Beds/Ba | Sqft | Sold | Price | $/sf | Match |
|---|---|---|---|---|---|---|---|
| 4632 S Chestnut Ave | 0.00mi | 4/3.0 | 2,280 (0%) | 1mo | $338,000 | $148 | 99 |
| 4305 S Chestnut Ave | 0.34mi | 4/2.5 | 2,469 (+8%) | 0mo | $340,000 | $138 | 68 |
| 1701 W Inglewood St | 0.64mi | 4/2.5 | 2,190 (-4%) | 1mo | $229,000 | $105 | 61 |
| 1817 W Inglewood St | 0.55mi | 3/2.5 (-1) | 2,370 (+4%) | 2mo | $279,900 | $118 | 60 |
| 1808 W Inglewood St W | 0.56mi | 4/2.5 | 2,497 (+10%) | 0mo | $300,000 | $120 | 56 |
| 4209 S Chestnut Ct | 0.49mi | 4/2.5 | 2,024 (-11%) | 2mo | $339,900 | $168 | 55 |
| 2508 W Roanoke St | 0.67mi | 3/2.5 (-1) | 2,179 (-4%) | 0mo | $195,000 | $89 | 54 |
| 4212 S Oak Ave | 0.73mi | 4/2.0 | 2,120 (-7%) | 3mo | $319,000 | $150 | 48 |
| 5400 S Poplar Ave | 0.67mi | 5/2.5 (+1) | 2,453 (+8%) | 2mo | $325,000 | $132 | 47 |
| 3920 S Elder Blvd | 0.67mi | 3/2.5 (-1) | 2,486 (+9%) | 1mo | $492,295 | $198 | 46 |
| 2722 W Roanoke St | 0.72mi | 3/2.5 (-1) | 2,486 (+9%) | 2mo | $494,900 | $199 | 43 |
| 3908 S Gardenia Ave | 0.71mi | 3/2.5 (-1) | 2,001 (-12%) | 3mo | $465,328 | $233 | 37 |
Match score weights: distance 35% · size 25% · config 20% · recency 20%. Top-matched comps best support the ARV.
Projected returns pro-forma
-3.0% appreciation · 4.09% rent growth · sell at horizon
- IRR
- -17.1%
- Equity multiple
- 0.39×
- Total profit
- $-63,115
- Equity at exit
- $55,153
- IRR
- -7.1%
- Equity multiple
- 0.53×
- Total profit
- $-49,027
- Equity at exit
- $31,982
Cash invested: $103,572 (down + closing). Projections, not guarantees.
Landlord ↔ Tenant lean methodology
- Overall (STATE)
- 83 Strongly Landlord-Friendly
- State Oklahoma
- 83 Strongly Landlord-Friendly · R+20
- County
- — inherits STATE
- City
- — inherits STATE
ZIP-level market 74011
- Rents YoY
- 4.1%
- Active inventory
- 381
- Price-to-rent
- 10.0×
Monthly cashflow live
- Estimated rent
- $3,079 medium interval (Pro) →
- Mortgage (P&I)
- −$1,940
- Tax from tax record
- −$405 /mo · $4,857/yr
- Insurance
- −$154
- HOA
- −$38
- Vacancy / Maint / Mgmt
- −$647
- Net cashflow
- $-104
Break-even live
UW: 25.0% down · 7.5% · 30yr · 1.5% tax · 5.0% vac · 8.0% maint · 8.0% mgmt
Financing live
Cash to close
- Down payment
- $92,475
- Closing costs
- $11,097
- Reserves months
- —
- Total cash needed
- —
Loan-product check · same deal, 3 products live
Conventional
25% down · 7.5% · 30yr
- Down + closing
- —
- Monthly P&I
- —
- Monthly cashflow
- —
- DSCR
- —
- Eligible?
- —
Personal DTI + credit; lowest rate.
DSCR
20% down · 8.5% · 30yr
- Down + closing
- —
- Monthly P&I
- —
- Monthly cashflow
- —
- DSCR
- —
- Eligible?
- —
No personal income docs; deal must DSCR.
Hard money
10% down · 12.0% · 12mo
- Down + closing
- —
- Monthly P&I
- —
- Monthly cashflow
- —
- DSCR
- —
- Eligible?
- —
Short-term bridge; refi at stabilization.
Rent comps 2 comps
| Address | Beds | Baths | Sqft | Rent | $/sqft | DOM | Units | Dist |
|---|---|---|---|---|---|---|---|---|
| 4623 S Chestnut Ave Broken Arrow, OK | 4.0 | 3.0 | 2023 | $3,800 | $1.88 | 19d | 1 | 0.02mi |
| 4308 S Walnut Ave Broken Arrow, OK | 3.0 | 2.5 | 2659 | $2,400 | $0.90 | 23d | 1 | 0.45mi |
HOA detail
- Monthly dues
- $38 · $456/yr
- Likely covers
- electricsecurity
Listing history 10 events
-
2026-04-28status Pending
-
2026-02-18$369,900 Active
-
2026-02-10historical
-
2025-08-28$387,500 Active
-
2025-08-28historical
-
2025-08-13price $387,500
-
2025-06-22price $388,000
-
2025-05-13price $398,900
-
2025-05-01price $399,999
-
2025-02-28$405,000 Active
ⓘ Source: listings_history table (triggers on properties + properties_extension) + one-shot
backfill from property_details.listing_events for pre-trigger history.
Tax reassessment forecast OK · Resets to sale price
- Current annual tax
- $4,857 · $405/mo
- Projected year-2 tax
- $4,857 · $405/mo
- Expected delta
- $0/yr ($0/mo · 0.0%)
ⓘ Screening estimate from a state-policy table — verify with the county assessor before closing.
Nearby sold comps map
Loading sold comps map…
Walkable amenities ~0.75 mi
Loading nearby amenities…
Taxation est. · year 1
- Rental income
- $36,952
- − Mortgage interest
- −$20,720
- − Property taxes
- −$4,857
- − Insurance
- −$1,850
- − Repairs & maintenance
- −$2,956
- − Management
- −$2,956
- − HOA
- −$456
- − Depreciation
- −$10,761
- Taxable loss
- −$7,604
- Est. tax savings @ 24.0%
- +$1,825
- After-tax cash flow
- $577/yr
For passive investors: Depreciation is non-cash, so a rental often shows a tax loss while cash-flowing — sheltering income. Rental losses are passive: they offset passive income freely, and up to $25,000/yr can offset ordinary (W-2) income if you actively participate and your MAGI is under $100k (phasing out to $0 by $150k); unused losses carry forward. On sale, claimed depreciation is recaptured at up to 25%, and gains may owe capital-gains tax (a 1031 exchange can defer both). Figures are a year-1 estimate at your 24.0% rate — not tax advice; consult a CPA.
Schools (NCES district)
- District
- Broken Arrow
- NCES district ID
- 4005490
- Math proficiency
- 23% ▼ -9.00%
- Reading proficiency
- 28% ▼ -9.00%
- Median HH income
- $64,646
- Composite
- 23.86/100
- National rank
- #7801
- State rank
- #79 of 270 in OK
Livability — Broken Arrow
- Score
- 78/100
- State rank
- #7
- US rank
- #2691
Category grades
Schools grade is shown separately in the Schools card above.
Census & demographics
- Census place
- Broken Arrow, OK
- County
- Tulsa County · 640,811 people
- City population
- 144,172
- Metro
- Tulsa, OK
- Population (ZIP)
- 33,900
- Household income
- $99,157
- Rent vs Own
- Severe rent burden
- 389.0
Population outlook (Tulsa County) Hauer SSP2
- Today (2025)
- 723,846 people
- By 2030
- 766,033 · +5.8%
- By 2040
- 851,386 · +17.6%
- By 2050
- 938,389 · +29.6%
- By 2075
- 1,166,011 · +61.1%
- By 2100
- 1,350,277 · +86.5%
Race, ethnicity, and origin ACS 2023
- Neighborhood character
- Predominantly White (68%)
- Race & ethnicity
- White 68% Two or more races 15% Hispanic / Latino 10% Native American 4% Black 4% Asian 3%
- Hispanic origin (detail)
- Mexican 7%
- Common ancestry
- Lithuanian 3% Serbian 2% Slovak 2%
- Foreign-born
- 5% · Canada
- Languages at home
- 93% English-only · Spanish 5% Other Asian/Pacific 1%
Political lean MEDSL · Tulsa
- 2024 margin
- R (+15.2) · D 41.3% · R 56.5% · Other 2.2%
- 2008→2024 swing
- +9.2pp toward D · 2008: -24.5pp · 2024: -15.2pp
- All cycles
- 2024: R+15.2 2020: R+15.6 2016: R+22.9 2012: R+27.4 2008: R+24.5
Not yet ingested
- Civics
- —
Market trends
- HPI YoY
- ▼ -180.15%
- Current HPI
- 210.8302
- Rent YoY
- ▲ 4.09%
- Metro
- Tulsa, OK
- State GDP YoY
- ▲ 1.55%
- F500 in state
- 6
Industry mix (Fortune 500 HQ in OK)
| Industry | F500 HQs | Revenue |
|---|---|---|
| Energy | 3 | $48B |
|
||
Price history
-8.7% since first listed10 events — show timeline
- 2026-04-28 Pending — MLS Technology, Inc.
- 2026-02-18 Listed $369,900 MLS Technology, Inc.
- 2026-02-10 Listing Removed — MLS Technology, Inc.
- 2025-08-28 Listing Removed — MLS Technology, Inc.
- 2025-08-28 Listed $387,500 MLS Technology, Inc.
- 2025-08-13 Price Changed $387,500 MLS Technology, Inc.
- 2025-06-22 Price Changed $388,000 MLS Technology, Inc.
- 2025-05-13 Price Changed $398,900 MLS Technology, Inc.
- 2025-05-01 Price Changed $399,999 MLS Technology, Inc.
- 2025-02-28 Listed $405,000 MLS Technology, Inc.
Property tax history
+390.4%/yrLatest (2025): $4,857 · -10.3% YoY. Source: county tax records.
Cash-flow waterfall
monthlySold comps — $/sqft
last 12 mo · ≤1 miLoading sold comps…