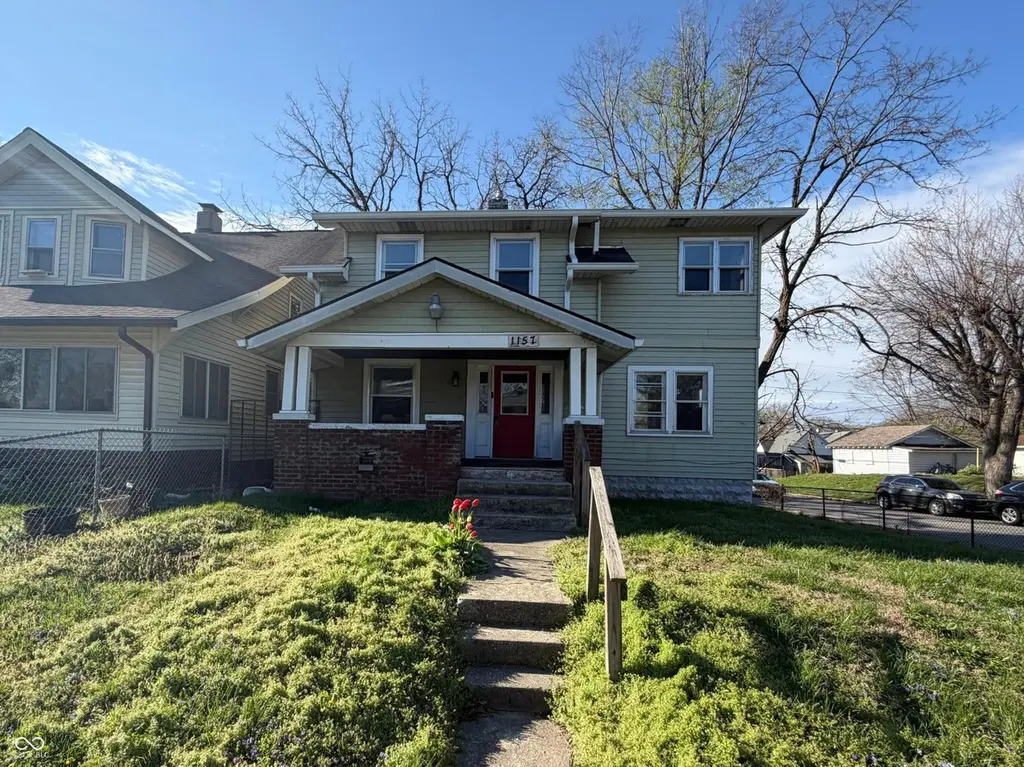
1157 W 32nd St · Indianapolis city (balance), IN
Flood risk 1/10 · Minimal
- FEMA flood zone
- X (unshaded)
- Chance of flooding over 30 yrs
- 0.0%
- Est. flood insurance / yr
- $473 – $860
Fire risk 1/10 · Minimal
- Est. fire insurance / yr
- $717 – $1,331
Heat risk 4/10 · Minor
- Hot days now (above 101°F)
- 7 days/yr
- Hot days in 30 yrs
- 19 days/yr
Wind risk 2/10 · Minimal
- Chance of severe wind over 30 yrs
- 0.0%
Air-quality risk 4/10 · Minor
- Unhealthy air days now
- 5 days/yr
- Unhealthy air days in 30 yrs
- 7 days/yr
Risk factors via First Street. Map © Google.
Why this score? — see what drove the C grade
The composite is a weighted blend of 9 inputs, each scored 0–100. Each bar is that input's sub-score; the figure is the points it added to the 100-point composite (weight × sub-score).
- Cash flow +21.1/30.0
- ARV discount +11.6/15.0
- DSCR +6.7/10.0
- 1% rule +6.0/10.0
- Rent growth +4.1/5.0
- Livability +2.5/5.0
- Condition / age +2.5/5.0
- Schools +1.4/10.0
- Appreciation +0.0/10.0
$135,000
🖨 Deal sheet 📄 Offer letter ✓ Due diligence
Listing remarks MLS
Calling all investors! Don't miss this great opportunity to add to your portfolio with this 3 bedroom, 2 bath home situated on a desirable corner lot. The property features a 2 car detached garage. With a little TLC, this home has strong potential for renovation, rental income, or resale. This property is full of possibilities!
Key facts
- 3,790 sq ft lot
- 2 garage spots
- Built 1910
Neighborhood map
What this means for you Summary
Snapshot
- This is a 3-bed/2.5-bath single-family listed at $135k.
Deal economics
- At list price, monthly cash flow is $193 ($2k/yr) — positive.
- The deal already cash-flows at list — no discount required.
- Meets the 1% rule at list price ($1k rent vs $135k).
- Recommended offer: $127k (6.0% below list) — sets the bar for market timing.
- Cap rate 8.0% vs local median 4.4% in Indianapolis city (balance) — top-decile yield for the area; either an underpriced asset or a hidden risk that comps aren't pricing in. Stress-test before assuming the spread holds.
Location & tenants
- Location reads: area grade C — affects rentability + tenant quality, not the cash-flow math above.
- Indianapolis Public Schools (urban): math 14% / reading 20% proficiency, ranked #286 of 301 in IN (top 95%) — low school quality limits family demand, transient renter base, plan for 1-2y turnover; 77% free/reduced lunch — lower-income household profile, screen leases tightly.
- Market conditions: Rents rising fast (+6.4%/yr); 279 active listings in the ZIP; 40 comparable units currently listed for rent nearby; rentals at typical pace (median 24d on market — plan ~3-4 weeks tenant-placement turnaround); 1,906 units permitted in Marion County in 2024 (621 in 5+ unit buildings).
Forward outlook
- Local home prices are declining (-3.0%/yr); year-one equity from $933 of loan paydown is wiped out by about $4k of value loss. Plan a longer hold.
- Marion County population projected at +18% by 2050 — long-run rental-demand tailwind backs the buy-and-hold thesis.
- At projected returns (-3.0% appreciation + 6.4% rent growth), your $38k cash investment doubles in ~10 years — after that, you're playing with house money.
Negotiation context
- It's been on market 69 days — a 6% lower offer ($127k) is reasonable based on typical stale-listing flexibility.
- 8 sale attempts since 20y ago with the ask held roughly flat each time — persistent listings suggest the price (not the market) is what's stuck; bring a comps-based counter.
- Current owner paid $38k; list at $135k implies a 260% gain — meaningful room to come down on a strong offer.
Risks & watch-outs
- Watch-outs: built in 1910 — expect roof / HVAC / electrical / plumbing capex.
Questions for the listing agent
- It's been on market 69 days. Have you received any prior offers? Is the seller open to a 6% concession, seller financing, or rate buy-down credit?
- Built in 1910 — when were the roof, HVAC, electrical panel, plumbing, and water heater last replaced?
- Why hasn't it sold? Are there any deal-killer items the seller is aware of (foundation, flood, title, zoning, code violations)?
- Is there a deadline driving the sale (1031 exchange, divorce, estate, relocation)? That informs how much negotiation room exists.
- What's the average days-on-market for RENTAL listings here right now (not sales)? A rising rental-DOM trend means longer vacancies and softer asking-rent achievability than the comps imply.
- What's the recent tenant-quality profile in this submarket — average credit score on applications, eviction rate, late-payment / NSF rate, and stable-employment percentage? A property-management company in the area should have these aggregated.
- How much new for-sale + rental construction is in the pipeline within 1–3 miles? Heavy new supply typically softens prices + rents 12–24 months out; constrained supply supports both.
Investment metrics
- 1% rule
- 1.10% ✓
- Cap rate
- 8.00%
- Cash-on-cash
- 6.11%
- DSCR
- 1.27
- GRM
- 7.6
CMA / ARV
- ARV (median comp)
- $148,527
- List price
- $135,000
- Delta
- -9.11%
- Verdict
- FAIR
- Comps
- 20 within 1.0 mi
Show comp detail 12 sales within ~0.75 mi
| Address | Dist | Beds/Ba | Sqft | Sold | Price | $/sf | Match |
|---|---|---|---|---|---|---|---|
| 1229 W 33rd St | 0.09mi | 3/1.0 | 1,485 (+4%) | 6mo | $147,000 | $99 | 78 |
| 713 W 32nd St | 0.52mi | 3/2.0 | 1,417 (-1%) | 1mo | $147,000 | $104 | 72 |
| 1453 W 34th St | 0.36mi | 3/1.0 | 1,528 (+7%) | 1mo | $150,000 | $98 | 65 |
| 3106 N Harding St | 0.28mi | 4/2.0 (+1) | 1,296 (-9%) | 6mo | $160,000 | $123 | 60 |
| 1707 River Shore Pkwy | 0.42mi | 2/2.0 (-1) | 1,316 (-8%) | 1mo | $219,500 | $167 | 59 |
| 1445 W 34th St | 0.35mi | 2/1.0 (-1) | 1,344 (-6%) | 5mo | $48,000 | $36 | 59 |
| 3132 N River Shore Pl | 0.42mi | 3/2.0 | 1,287 (-10%) | 8mo | $209,900 | $163 | 56 |
| 1149 W 36th St | 0.29mi | 2/1.0 (-1) | 1,605 (+13%) | 4mo | $134,000 | $83 | 51 |
| 1226 W 29th St | 0.31mi | 2/1.0 (-1) | 1,616 (+13%) | 1mo | $127,900 | $79 | 51 |
| 1338 W 25th St | 0.72mi | 2/1.0 (-1) | 1,376 (-4%) | 6mo | $83,000 | $60 | 45 |
| 1215 W 25th St | 0.71mi | 2/1.0 (-1) | 1,344 (-6%) | 2mo | $139,000 | $103 | 44 |
| 1354 Roache St | 0.60mi | 3/1.5 | 1,632 (+14%) | 6mo | $55,000 | $34 | 39 |
Match score weights: distance 35% · size 25% · config 20% · recency 20%. Top-matched comps best support the ARV.
Projected returns pro-forma
-3.0% appreciation · 6.43% rent growth · sell at horizon
- IRR
- -2.9%
- Equity multiple
- 0.89×
- Total profit
- $-4,247
- Equity at exit
- $20,129
- IRR
- 10.4%
- Equity multiple
- 1.94×
- Total profit
- $35,705
- Equity at exit
- $11,672
Cash invested: $37,800 (down + closing). Projections, not guarantees.
Landlord ↔ Tenant lean methodology
- Overall (STATE)
- 90 Strongly Landlord-Friendly
- State Indiana
- 90 Strongly Landlord-Friendly · R+11
- County
- — inherits STATE
- City
- — inherits STATE
ZIP-level market 46208
- Rents YoY
- 6.4%
- Active inventory
- 279
- Price-to-rent
- 7.6×
Monthly cashflow live
- Estimated rent
- $1,488 high interval (Pro) →
- Mortgage (P&I)
- −$708
- Tax from tax record
- −$219 /mo · $2,628/yr
- Insurance
- −$56
- HOA
- −$0
- Vacancy / Maint / Mgmt
- −$313
- Net cashflow
- $193
Break-even live
UW: 25.0% down · 7.5% · 30yr · 1.5% tax · 5.0% vac · 8.0% maint · 8.0% mgmt
Financing live
Cash to close
- Down payment
- $33,750
- Closing costs
- $4,050
- Reserves months
- —
- Total cash needed
- —
Loan-product check · same deal, 3 products live
Conventional
25% down · 7.5% · 30yr
- Down + closing
- —
- Monthly P&I
- —
- Monthly cashflow
- —
- DSCR
- —
- Eligible?
- —
Personal DTI + credit; lowest rate.
DSCR
20% down · 8.5% · 30yr
- Down + closing
- —
- Monthly P&I
- —
- Monthly cashflow
- —
- DSCR
- —
- Eligible?
- —
No personal income docs; deal must DSCR.
Hard money
10% down · 12.0% · 12mo
- Down + closing
- —
- Monthly P&I
- —
- Monthly cashflow
- —
- DSCR
- —
- Eligible?
- —
Short-term bridge; refi at stabilization.
Rent comps 40 comps
| Address | Beds | Baths | Sqft | Rent | $/sqft | DOM | Units | Dist |
|---|---|---|---|---|---|---|---|---|
| 1054 W 31st St Unit A Indianapolis, IN | 2.0 | 1.0 | 1200 | $1,500 | $1.25 | 43d | 1 | 0.20mi |
| 3217 Rader St Indianapolis, IN | 3.0 | 1.0 | 1200 | $1,299 | $1.08 | 43d | 1 | 0.27mi |
| 1227 W 29th St Indianapolis, IN | 3.0 | 1.5 | 1056 | $1,250 | $1.18 | 23d | 1 | 0.34mi |
| 926 W 32nd St Indianapolis, IN | 3.0 | 2.0 | 1050 | $1,295 | $1.23 | 7d | 1 | 0.35mi |
| 962 W 35th St Indianapolis, IN | 2.0 | 1.0 | 1768 | $1,195 | $0.68 | 2d | 1 | 0.36mi |
| 3057 Armory Dr Indianapolis, IN | 2.0 | 1.5 | 1674 | $1,495 | $0.89 | 7d | 1 | 0.52mi |
| 3057 Armory Dr Indianapolis, IN | 2.0 | 2.0 | 1674 | $1,695 | $1.01 | 43d | 1 | 0.52mi |
| 826 W 29th St Indianapolis, IN | 3.0 | 2.0 | 1200 | $1,595 | $1.33 | 43d | 1 | 0.57mi |
| 824 W 29th St Indianapolis, IN | 3.0 | 2.0 | 1200 | $1,595 | $1.33 | 43d | 1 | 0.59mi |
| 648 W 30th St Indianapolis, IN | 3.0 | 2.0 | 1300 | $1,500 | $1.15 | 23d | 1 | 0.61mi |
| 1244 Edgemont Ave Indianapolis, IN | 2.0 | 1.0 | 1092 | $1,275 | $1.17 | 43d | 1 | 0.76mi |
| 3017 Ethel Ave Indianapolis, IN | 3.0 | 1.5 | 1079 | $1,400 | $1.30 | 23d | 1 | 0.77mi |
| 560 Udell St Indianapolis, IN | 3.0 | 1.5 | 1176 | $1,190 | $1.01 | 23d | 1 | 0.78mi |
| 538 W 29th St Indianapolis, IN | 3.0 | 1.0 | 1132 | $1,349 | $1.19 | 23d | 1 | 0.79mi |
| 1343 Edgemont Ave Indianapolis, IN | 4.0 | 2.0 | 1545 | $2,095 | $1.36 | 43d | 1 | 0.81mi |
| 516 W 28th St Indianapolis, IN | 2.0 | 1.0 | 1005 | $1,100 | $1.09 | 23d | 1 | 0.88mi |
| 906 Burdsal Pkwy Indianapolis, IN | 2.0 | 1.0 | 936 | $1,295 | $1.38 | 23d | 1 | 0.90mi |
| 908 Burdsal Pkwy Marion, IN | 2.0 | 1.0 | 936 | $1,300 | $1.39 | 23d | 1 | 0.90mi |
| 2248 N Harding St Indianapolis, IN | 2.0 | 1.0 | 1100 | $899 | $0.82 | 23d | 1 | 1.00mi |
| 1367 W Pruitt St Indianapolis, IN | 3.0 | 1.0 | 1088 | $1,450 | $1.33 | 43d | 1 | 1.02mi |
| 3031 Boulevard Pl Indianapolis, IN | 3.0 | 1.5 | 1395 | $1,450 | $1.04 | 17d | 1 | 1.04mi |
| 1415 W Pruitt St Indianapolis, IN | 3.0 | 1.0 | 1001 | $1,249 | $1.25 | 23d | 1 | 1.06mi |
| 445 W 25th St Indianapolis, IN | 4.0 | 2.0 | 1500 | $1,900 | $1.27 | 43d | 1 | 1.10mi |
| 3469 Graceland Ave Indianapolis, IN | 2.0 | 1.0 | 1000 | $1,200 | $1.20 | 43d | 1 | 1.17mi |
| 3413 N Capitol Ave Indianapolis, IN | 3.0 | 1.0 | 1176 | $1,249 | $1.06 | 10d | 1 | 1.20mi |
| 3415 N Capitol Ave Indianapolis, IN | 3.0 | 1.0 | 1176 | $1,249 | $1.06 | 23d | 1 | 1.20mi |
| 2808 N Capitol Ave Indianapolis, IN | 2.0 | 1.0 | 900 | $975 | $1.08 | 23d | 1 | 1.21mi |
| 1135 W 21st St Indianapolis, IN | 3.0 | 2.0 | 1296 | $1,495 | $1.15 | 23d | 1 | 1.23mi |
| 1133 W 21st St Indianapolis, IN | 3.0 | 2.0 | 1296 | $1,495 | $1.15 | 23d | 1 | 1.23mi |
| 143 W 35th St Indianapolis, IN | 3.0 | 1.0 | 1235 | $1,175 | $0.95 | 7d | 1 | 1.24mi |
| 2235 Doctor Martin Luther King Junior St Indianapolis, IN | 3.0 | 1.5 | 948 | $1,700 | $1.79 | 43d | 1 | 1.25mi |
| 3502 N Kenwood Ave Indianapolis, IN | 3.0 | 2.0 | 1094 | $1,220 | $1.12 | 43d | 1 | 1.27mi |
| 3622 N Capitol Ave Indianapolis, IN | 3.0 | 1.0 | 1300 | $1,300 | $1.00 | 7d | 1 | 1.28mi |
| 1920 Sugar Grove Ave Indianapolis, IN | 3.0 | 1.5 | 1378 | $1,175 | $0.85 | 2d | 1 | 1.34mi |
| 608 Bernard Ave Indianapolis, IN | 3.0 | 2.0 | 1056 | $1,475 | $1.40 | 2d | 1 | 1.34mi |
| 320 W 39th St Indianapolis, IN | 4.0 | 2.0 | 1216 | $2,200 | $1.81 | 7d | 1 | 1.35mi |
| 3457 N Illinois St Indianapolis, IN | 3.0 | 2.0 | 1230 | $1,145 | $0.93 | 23d | 1 | 1.35mi |
| 2602 Mansion Dr Indianapolis, IN | 2.0–3.0 | 2.0 | 1850 | $1,675 | $0.91 | 7d | 6 | 1.36mi |
| 3621 N Kenwood Ave Indianapolis, IN | 3.0 | 1.5 | 1521 | $1,599 | $1.05 | 2d | 1 | 1.36mi |
| 3501 N Illinois St Unit 3 Indianapolis, IN | 2.0 | 2.0 | 1087 | $1,350 | $1.24 | 7d | 1 | 1.36mi |
Listing history 36 events
-
2026-06-18days on market $135,000 Active 69 DOM
-
2026-06-17days on market $135,000 Active 68 DOM
-
2026-06-16days on market $135,000 Active 67 DOM
-
2026-06-15days on market $135,000 Active 66 DOM
-
2026-06-13days on market $135,000 Active 64 DOM
-
2026-06-13days on market $135,000 Active 63 DOM
-
2026-06-09days on market $135,000 Active 60 DOM
-
2026-06-08days on market $135,000 Active 59 DOM
-
2026-06-07days on market $135,000 Active 58 DOM
-
2026-06-03days on market $135,000 Active 54 DOM
-
2026-06-02days on market $135,000 Active 53 DOM
-
2026-06-01days on market $135,000 Active 52 DOM
-
2026-05-31days on market $135,000 Active 51 DOM
-
2026-04-10$135,000 Active 329-char remark
Show marketing remark (329 chars)
Calling all investors! Don't miss this great opportunity to add to your portfolio with this 3 bedroom, 2 bath home situated on a desirable corner lot. The property features a 2 car detached garage. With a little TLC, this home has strong potential for renovation, rental income, or resale. This property is full of possibilities!
-
2026-03-09historical $1,495
-
2026-01-15$1,495
-
2026-01-15historical $1,495
-
2025-11-18$1,495
-
2025-11-18historical $1,495
-
2025-03-23$1,495
-
2016-07-01soldstatus $37,500 Sold 124-char remark
Show marketing remark (124 chars)
Great Investment opportunity. 3 bedroom, 2 bath on a corner lot with a 2 car detached garage. Being sold "as-is".
-
2016-05-25status Pending 124-char remark
Show marketing remark (124 chars)
Great Investment opportunity. 3 bedroom, 2 bath on a corner lot with a 2 car detached garage. Being sold "as-is".
-
2016-05-16historical Active with Contingency 124-char remark
Show marketing remark (124 chars)
Great Investment opportunity. 3 bedroom, 2 bath on a corner lot with a 2 car detached garage. Being sold "as-is".
-
2016-04-26price $41,900 124-char remark
Show marketing remark (124 chars)
Great Investment opportunity. 3 bedroom, 2 bath on a corner lot with a 2 car detached garage. Being sold "as-is".
-
2016-01-16$44,900 Active 124-char remark
Show marketing remark (124 chars)
Great Investment opportunity. 3 bedroom, 2 bath on a corner lot with a 2 car detached garage. Being sold "as-is".
-
2015-10-27soldstatus $16,200 Sold
-
2015-09-19status Pending
-
2015-09-01price $27,300
-
2015-07-15price $31,200
-
2015-06-16price $35,100
-
2015-05-06$37,050 Active
-
2009-01-15historical
-
2008-12-30soldstatus $19,000
-
2008-07-25$19,800
-
2006-06-10historical
-
2006-02-21$69,500
ⓘ Source: listings_history table (triggers on properties + properties_extension) + one-shot
backfill from property_details.listing_events for pre-trigger history.
Tax reassessment forecast IN · Partial reset (capped growth)
- Current annual tax
- $2,628 · $219/mo
- Projected year-2 tax
- $2,628 · $219/mo
- Expected delta
- $0/yr ($0/mo · 0.0%)
ⓘ Screening estimate from a state-policy table — verify with the county assessor before closing.
Climate risk First Street
- Flood 1/10 Low FEMA zone X (unshaded) · 0% chance over 30 yrs
- Wildfire 1/10 Low
- Heat 4/10 Moderate 7 d/yr ≥101°F today · 19 d/yr by 30 yrs out
- Wind 2/10 Low 0% chance of damaging wind over 30 yrs
- Air quality 4/10 Moderate 5 unhealthy d/yr today · 7 by 30 yrs out
Nearby sold comps map
Loading sold comps map…
Walkable amenities ~0.75 mi
Loading nearby amenities…
Taxation est. · year 1
- Rental income
- $17,859
- − Mortgage interest
- −$7,562
- − Property taxes
- −$2,628
- − Insurance
- −$675
- − Repairs & maintenance
- −$1,429
- − Management
- −$1,429
- − Depreciation
- −$3,927
- Taxable income
- $210
- Est. tax owed @ 24.0%
- −$50
- After-tax cash flow
- $2,260/yr
For passive investors: Depreciation is non-cash, so a rental often shows a tax loss while cash-flowing — sheltering income. Rental losses are passive: they offset passive income freely, and up to $25,000/yr can offset ordinary (W-2) income if you actively participate and your MAGI is under $100k (phasing out to $0 by $150k); unused losses carry forward. On sale, claimed depreciation is recaptured at up to 25%, and gains may owe capital-gains tax (a 1031 exchange can defer both). Figures are a year-1 estimate at your 24.0% rate — not tax advice; consult a CPA.
Schools (NCES district)
- District
- Indianapolis Public Schools
- NCES district ID
- 1804770
- Math proficiency
- 14% ▼ -7.00%
- Reading proficiency
- 20% ▼ -3.00%
- Median HH income
- $32,034
- Composite
- 13.69/100
- National rank
- #9499
- State rank
- #286 of 301 in IN
Livability — Indianapolis city (balance)
No livability data for this city. (Only ~50 U.S. cities are tracked.)
Census & demographics
- Census place
- Indianapolis city (balance), IN
- County
- Marion County · 998,460 people
- City population
- 881,119
- Metro
- Indianapolis-Carmel-Anderson, IN
- Population (ZIP)
- 22,379
- Household income
- $60,062
- Rent vs Own
- Severe rent burden
- 978.0
Population outlook (Marion County) Hauer SSP2
- Today (2025)
- 1,025,572 people
- By 2030
- 1,065,727 · +3.9%
- By 2040
- 1,141,577 · +11.3%
- By 2050
- 1,208,920 · +17.9%
- By 2075
- 1,367,288 · +33.3%
- By 2100
- 1,438,201 · +40.2%
Race, ethnicity, and origin ACS 2023
- Neighborhood character
- Diverse neighborhood (Simpson 0.62)
- Race & ethnicity
- White 46% Black 40% Hispanic / Latino 8% Two or more races 6% Asian 2%
- Hispanic origin (detail)
- Mexican 4%
- Common ancestry
- Romanian 2% Slovak 2% Italian 1%
- Foreign-born
- 4% · Canada
- Languages at home
- 93% English-only · Spanish 5% French/Haitian/Cajun 1% Other Indo-European 1%
Political lean MEDSL · Marion
- 2024 margin
- Strong D (+27.7) · D 63.0% · R 35.3% · Other 1.7%
- 2008→2024 swing
- -0.7pp no change · 2008: 28.4pp · 2024: 27.7pp
- All cycles
- 2024: D+27.7 2020: D+29.1 2016: D+22.8 2012: D+22.2 2008: D+28.4
Not yet ingested
- Civics
- —
Market trends
- HPI YoY
- ▼ -324.63%
- Current HPI
- 319.7725
- Rent YoY
- ▲ 6.43%
- Metro
- Indianapolis-Carmel-Anderson, IN
- State GDP YoY
- ▲ 2.90%
- F500 in state
- 18
Industry mix (Fortune 500 HQ in IN)
| Industry | F500 HQs | Revenue |
|---|---|---|
| Industrial Machinery | 2 | $37B |
|
||
| Healthcare | 1 | $177B |
|
||
| Pharmaceuticals | 1 | $45B |
|
||
| Metals / Steel | 1 | $18B |
|
||
| Agriculture | 1 | $17B |
|
||
| Packaging | 1 | $12B |
|
||
Price history
+94.2% since first listed23 events — show timeline
- 2026-04-10 Listed $135,000 MIBOR as Distributed by MLS Grid
- 2026-03-09 Rental Removed $1,495 RentEngineListings
- 2026-01-15 Listed for Rent $1,495 RentEngineListings
- 2026-01-15 Rental Removed $1,495 TENANTTURNER2
- 2025-11-18 Listed for Rent $1,495 TENANTTURNER2
- 2025-11-18 Rental Removed $1,495 APPFOLIO
- 2025-03-23 Listed for Rent $1,495 APPFOLIO
- 2016-07-01 Sold (MLS) $37,500 MIBOR as Distributed by MLS Grid
- 2016-05-25 Pending — MIBOR as Distributed by MLS Grid
- 2016-05-16 Contingent — MIBOR as Distributed by MLS Grid
- 2016-04-26 Price Changed $41,900 MIBOR as Distributed by MLS Grid
- 2016-01-16 Listed $44,900 MIBOR as Distributed by MLS Grid
- 2015-10-27 Sold (MLS) $16,200 MIBOR as Distributed by MLS Grid
- 2015-09-19 Pending — MIBOR as Distributed by MLS Grid
- 2015-09-01 Price Changed $27,300 MIBOR as Distributed by MLS Grid
- 2015-07-15 Price Changed $31,200 MIBOR as Distributed by MLS Grid
- 2015-06-16 Price Changed $35,100 MIBOR as Distributed by MLS Grid
- 2015-05-06 Listed $37,050 MIBOR as Distributed by MLS Grid
- 2009-01-15 Listing Removed — MIBOR as Distributed by MLS Grid
- 2008-12-30 Sold (MLS) $19,000 MIBOR as Distributed by MLS Grid
- 2008-07-25 Listed $19,800 MIBOR as Distributed by MLS Grid
- 2006-06-10 Listing Removed — MIBOR as Distributed by MLS Grid
- 2006-02-21 Listed $69,500 MIBOR as Distributed by MLS Grid
Property tax history
+10.6%/yrLatest (2025): $2,628 · -3.7% YoY. Source: county tax records.
Cash-flow waterfall
monthlySold comps — $/sqft
last 12 mo · ≤1 miLoading sold comps…