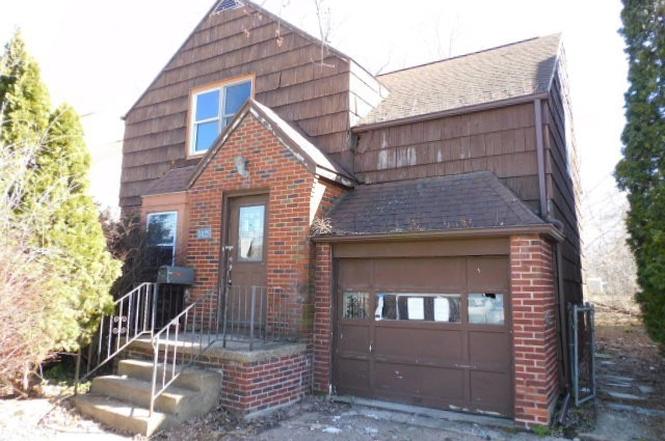
1425 Eggert Rd · Eggertsville, NY
Flood risk 3/10 · Minor
- FEMA flood zone
- X (unshaded)
- Chance of flooding over 30 yrs
- 0.1%
- Est. flood insurance / yr
- $473 – $860
Fire risk 1/10 · Minimal
- Est. fire insurance / yr
- $691 – $1,283
Heat risk 2/10 · Minimal
- Hot days now (above 92°F)
- 7 days/yr
- Hot days in 30 yrs
- 15 days/yr
Wind risk 1/10 · Minimal
- Chance of severe wind over 30 yrs
- —
Air-quality risk 3/10 · Minor
- Unhealthy air days now
- 2 days/yr
- Unhealthy air days in 30 yrs
- 3 days/yr
Risk factors via First Street. Map © Google.
Why this score? — see what drove the B- grade
The composite is a weighted blend of 9 inputs, each scored 0–100. Each bar is that input's sub-score; the figure is the points it added to the 100-point composite (weight × sub-score).
- Cash flow +21.0/30.0
- ARV discount +15.0/15.0
- 1% rule +7.3/10.0
- DSCR +6.7/10.0
- Schools +5.3/10.0
- Rent growth +4.8/5.0
- Livability +4.2/5.0
- Condition / age +2.5/5.0
- Appreciation +0.0/10.0
$164,900
🖨 Deal sheet 📄 Offer letter ✓ Due diligence
Listing remarks
If you're looking for your next project for investment or personal use, this could be it. This home features 3 bedrooms, 1 full bath, a formal dining room and a full basement. Located near Main St and retail and restaurants, you need to check this out. Easy to show!
Key facts
- 0.25 acre lot
- Garage
- Built 1938
Neighborhood map
What this means for you Summary
Snapshot
- This is a 3-bed/1.0-bath single-family listed at $165k.
Deal economics
- At list price, monthly cash flow is $233 ($3k/yr) — positive.
- The deal already cash-flows at list — no discount required.
- Meets the 1% rule at list price ($2k rent vs $165k).
- Recommended offer: $162k (1.5% below list) — sets the bar for market timing.
- Cap rate 8.0% vs local median 4.5% in Eggertsville — top-decile yield for the area; either an underpriced asset or a hidden risk that comps aren't pricing in. Stress-test before assuming the spread holds.
Location & tenants
- Location reads 85/100 on livability (#34 in NY, #534 nationally) — a professional / high-income tenant draw. Strengths: commute A+, housing A+, health & safety A+; Watch: crime C-, amenities C-.
- Amherst Central School District (suburban): math 53% / reading 68% proficiency, ranked #209 of 590 in NY (top 35%) — acceptable for families but not a draw, mixed tenant base, ~2y average lease.
- Market conditions: Rents rising fast (+9.0%/yr); 143 active listings in the ZIP; 11 comparable units currently listed for rent nearby; rentals at typical pace (median 19d on market — plan ~3-4 weeks tenant-placement turnaround); 45% of comp listings sitting > 30 days — soft ceiling on asking rent; solid renter incomes; 1,244 units permitted in Erie County in 2024 (563 in 5+ unit buildings).
Forward outlook
- Local home prices are declining (-3.0%/yr); year-one equity from $1k of loan paydown is wiped out by about $5k of value loss. Plan a longer hold.
- At projected returns (-3.0% appreciation + 8.0% rent growth), your $46k cash investment doubles in ~9 years — after that, you're playing with house money.
Negotiation context
- It's been on market 28 days — a 2% lower offer ($162k) is reasonable based on typical stale-listing flexibility.
Risks & watch-outs
- Watch-outs: property tax is 3.1% of price; built in 1938 — expect roof / HVAC / electrical / plumbing capex.
Questions for the listing agent
- Built in 1938 — when were the roof, HVAC, electrical panel, plumbing, and water heater last replaced?
- Property tax is high relative to price — has the assessment been appealed recently, and will the sale trigger a re-assessment?
- Is there a deadline driving the sale (1031 exchange, divorce, estate, relocation)? That informs how much negotiation room exists.
- Schools are B-rated — typically a magnet for longer-tenancy family renters. What's the average tenant stay here, and is there a school-zone premium baked into asking?
- What's the average days-on-market for RENTAL listings here right now (not sales)? A rising rental-DOM trend means longer vacancies and softer asking-rent achievability than the comps imply.
- What's the recent tenant-quality profile in this submarket — average credit score on applications, eviction rate, late-payment / NSF rate, and stable-employment percentage? A property-management company in the area should have these aggregated.
- How much new for-sale + rental construction is in the pipeline within 1–3 miles? Heavy new supply typically softens prices + rents 12–24 months out; constrained supply supports both.
Investment metrics
- 1% rule
- 1.23% ✓
- Cap rate
- 7.99%
- Cash-on-cash
- 6.06%
- DSCR
- 1.27
- GRM
- 6.8
CMA / ARV
- ARV (on-the-fly)
- $288,236
- Comps found
- 12
Show comp detail 12 sales within ~0.75 mi
| Address | Dist | Beds/Ba | Sqft | Sold | Price | $/sf | Match |
|---|---|---|---|---|---|---|---|
| 1425 Eggert Rd | 0.00mi | 3/1.0 | 1,196 (0%) | 0mo | $165,000 | $138 | 100 |
| 130 Stevenson Blvd | 0.40mi | 3/1.5 | 1,232 (+3%) | 1mo | $347,000 | $282 | 74 |
| 29 Danebrock Dr | 0.34mi | 3/2.0 | 1,237 (+3%) | 1mo | $298,000 | $241 | 73 |
| 233 Crosby Blvd | 0.31mi | 3/2.0 | 1,110 (-7%) | 0mo | $360,000 | $324 | 69 |
| 64 Gresham Dr | 0.44mi | 3/1.0 | 1,245 (+4%) | 5mo | $260,000 | $209 | 68 |
| 414 Longmeadow Rd | 0.39mi | 3/1.0 | 1,111 (-7%) | 3mo | $270,000 | $243 | 67 |
| 206 Lamont Dr | 0.52mi | 4/1.5 (+1) | 1,188 (-1%) | 4mo | $300,000 | $253 | 65 |
| 396 Maynard Dr | 0.56mi | 4/1.0 (+1) | 1,238 (+4%) | 4mo | $226,500 | $183 | 60 |
| 343 Ivyhurst Rd N | 0.48mi | 3/1.0 | 1,067 (-11%) | 4mo | $224,900 | $211 | 56 |
| 329 Springville Ave | 0.61mi | 3/2.0 | 1,306 (+9%) | 0mo | $322,040 | $247 | 52 |
| 49 Canterbury Ct | 0.60mi | 3/1.5 | 1,354 (+13%) | 5mo | $312,000 | $230 | 44 |
| 1789 Eggert Rd | 0.68mi | 3/1.0 | 1,368 (+14%) | 4mo | $235,000 | $172 | 41 |
Match score weights: distance 35% · size 25% · config 20% · recency 20%. Top-matched comps best support the ARV.
Projected returns pro-forma
-3.0% appreciation · 8.0% rent growth · sell at horizon
- IRR
- -0.5%
- Equity multiple
- 0.98×
- Total profit
- $-999
- Equity at exit
- $24,587
- IRR
- 14.4%
- Equity multiple
- 2.46×
- Total profit
- $67,641
- Equity at exit
- $14,258
Cash invested: $46,172 (down + closing). Projections, not guarantees.
Landlord ↔ Tenant lean methodology
- Overall (STATE)
- 15 Strongly Tenant-Friendly
- State New York
- 15 Strongly Tenant-Friendly · D+10
- County
- — inherits STATE
- City
- — inherits STATE
ZIP-level market 14226
- Rents YoY
- 9.0%
- Active inventory
- 143
- Price-to-rent
- 6.8×
Monthly cashflow live
- Estimated rent
- $2,024 high interval (Pro) →
- Mortgage (P&I)
- −$865
- Tax from tax record
- −$433 /mo · $5,192/yr
- Insurance
- −$69
- HOA
- −$0
- Vacancy / Maint / Mgmt
- −$425
- Net cashflow
- $233
Break-even live
UW: 25.0% down · 7.5% · 30yr · 1.5% tax · 5.0% vac · 8.0% maint · 8.0% mgmt
Financing live
Cash to close
- Down payment
- $41,225
- Closing costs
- $4,947
- Reserves months
- —
- Total cash needed
- —
Loan-product check · same deal, 3 products live
Conventional
25% down · 7.5% · 30yr
- Down + closing
- —
- Monthly P&I
- —
- Monthly cashflow
- —
- DSCR
- —
- Eligible?
- —
Personal DTI + credit; lowest rate.
DSCR
20% down · 8.5% · 30yr
- Down + closing
- —
- Monthly P&I
- —
- Monthly cashflow
- —
- DSCR
- —
- Eligible?
- —
No personal income docs; deal must DSCR.
Hard money
10% down · 12.0% · 12mo
- Down + closing
- —
- Monthly P&I
- —
- Monthly cashflow
- —
- DSCR
- —
- Eligible?
- —
Short-term bridge; refi at stabilization.
Rent comps 11 comps
| Address | Beds | Baths | Sqft | Rent | $/sqft | DOM | Units | Dist |
|---|---|---|---|---|---|---|---|---|
| 780 Millersport Hwy Unit 1 Buffalo, NY | 2.0 | 1.0 | 850 | $1,395 | $1.64 | 43d | 1 | 0.58mi |
| 63 Garnet Rd Buffalo, NY | 2.0 | 1.0 | 800 | $1,350 | $1.69 | 43d | 1 | 0.72mi |
| 212 Dellwood Rd Buffalo, NY | 4.0 | 4.0 | 1209 | $3,400 | $2.81 | 1d | 2 | 0.77mi |
| 348 Capen Blvd Buffalo, NY | 3.0 | 1.5 | 1424 | $2,200 | $1.54 | 1d | 1 | 0.87mi |
| 79 Rosemont Dr Buffalo, NY | 2.0 | 1.0 | 1071 | $2,200 | $2.05 | 43d | 1 | 1.13mi |
| 4765 N Bailey Ave Buffalo, NY | 2.0 | 1.0 | 900 | $2,100 | $2.33 | 43d | 1 | 1.33mi |
| 499 Burroughs Dr Unit 5 Amherst, NY | 2.0 | 1.5 | 1200 | $1,800 | $1.50 | 1d | 1 | 1.35mi |
| 4035-4055 Harlem Rd Unit 4081B Buffalo, NY | 2.0 | 1.0 | 815 | $1,649 | $2.02 | 1d | 1 | 1.36mi |
| 60 Englewood Ave Buffalo, NY | 4.0 | 1.0 | 1400 | $1,650 | $1.18 | 1d | 1 | 1.44mi |
| 507 Lisbon Ave Unit 2 Buffalo, NY | 2.0 | 1.0 | 850 | $1,050 | $1.24 | 43d | 1 | 1.44mi |
| 182 Woodcrest Dr Amherst, NY | 3.0 | 1.5 | 1380 | $2,300 | $1.67 | 19d | 1 | 1.45mi |
Listing history 2 events
-
2026-03-29status Pending
-
2026-02-27$164,900 Active
ⓘ Source: listings_history table (triggers on properties + properties_extension) + one-shot
backfill from property_details.listing_events for pre-trigger history.
Tax reassessment forecast NY · Partial reset (capped growth)
- Current annual tax
- $5,192 · $433/mo
- Projected year-2 tax
- $5,192 · $433/mo
- Expected delta
- $0/yr ($0/mo · 0.0%)
ⓘ Screening estimate from a state-policy table — verify with the county assessor before closing.
Climate risk First Street
- Flood 3/10 Moderate FEMA zone X (unshaded) · 10% chance over 30 yrs
- Wildfire 1/10 Low
- Heat 2/10 Low 7 d/yr ≥92°F today · 15 d/yr by 30 yrs out
- Wind 1/10 Low
- Air quality 3/10 Moderate 2 unhealthy d/yr today · 3 by 30 yrs out
Nearby sold comps map
Loading sold comps map…
Walkable amenities ~0.75 mi
Loading nearby amenities…
Taxation est. · year 1
- Rental income
- $24,294
- − Mortgage interest
- −$9,237
- − Property taxes
- −$5,192
- − Insurance
- −$824
- − Repairs & maintenance
- −$1,943
- − Management
- −$1,943
- − Depreciation
- −$4,797
- Taxable income
- $356
- Est. tax owed @ 24.0%
- −$85
- After-tax cash flow
- $2,713/yr
For passive investors: Depreciation is non-cash, so a rental often shows a tax loss while cash-flowing — sheltering income. Rental losses are passive: they offset passive income freely, and up to $25,000/yr can offset ordinary (W-2) income if you actively participate and your MAGI is under $100k (phasing out to $0 by $150k); unused losses carry forward. On sale, claimed depreciation is recaptured at up to 25%, and gains may owe capital-gains tax (a 1031 exchange can defer both). Figures are a year-1 estimate at your 24.0% rate — not tax advice; consult a CPA.
Schools (NCES district)
- District
- Amherst Central School District
- NCES district ID
- 3602920
- Math proficiency
- 53% ▼ -16.00%
- Reading proficiency
- 68% ▲ 4.00%
- Median HH income
- $68,551
- Composite
- 53.21/100
- National rank
- #1502
- State rank
- #209 of 590 in NY
Livability — Eggertsville
- Score
- 85/100
- State rank
- #34
- US rank
- #534
Category grades
Schools grade is shown separately in the Schools card above.
Census & demographics
- Census place
- Eggertsville, NY
- County
- Erie County · 714,559 people
- City population
- 29,482
- Metro
- Buffalo-Cheektowaga, NY
- Population (ZIP)
- 29,159
- Household income
- $84,325
- Rent vs Own
- Severe rent burden
- 856.0
Population outlook (Erie County) Hauer SSP2
- Today (2025)
- 933,037 people
- By 2030
- 935,181 · +0.2%
- By 2040
- 928,531 · -0.5%
- By 2050
- 905,725 · -2.9%
- By 2075
- 834,037 · -10.6%
- By 2100
- 708,033 · -24.1%
Race, ethnicity, and origin ACS 2023
- Neighborhood character
- Predominantly White (74%)
- Race & ethnicity
- White 74% Black 10% Asian 7% Two or more races 6% Hispanic / Latino 5%
- Common ancestry
- Romanian 7% Lithuanian 2% Slovak 1%
- Foreign-born
- 13% · Canada, China, India
- Languages at home
- 87% English-only · Other Indo-European 4% Spanish 2% Arabic 1%
Political lean MEDSL · Erie
- 2024 margin
- Lean D (+9.7) · D 54.8% · R 45.2%
- 2008→2024 swing
- -7.9pp toward R · 2008: 17.5pp · 2024: 9.7pp
- All cycles
- 2024: D+9.7 2020: D+14.7 2016: D+4.8 2012: D+15.6 2008: D+17.5
Not yet ingested
- Civics
- —
Market trends
- HPI YoY
- ▼ -270.71%
- Current HPI
- 331.1929
- Rent YoY
- ▲ 9.01%
- Metro
- Buffalo-Cheektowaga, NY
- State GDP YoY
- ▲ 2.60%
- F500 in state
- 92
Industry mix (Fortune 500 HQ in NY)
| Industry | F500 HQs | Revenue |
|---|---|---|
| Financial Services | 10 | $950B |
|
||
| Consumer Goods | 9 | $162B |
|
||
| Insurance | 4 | $225B |
|
||
| Telecommunications | 2 | $144B |
|
||
| Pharmaceuticals | 2 | $112B |
|
||
| Media / Entertainment | 2 | $69B |
|
||
Price history
2 events — show timeline
- 2026-03-29 Pending — WNYREIS
- 2026-02-27 Listed $164,900 WNYREIS
Property tax history
+6.8%/yrLatest (2025): $5,192 · +8.4% YoY. Source: county tax records.
Cash-flow waterfall
monthlySold comps — $/sqft
last 12 mo · ≤1 miLoading sold comps…