 17-Plex
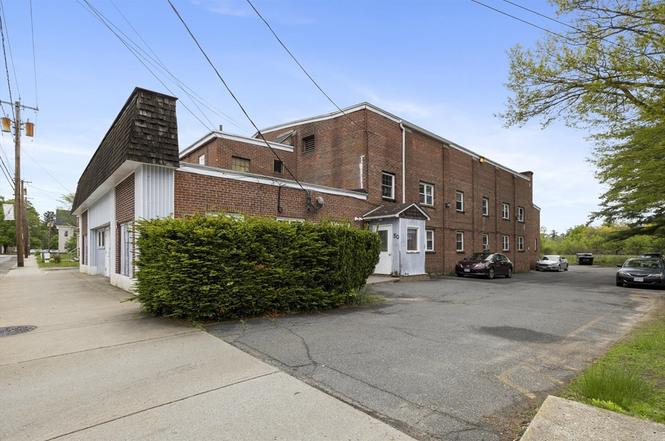
50 E Main St · Orange, MA
Flood risk 10/10 · Severe
- FEMA flood zone
- X (shaded)
- Chance of flooding over 30 yrs
- 0.99%
- Est. flood insurance / yr
- $507 – $1,088
Fire risk 1/10 · Minimal
- Est. fire insurance / yr
- $915 – $1,699
Heat risk 4/10 · Minor
- Hot days now (above 94°F)
- 7 days/yr
- Hot days in 30 yrs
- 18 days/yr
Wind risk 4/10 · Minor
- Chance of severe wind over 30 yrs
- 14.0%
Air-quality risk 2/10 · Minimal
- Unhealthy air days now
- 1 days/yr
- Unhealthy air days in 30 yrs
- 1 days/yr
Risk factors via First Street. Map © Google.
Why this score? — see what drove the C- grade
The composite is a weighted blend of 9 inputs, each scored 0–100. Each bar is that input's sub-score; the figure is the points it added to the 100-point composite (weight × sub-score).
- Cash flow +24.1/30.0
- DSCR +7.8/10.0
- ARV discount +7.5/15.0
- 1% rule +5.0/10.0
- Livability +3.2/5.0
- Rent growth +2.5/5.0
- Schools +2.5/10.0
- Condition / age +2.5/5.0
- Appreciation +0.0/10.0
$3,000,000
🖨 Deal sheet 📄 Offer letter ✓ Due diligence
Multi-family units
County records classify this as Multi-Family (5+ Unit). Listing-text estimate: 17 units. confirmed
5+ unit building — per-unit beds/baths from public records are typically unavailable; the breakdown below (if shown) is an estimate from the listing text.
Listing remarks MLS
This 17-UNIT property houses 2 2BR units, 9 1BR units, and 6 studios, with rents ranging from $551 to $1000. The building is all-electric, fully occupied, and tenants pay all of their own utilities, resulting in a nice NOI. The brick exterior is in good shape, as is the rubber roof. There is no basement. Coin-op laundry onsite. Fire alarm control panel in place. Plenty of off-street parking. Located in downtown Orange for easy access to local stores, commuter routes, and schools.
Key facts
- Newer roof
- Coin-op laundry
- Excellent location
Tags
Property features AI
Finance
- Other: Building area approximately 9,896 total square feet
- HOA & community: Access to public transportation; Nearby medical facility; Nearby laundromat; Highway access; Public schools in area
Exterior
- Parking: 15 parking spaces (open parking)
- Utilities: Public water; Public sewer
- Home design: 5+ unit multi-family (up/down); 2 stories
- Construction: Brick construction; Slab foundation; Built (year per public records)
- Exterior features: Level lot; Public road frontage; Rubber roof; Paved drive; Off-street open parking
Interior
- Bathrooms: 17 full bathrooms
- Heating & cooling: Electric heating; Heating present
- Interior features: 41 total rooms
Neighborhood map
What this means for you Summary
Snapshot
- This is a 17 × 19-bed/17.0-bath units multifamily listed at $3.00M.
Deal economics
- At list price, monthly cash flow is $6k ($70k/yr) — positive. Per door: $344/mo.
- The deal already cash-flows at list — no discount required.
- To meet the 1% rule (rent ≥ 1% of price), the offer needs to be $3.00M (0.0% below list).
- Recommended offer: $2.64M (12.0% below list) — sets the bar for market timing.
- Cap rate 8.7% vs local median 4.2% in Orange — top-decile yield for the area; either an underpriced asset or a hidden risk that comps aren't pricing in. Stress-test before assuming the spread holds.
Location & tenants
- Location reads 63/100 on livability (#197 in MA) — a middle-class / working-renter tenant base. Strengths: housing A+, cost of living A-; Watch: employment C-, health & safety D, schools F.
- Ralph C Mahar (town): math 24% / reading 35% proficiency, ranked #258 of 302 in MA (top 85%) — low school quality limits family demand, transient renter base, plan for 1-2y turnover.
- Market conditions: 21 active listings in the ZIP; 89 units permitted in Franklin County in 2024 (22 in 5+ unit buildings).
Forward outlook
- Local home prices are declining (-3.0%/yr); year-one equity from $21k of loan paydown is wiped out by about $90k of value loss. Plan a longer hold.
- Franklin County population projected at -20% by 2050 — secular population decline; favor cash flow + early exit over multi-decade hold.
Negotiation context
- It's been on market 197 days — a 12% lower offer ($2.64M) is reasonable based on typical stale-listing flexibility.
- 11 sale attempts since 10y ago; this cycle's ask is 181718% above the opening price — seller raised mid-cycle; expect resistance to lowballs.
- Current owner paid $1.50M; list at $3.00M implies a 100% gain — meaningful room to come down on a strong offer.
Risks & watch-outs
- Watch-outs: flood insurance adds $66/mo; built in 1900 — expect roof / HVAC / electrical / plumbing capex.
- Climate carrying-cost: severe flood risk — expect insurance premiums to compound above CPI over the hold.
Questions for the listing agent
- It's been on market 197 days. Have you received any prior offers? Is the seller open to a 12% concession, seller financing, or rate buy-down credit?
- Can we see the unit-by-unit rent roll, current vacancy, and any below-market leases? What's the average tenancy length?
- What capital expenditures (roof, boiler, parking lot, exteriors) have been made in the last 5 years, and what's planned in the next 2?
- Built in 1900 — when were the roof, HVAC, electrical panel, plumbing, and water heater last replaced?
- What's the actual annual flood-insurance premium (NFIP or private), and is the property in a SFHA with mandatory coverage?
- Why hasn't it sold? Are there any deal-killer items the seller is aware of (foundation, flood, title, zoning, code violations)?
- Is there a deadline driving the sale (1031 exchange, divorce, estate, relocation)? That informs how much negotiation room exists.
- Schools are F-rated, which usually means shorter tenancies and higher turnover. Who's the typical renter profile here, and what's been the actual vacancy rate?
- What's the average days-on-market for RENTAL listings here right now (not sales)? A rising rental-DOM trend means longer vacancies and softer asking-rent achievability than the comps imply.
- What's the recent tenant-quality profile in this submarket — average credit score on applications, eviction rate, late-payment / NSF rate, and stable-employment percentage? A property-management company in the area should have these aggregated.
- How much new apartment / multifamily construction is in the pipeline within 1–3 miles? Heavy new supply (>2% of stock underway) typically softens rents 12–24 months out; light construction supports rent growth.
Investment metrics
- 1% rule
- 1.00% ✗
- Cap rate
- 8.66%
- Cash-on-cash
- 8.46%
- DSCR
- 1.38
- GRM
- 8.3
CMA / ARV
No comps found within radius.
Projected returns pro-forma
-3.0% appreciation · 3.0% rent growth · sell at horizon
- IRR
- -3.6%
- Equity multiple
- 0.86×
- Total profit
- $-114,577
- Equity at exit
- $447,310
- IRR
- 6.0%
- Equity multiple
- 1.45×
- Total profit
- $374,976
- Equity at exit
- $259,385
Cash invested: $840,000 (down + closing). Projections, not guarantees.
Landlord ↔ Tenant lean methodology
- Overall (STATE)
- 20 Strongly Tenant-Friendly
- State Massachusetts
- 20 Strongly Tenant-Friendly · D+15
- County
- — inherits STATE
- City
- — inherits STATE
ZIP-level market 01364
- Home prices YoY
- -19.2%
- Active inventory
- 21
- Price-to-rent
- 141.7×
Monthly cashflow live
- Estimated rent
- $29,986 medium interval (Pro) →
- Mortgage (P&I)
- −$15,732
- Tax from tax record
- −$786 /mo · $9,427/yr
- Insurance
- −$1,250
- Flood insurance flood zone
- −$66 /mo · $798/yr
- HOA
- −$0
- Vacancy / Maint / Mgmt
- −$6,297
- Net cashflow
- $5,855
Break-even live
17-unit breakdown (identical units grouped — click to expand)
| Units | Beds | Baths | Est. rent |
|---|---|---|---|
| 17× units | 19 | 17 | $29,988 |
| #1 | 19 | 17 | $1,764 |
| #2 | 19 | 17 | $1,764 |
| #3 | 19 | 17 | $1,764 |
| #4 | 19 | 17 | $1,764 |
| #5 | 19 | 17 | $1,764 |
| #6 | 19 | 17 | $1,764 |
| #7 | 19 | 17 | $1,764 |
| #8 | 19 | 17 | $1,764 |
| #9 | 19 | 17 | $1,764 |
| #10 | 19 | 17 | $1,764 |
| #11 | 19 | 17 | $1,764 |
| #12 | 19 | 17 | $1,764 |
| #13 | 19 | 17 | $1,764 |
| #14 | 19 | 17 | $1,764 |
| #15 | 19 | 17 | $1,764 |
| #16 | 19 | 17 | $1,764 |
| #17 | 19 | 17 | $1,764 |
| Total (17 units) | $29,986 | ||
UW: 25.0% down · 7.5% · 30yr · 1.5% tax · 5.0% vac · 8.0% maint · 8.0% mgmt
Financing live
Cash to close
- Down payment
- $750,000
- Closing costs
- $90,000
- Reserves months
- —
- Total cash needed
- —
Loan-product check · same deal, 3 products live
Conventional
25% down · 7.5% · 30yr
- Down + closing
- —
- Monthly P&I
- —
- Monthly cashflow
- —
- DSCR
- —
- Eligible?
- —
Personal DTI + credit; lowest rate.
DSCR
20% down · 8.5% · 30yr
- Down + closing
- —
- Monthly P&I
- —
- Monthly cashflow
- —
- DSCR
- —
- Eligible?
- —
No personal income docs; deal must DSCR.
Hard money
10% down · 12.0% · 12mo
- Down + closing
- —
- Monthly P&I
- —
- Monthly cashflow
- —
- DSCR
- —
- Eligible?
- —
Short-term bridge; refi at stabilization.
Listing history 40 events
-
2026-06-18days on market $3,000,000 Active 197 DOM
-
2026-06-17days on market $3,000,000 Active 196 DOM
-
2026-06-16days on market $3,000,000 Active 195 DOM
-
2026-06-15days on market $3,000,000 Active 194 DOM
-
2026-06-13days on market $3,000,000 Active 192 DOM
-
2026-06-12days on market $3,000,000 Active 191 DOM
-
2026-06-10days on market $3,000,000 Active 189 DOM
-
2026-06-09days on market $3,000,000 Active 188 DOM
-
2026-06-08days on market $3,000,000 Active 187 DOM
-
2026-06-07days on market $3,000,000 Active 186 DOM
-
2026-06-07days on market $3,000,000 Active 185 DOM
-
2026-06-03days on market $3,000,000 Active 182 DOM
-
2026-06-02days on market $3,000,000 Active 181 DOM
-
2026-06-01days on market $3,000,000 Active 180 DOM
-
2026-05-31days on market $3,000,000 Active 179 DOM
-
2026-05-30days on market $3,000,000 Active 178 DOM
-
2026-05-03historical $1,650
-
2026-04-29$1,650
-
2026-04-28historical $1,350
-
2026-04-02$1,350
-
2025-12-03$3,000,000 New
-
2025-04-25historical $1,350
-
2025-04-11$1,350
-
2025-04-08historical $1,650
-
2025-03-25$1,650
-
2025-03-13historical $1,650
-
2025-03-13$1,650
-
2025-03-08historical $1,650
-
2025-03-08$1,650
-
2025-02-27historical $1,650
-
2025-01-17$1,550
-
2024-05-16soldstatus $1,500,000 Sold 489-char remark
Show marketing remark (489 chars)
This 17-UNIT property houses 2 2BR units, 9 1BR units, and 6 studios, with rents ranging from $551 to $1000. The building is all-electric, fully occupied, and tenants pay all of their own utilities, resulting in a nice NOI. The brick exterior is in good shape, as is the rubber roof. There is no basement. Coin-op laundry onsite. Fire alarm control panel in place. Plenty of off-street parking. Located in downtown Orange for easy access to local stores, commuter routes, and schools.
-
2024-03-07status Under Agreement 489-char remark
Show marketing remark (489 chars)
This 17-UNIT property houses 2 2BR units, 9 1BR units, and 6 studios, with rents ranging from $551 to $1000. The building is all-electric, fully occupied, and tenants pay all of their own utilities, resulting in a nice NOI. The brick exterior is in good shape, as is the rubber roof. There is no basement. Coin-op laundry onsite. Fire alarm control panel in place. Plenty of off-street parking. Located in downtown Orange for easy access to local stores, commuter routes, and schools.
-
2024-03-01historical Contingent 489-char remark
Show marketing remark (489 chars)
This 17-UNIT property houses 2 2BR units, 9 1BR units, and 6 studios, with rents ranging from $551 to $1000. The building is all-electric, fully occupied, and tenants pay all of their own utilities, resulting in a nice NOI. The brick exterior is in good shape, as is the rubber roof. There is no basement. Coin-op laundry onsite. Fire alarm control panel in place. Plenty of off-street parking. Located in downtown Orange for easy access to local stores, commuter routes, and schools.
-
2024-02-21$1,459,000 New 489-char remark
Show marketing remark (489 chars)
This 17-UNIT property houses 2 2BR units, 9 1BR units, and 6 studios, with rents ranging from $551 to $1000. The building is all-electric, fully occupied, and tenants pay all of their own utilities, resulting in a nice NOI. The brick exterior is in good shape, as is the rubber roof. There is no basement. Coin-op laundry onsite. Fire alarm control panel in place. Plenty of off-street parking. Located in downtown Orange for easy access to local stores, commuter routes, and schools.
-
2023-08-14historical $800
-
2023-08-13$800
-
2016-09-09soldstatus $385,000
-
2016-03-10$449,000
-
2002-01-02soldstatus $370,000
ⓘ Source: listings_history table (triggers on properties + properties_extension) + one-shot
backfill from property_details.listing_events for pre-trigger history.
Tax reassessment forecast MA · Partial reset (capped growth)
- Current annual tax
- $9,427 · $786/mo
- Projected year-2 tax
- $23,164 · $1,930/mo
- Expected delta
- +$13,736/yr (+$1,145/mo · 145.7%)
ⓘ Screening estimate from a state-policy table — verify with the county assessor before closing.
Climate risk First Street
- Flood 10/10 Extreme FEMA zone X (shaded) · 99% chance over 30 yrs
- Wildfire 1/10 Low
- Heat 4/10 Moderate 7 d/yr ≥94°F today · 18 d/yr by 30 yrs out
- Wind 4/10 Moderate 14% chance of damaging wind over 30 yrs
- Air quality 2/10 Low 1 unhealthy d/yr today · 1 by 30 yrs out
Nearby sold comps map
Loading sold comps map…
Walkable amenities ~0.75 mi
Loading nearby amenities…
Taxation est. · year 1
- Rental income
- $359,832
- − Mortgage interest
- −$168,047
- − Property taxes
- −$9,427
- − Insurance
- −$15,798
- − Repairs & maintenance
- −$28,787
- − Management
- −$28,787
- − Depreciation
- −$87,273
- Taxable income
- $21,715
- Est. tax owed @ 24.0%
- −$5,212
- After-tax cash flow
- $65,043/yr
For passive investors: Depreciation is non-cash, so a rental often shows a tax loss while cash-flowing — sheltering income. Rental losses are passive: they offset passive income freely, and up to $25,000/yr can offset ordinary (W-2) income if you actively participate and your MAGI is under $100k (phasing out to $0 by $150k); unused losses carry forward. On sale, claimed depreciation is recaptured at up to 25%, and gains may owe capital-gains tax (a 1031 exchange can defer both). Figures are a year-1 estimate at your 24.0% rate — not tax advice; consult a CPA.
Schools (NCES district)
- District
- Ralph C Mahar
- NCES district ID
- 2509900
- Math proficiency
- 24% ▼ -16.00%
- Reading proficiency
- 35% ▼ -12.00%
- Median HH income
- $42,609
- Composite
- 25.05/100
- National rank
- #7544
- State rank
- #258 of 302 in MA
Livability — Orange
- Score
- 63/100
- State rank
- #197
- US rank
- #15360
Category grades
Schools grade is shown separately in the Schools card above.
Census & demographics
- Census place
- Orange, MA
- City population
- 7,668
- Population (ZIP)
- 7,668
Population outlook (Franklin County) Hauer SSP2
- Today (2025)
- 68,566 people
- By 2030
- 66,543 · -3.0%
- By 2040
- 60,766 · -11.4%
- By 2050
- 54,971 · -19.8%
- By 2075
- 42,642 · -37.8%
- By 2100
- 31,861 · -53.5%
Race, ethnicity, and origin ACS 2023
- Neighborhood character
- Predominantly White (89%)
- Race & ethnicity
- White 89% Two or more races 7% Hispanic / Latino 7%
- Hispanic origin (detail)
- Puerto Rican 5%
- Common ancestry
- Lithuanian 12% Romanian 4% Italian 2%
- Foreign-born
- 4% · Canada, Jamaica
- Languages at home
- 94% English-only · Spanish 5%
Political lean MEDSL · Franklin
- 2024 margin
- Solid D (+37.8) · D 67.3% · R 29.6% · Other 3.1%
- 2008→2024 swing
- -9.9pp toward R · 2008: 47.7pp · 2024: 37.8pp
- All cycles
- 2024: D+37.8 2020: D+44.4 2016: D+37.0 2012: D+47.0 2008: D+47.7
Not yet ingested
- Civics
- —
Market trends
- HPI YoY
- ▼ -65.40%
- Current HPI
- 274.2531
- Rent YoY
- —
- Metro
- —
- State GDP YoY
- ▲ 2.28%
- F500 in state
- 38
Industry mix (Fortune 500 HQ in MA)
| Industry | F500 HQs | Revenue |
|---|---|---|
| Technology | 3 | $17B |
|
||
| Insurance | 2 | $84B |
|
||
| Retail | 2 | $76B |
|
||
| Life Sciences | 1 | $43B |
|
||
| Energy Technology | 1 | $31B |
|
||
| Aerospace / Defense | 1 | $18B |
|
||
Price history
-99.6% since first listed24 events — show timeline
- 2026-05-03 Rental Removed $1,650 TURBOTENANT
- 2026-04-29 Listed for Rent $1,650 TURBOTENANT
- 2026-04-28 Rental Removed $1,350 TURBOTENANT
- 2026-04-02 Listed for Rent $1,350 TURBOTENANT
- 2025-12-03 Listed $3,000,000 MLS PIN
- 2025-04-25 Rental Removed $1,350 RENTALBEAST
- 2025-04-11 Listed for Rent $1,350 RENTALBEAST
- 2025-04-08 Rental Removed $1,650 RENTALBEAST
- 2025-03-25 Listed for Rent $1,650 RENTALBEAST
- 2025-03-13 Rental Removed $1,650 TURBOTENANT
- 2025-03-13 Listed for Rent $1,650 TURBOTENANT
- 2025-03-08 Rental Removed $1,650 TURBOTENANT
- 2025-03-08 Listed for Rent $1,650 TURBOTENANT
- 2025-02-27 Rental Removed $1,650 TURBOTENANT
- 2025-01-17 Listed for Rent $1,550 TURBOTENANT
- 2024-05-16 Sold (MLS) $1,500,000 MLS PIN
- 2024-03-07 Pending — MLS PIN
- 2024-03-01 Contingent — MLS PIN
- 2024-02-21 Listed $1,459,000 MLS PIN
- 2023-08-14 Rental Removed $800 LEASESTAR
- 2023-08-13 Listed for Rent $800 LEASESTAR
- 2016-09-09 Sold (MLS) $385,000 MLS PIN
- 2016-03-10 Listed $449,000 MLS PIN
- 2002-01-02 Sold (Public Records) $370,000 Public Records
Property tax history
+3.0%/yrLatest (2023): $9,427 · -6.1% YoY. Source: county tax records.
Cash-flow waterfall
monthlySold comps — $/sqft
last 12 mo · ≤1 miLoading sold comps…