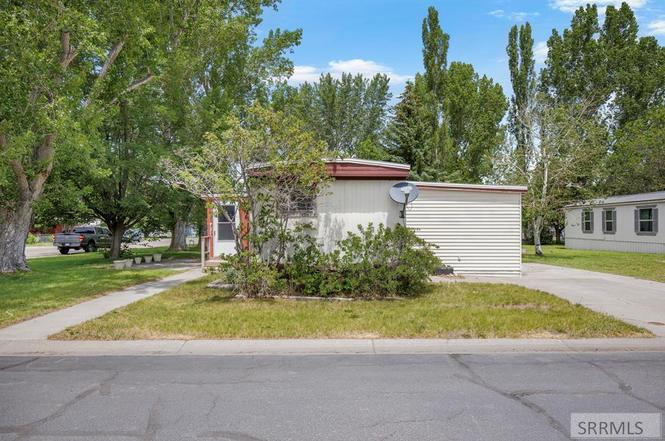
200 Holly St · Rexburg, ID
Flood risk 1/10 · Minimal
- FEMA flood zone
- —
- Chance of flooding over 30 yrs
- 0.0%
- Est. flood insurance / yr
- —
Fire risk 1/10 · Minimal
- Est. fire insurance / yr
- $584 – $1,086
Heat risk 2/10 · Minimal
- Hot days now (above 88°F)
- 8 days/yr
- Hot days in 30 yrs
- 20 days/yr
Wind risk 1/10 · Minimal
- Chance of severe wind over 30 yrs
- —
Air-quality risk 6/10 · Moderate
- Unhealthy air days now
- 9 days/yr
- Unhealthy air days in 30 yrs
- 10 days/yr
Risk factors via First Street. Map © Google.
Why this score? — see what drove the B grade
The composite is a weighted blend of 9 inputs, each scored 0–100. Each bar is that input's sub-score; the figure is the points it added to the 100-point composite (weight × sub-score).
- Cash flow +30.0/30.0
- 1% rule +10.0/10.0
- DSCR +10.0/10.0
- ARV discount +7.5/15.0
- Livability +3.8/5.0
- Schools +3.7/10.0
- Rent growth +3.2/5.0
- Condition / age +2.5/5.0
- Appreciation +0.0/10.0
$72,000
🖨 Deal sheet 📄 Offer letter ✓ Due diligence
Listing remarks
Affordable living in one of Rexburg's most loved communities! Located in Mill Hollow, this 3-bedroom home offers approximately 1,100 square feet of living space with thoughtful additions that create extra room for storage, hobbies, crafting, or everyday living. Inside you'll find a spacious living room with a charming wood stove, a functional kitchen with abundant cabinetry, and a dedicated dining area perfect for gathering with family and friends. Outside, mature trees provide shade and privacy, while the covered patio, storage shed, and oversized yard offer plenty of room to enjoy the outdoors. Mill Hollow is known for its peaceful atmosphere, strong sense of community, and convenient loc
Key facts
- Wood stove
- Covered patio
- Storage shed
Tags
Property features AI
Exterior
- Parking: Concrete parking
- Utilities: Public water; Public sewer
- Home design: Manufactured home (without land); One level / single-story
- Construction: Vinyl siding; Wood siding; Metal roof
- Exterior features: Corner lot; Shed(s)
Interior
- Kitchen: Dishwasher; Refrigerator
- Flooring: Carpet; Laminate
- Bathrooms: 1 full bathroom
- Heating & cooling: Electric heating; Ceiling fan cooling
- Interior features: Dishwasher; Refrigerator; Ceiling fan(s); Fireplace
Neighborhood map
What this means for you Summary
Snapshot
- This is a 3-bed/1.0-bath other listed at $72k.
Deal economics
- At list price, monthly cash flow is $639 ($8k/yr) — positive.
- The deal already cash-flows at list — no discount required.
- Meets the 1% rule at list price ($1k rent vs $72k).
Location & tenants
- Location reads 76/100 on livability (#25 in ID, #3,515 nationally) — a middle-class / working-renter tenant base. Strengths: crime A+, amenities A+, health & safety A+; Watch: housing C-, commute F, employment F.
- Madison District (town): math 44% / reading 47% proficiency, ranked #50 of 92 in ID (top 54%) — families likely to look elsewhere, expect single-tenant / working-renter base with shorter leases.
- Market conditions: Rents rising (+2.6%/yr); 384 active listings in the ZIP; 274 units permitted in Madison County in 2024 (80 in 5+ unit buildings).
Forward outlook
- Local home prices are declining (-3.0%/yr); year-one equity from $498 of loan paydown is wiped out by about $2k of value loss. Plan a longer hold.
- Madison County population projected at +10% by 2050 — modest demand growth; plan on rents tracking national, not racing it.
- At projected returns (-3.0% appreciation + 2.6% rent growth), your $20k cash investment doubles in ~4 years — after that, you're playing with house money.
Negotiation context
- Only 3 days on market — expect competitive offers; lowballing is unlikely to land.
Questions for the listing agent
- Built in 1972 — when were the roof, HVAC, electrical panel, plumbing, and water heater last replaced?
- Is there a deadline driving the sale (1031 exchange, divorce, estate, relocation)? That informs how much negotiation room exists.
- Schools are B-rated — typically a magnet for longer-tenancy family renters. What's the average tenant stay here, and is there a school-zone premium baked into asking?
- What's the average days-on-market for RENTAL listings here right now (not sales)? A rising rental-DOM trend means longer vacancies and softer asking-rent achievability than the comps imply.
- What's the recent tenant-quality profile in this submarket — average credit score on applications, eviction rate, late-payment / NSF rate, and stable-employment percentage? A property-management company in the area should have these aggregated.
- How much new for-sale + rental construction is in the pipeline within 1–3 miles? Heavy new supply typically softens prices + rents 12–24 months out; constrained supply supports both.
Investment metrics
- 1% rule
- 2.00% ✓
- Cap rate
- 16.94%
- Cash-on-cash
- 38.02%
- DSCR
- 2.69
- GRM
- 4.2
CMA / ARV
No comps found within radius.
Projected returns pro-forma
-3.0% appreciation · 2.6% rent growth · sell at horizon
- IRR
- 33.6%
- Equity multiple
- 2.41×
- Total profit
- $28,455
- Equity at exit
- $10,735
- IRR
- 40.3%
- Equity multiple
- 4.72×
- Total profit
- $74,898
- Equity at exit
- $6,225
Cash invested: $20,160 (down + closing). Projections, not guarantees.
Landlord ↔ Tenant lean methodology
- Overall (STATE)
- 91 Strongly Landlord-Friendly
- State Idaho
- 91 Strongly Landlord-Friendly · R+18
- County
- — inherits STATE
- City
- — inherits STATE
ZIP-level market 83440
- Rents YoY
- 2.6%
- Active inventory
- 384
- Price-to-rent
- 4.2×
Monthly cashflow live
- Estimated rent
- $1,438 medium interval (Pro) →
- Mortgage (P&I)
- −$378
- Tax est. 1.5%
- −$90 /mo · $1,080/yr
- Insurance
- −$30
- HOA
- −$0
- Vacancy / Maint / Mgmt
- −$302
- Net cashflow
- $639
Break-even live
UW: 25.0% down · 7.5% · 30yr · 1.5% tax · 5.0% vac · 8.0% maint · 8.0% mgmt
Financing live
Cash to close
- Down payment
- $18,000
- Closing costs
- $2,160
- Reserves months
- —
- Total cash needed
- —
Loan-product check · same deal, 3 products live
Conventional
25% down · 7.5% · 30yr
- Down + closing
- —
- Monthly P&I
- —
- Monthly cashflow
- —
- DSCR
- —
- Eligible?
- —
Personal DTI + credit; lowest rate.
DSCR
20% down · 8.5% · 30yr
- Down + closing
- —
- Monthly P&I
- —
- Monthly cashflow
- —
- DSCR
- —
- Eligible?
- —
No personal income docs; deal must DSCR.
Hard money
10% down · 12.0% · 12mo
- Down + closing
- —
- Monthly P&I
- —
- Monthly cashflow
- —
- DSCR
- —
- Eligible?
- —
Short-term bridge; refi at stabilization.
Listing history 4 events
-
2026-06-19days on market $72,000 Active 3 DOM
-
2026-06-18days on market $72,000 Active 2 DOM
-
2026-06-17remarks 699-char remark
-
2026-06-17$72,000 Active 1 DOM
ⓘ Source: listings_history table (triggers on properties + properties_extension) + one-shot
backfill from property_details.listing_events for pre-trigger history.
Climate risk First Street
- Flood 1/10 Low 0% chance over 30 yrs
- Wildfire 1/10 Low
- Heat 2/10 Low 8 d/yr ≥88°F today · 20 d/yr by 30 yrs out
- Wind 1/10 Low
- Air quality 6/10 Major 9 unhealthy d/yr today · 10 by 30 yrs out
Nearby sold comps map
Loading sold comps map…
Walkable amenities ~0.75 mi
Loading nearby amenities…
Taxation est. · year 1
- Rental income
- $17,259
- − Mortgage interest
- −$4,033
- − Property taxes
- −$1,080
- − Insurance
- −$360
- − Repairs & maintenance
- −$1,381
- − Management
- −$1,381
- − Depreciation
- −$2,095
- Taxable income
- $6,930
- Est. tax owed @ 24.0%
- −$1,663
- After-tax cash flow
- $6,001/yr
For passive investors: Depreciation is non-cash, so a rental often shows a tax loss while cash-flowing — sheltering income. Rental losses are passive: they offset passive income freely, and up to $25,000/yr can offset ordinary (W-2) income if you actively participate and your MAGI is under $100k (phasing out to $0 by $150k); unused losses carry forward. On sale, claimed depreciation is recaptured at up to 25%, and gains may owe capital-gains tax (a 1031 exchange can defer both). Figures are a year-1 estimate at your 24.0% rate — not tax advice; consult a CPA.
Schools (NCES district)
- District
- Madison District
- NCES district ID
- 1601920
- Math proficiency
- 44% ▲ 2.00%
- Reading proficiency
- 47% ▼ -3.00%
- Median HH income
- $31,737
- Composite
- 37.3/100
- National rank
- #4447
- State rank
- #50 of 92 in ID
Livability — Rexburg
- Score
- 76/100
- State rank
- #25
- US rank
- #3515
Category grades
Schools grade is shown separately in the Schools card above.
Census & demographics
- Census place
- Rexburg, ID
- County
- Madison County · 51,421 people
- City population
- 51,421
- Metro
- Rexburg, ID
- Population (ZIP)
- 51,421
- Household income
- $58,159
- Rent vs Own
- Severe rent burden
- 1480.0
Population outlook (Madison County) Hauer SSP2
- Today (2025)
- 40,126 people
- By 2030
- 41,845 · +4.3%
- By 2040
- 42,742 · +6.5%
- By 2050
- 44,170 · +10.1%
- By 2075
- 43,379 · +8.1%
- By 2100
- 41,607 · +3.7%
Race, ethnicity, and origin ACS 2023
- Neighborhood character
- Predominantly White (84%)
- Race & ethnicity
- White 84% Hispanic / Latino 10% Two or more races 6% Asian 2%
- Hispanic origin (detail)
- Mexican 6%
- Common ancestry
- Italian 5% Slovak 5% Portuguese 2%
- Foreign-born
- 5% · Canada, China
- Languages at home
- 90% English-only · Spanish 7% Chinese 1% Other Indo-European 1%
Political lean MEDSL · Madison
- 2024 margin
- Solid R (+64.3) · D 15.9% · R 80.2% · Other 3.8%
- 2008→2024 swing
- +8.5pp toward D · 2008: -72.8pp · 2024: -64.3pp
- All cycles
- 2024: R+64.3 2020: R+63.7 2016: R+49.3 2012: R+87.5 2008: R+72.8
Not yet ingested
- Civics
- —
Market trends
- HPI YoY
- ▼ -133.02%
- Current HPI
- 241.1775
- Rent YoY
- ▲ 2.60%
- Metro
- Rexburg, ID
- State GDP YoY
- ▲ 4.51%
- F500 in state
- 6
Industry mix (Fortune 500 HQ in ID)
| Industry | F500 HQs | Revenue |
|---|---|---|
| Retail | 1 | $79B |
|
||
| Technology | 1 | $25B |
|
||
| Food / Agriculture | 1 | $6B |
|
||
Price history
1 event — show timeline
- 2026-06-09 Listed $72,000 SRMLS
Property tax history
-25.9%/yrLatest (2025): $3 · -99.2% YoY. Source: county tax records.
Cash-flow waterfall
monthlySold comps — $/sqft
last 12 mo · ≤1 miLoading sold comps…