 Duplex
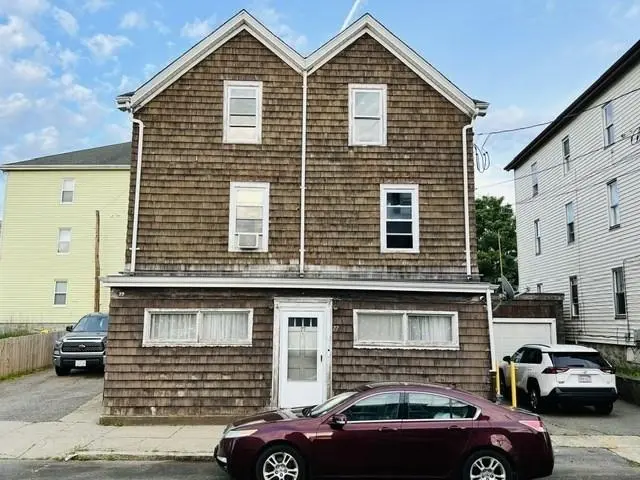
77 Fulton St · Fall River, MA
Flood risk 1/10 · Minimal
- FEMA flood zone
- X (unshaded)
- Chance of flooding over 30 yrs
- 0.0%
- Est. flood insurance / yr
- $473 – $860
Fire risk 1/10 · Minimal
- Est. fire insurance / yr
- $915 – $1,699
Heat risk 6/10 · Moderate
- Hot days now (above 96°F)
- 7 days/yr
- Hot days in 30 yrs
- 15 days/yr
Wind risk 8/10 · Major
- Chance of severe wind over 30 yrs
- 80.0%
Air-quality risk 2/10 · Minimal
- Unhealthy air days now
- 1 days/yr
- Unhealthy air days in 30 yrs
- 2 days/yr
Risk factors via First Street. Map © Google.
Why this score? — see what drove the C+ grade
The composite is a weighted blend of 9 inputs, each scored 0–100. Each bar is that input's sub-score; the figure is the points it added to the 100-point composite (weight × sub-score).
- Cash flow +24.5/30.0
- ARV discount +15.0/15.0
- DSCR +7.9/10.0
- 1% rule +5.5/10.0
- Rent growth +3.9/5.0
- Livability +3.1/5.0
- Condition / age +2.5/5.0
- Schools +1.9/10.0
- Appreciation +0.0/10.0
$520,000
🖨 Deal sheet 📄 Offer letter ✓ Due diligence
Multi-family units
County records classify this as Multi-Family (2-4 Unit). Listing-text estimate: 2 units. confirmed
Listing remarks MLS
WE CO-BROKE ON A RECIPROCAL BASIS
Key facts
- 2 family property
- Off street parking
- North end location
Tags
Property features AI
Finance
- Financial info: Active listing
- HOA & community: Not a senior community
Exterior
- Parking: 2-car garage; 2 covered parking spaces; 3 open parking spaces; 5 total parking spaces
- Utilities: Public water; Public sewer
- Home design: Multi Family property; 3 stories; Approximately 2,394 total building area
- Construction: Frame construction; Year built approximate (public records)
- Exterior features: Shingle roof; Paved driveway
Interior
- Bedrooms: Unit 1: 2 levels; Unit 2: 1 level
- Bathrooms: 2 full bathrooms; 1 half bathroom
- Interior features: 11 total rooms; Fireplace (1)
- Laundry & utility: Washer and dryer will be removed prior to sale
Neighborhood map
What this means for you Summary
Snapshot
- This is a 2 × 6.0-bed/2.5-bath units multifamily listed at $520k.
Deal economics
- At list price, monthly cash flow is $1k ($13k/yr) — positive. Per door: $534/mo.
- The deal already cash-flows at list — no discount required.
- Meets the 1% rule at list price ($5k rent vs $520k).
- Recommended offer: $512k (1.5% below list) — sets the bar for market timing.
- Cap rate 8.8% vs local median 3.6% in Fall River — top-decile yield for the area; either an underpriced asset or a hidden risk that comps aren't pricing in. Stress-test before assuming the spread holds.
Location & tenants
- Location reads 61/100 on livability (#221 in MA) — a middle-class / working-renter tenant base. Strengths: health & safety A+; Watch: cost of living D+, schools D, crime F.
- Fall River (suburban): math 17% / reading 28% proficiency, ranked #288 of 302 in MA (top 95%) — low school quality limits family demand, transient renter base, plan for 1-2y turnover; 68% free/reduced lunch — lower-income household profile, screen leases tightly.
- Market conditions: Rents rising fast (+5.8%/yr); 62 active listings in the ZIP; 760 units permitted in Bristol County in 2024 (142 in 5+ unit buildings).
- At $5,475/mo this rent would consume 106% of the median local household income ($62k/yr) (locally 2239% of renters already pay >50% of income on rent) — very limited rent-growth headroom before tenants either downsize or default.
Forward outlook
- Local home prices are declining (-3.0%/yr); year-one equity from $4k of loan paydown is wiped out by about $16k of value loss. Plan a longer hold.
- Bristol County population projected to shrink 3% by 2050 — rents likely to lag national; underwrite the cash flow, not the appreciation.
- At projected returns (-3.0% appreciation + 5.8% rent growth), your $146k cash investment doubles in ~9 years — after that, you're playing with house money.
Negotiation context
- It's been on market 15 days — a 2% lower offer ($512k) is reasonable based on typical stale-listing flexibility.
- 3 sale attempts since 33y ago with the ask held roughly flat each time — persistent listings suggest the price (not the market) is what's stuck; bring a comps-based counter.
- Current owner paid $405k; 28% above their basis — modest negotiation headroom, anchor on the comps not their cost.
Risks & watch-outs
- Watch-outs: built in 1925 — expect roof / HVAC / electrical / plumbing capex.
- Climate carrying-cost: severe wind risk, 80% chance of damaging wind over 30y; extreme-heat days projected 7→15/yr by 2055 (HVAC capex compounding) — expect insurance premiums to compound above CPI over the hold.
Questions for the listing agent
- Can we see the unit-by-unit rent roll, current vacancy, and any below-market leases? What's the average tenancy length?
- What capital expenditures (roof, boiler, parking lot, exteriors) have been made in the last 5 years, and what's planned in the next 2?
- Built in 1925 — when were the roof, HVAC, electrical panel, plumbing, and water heater last replaced?
- Is there a deadline driving the sale (1031 exchange, divorce, estate, relocation)? That informs how much negotiation room exists.
- Schools are D-rated, which usually means shorter tenancies and higher turnover. Who's the typical renter profile here, and what's been the actual vacancy rate?
- Crime grade is F in this area — have there been break-ins, vandalism, or insurance claims at this property in the last 3 years? What carrier currently insures it and at what premium?
- What's the average days-on-market for RENTAL listings here right now (not sales)? A rising rental-DOM trend means longer vacancies and softer asking-rent achievability than the comps imply.
- What's the recent tenant-quality profile in this submarket — average credit score on applications, eviction rate, late-payment / NSF rate, and stable-employment percentage? A property-management company in the area should have these aggregated.
- How much new apartment / multifamily construction is in the pipeline within 1–3 miles? Heavy new supply (>2% of stock underway) typically softens rents 12–24 months out; light construction supports rent growth.
Investment metrics
- 1% rule
- 1.05% ✓
- Cap rate
- 8.76%
- Cash-on-cash
- 8.80%
- DSCR
- 1.39
- GRM
- 7.9
CMA / ARV
- ARV (on-the-fly)
- $658,350
- Comps found
- 8
Show comp detail 8 sales within ~0.75 mi
| Address | Dist | Beds/Ba | Sqft | Sold | Price | $/sf | Match |
|---|---|---|---|---|---|---|---|
| 100 Weetamoe St | 0.36mi | 6/2.0 | 2,504 (+5%) | 6mo | $678,950 | $271 | 69 |
| 172 Stewart St | 0.42mi | 6/3.0 | 2,453 (+2%) | 14mo | $680,000 | $277 | 62 |
| 376 N Underwood St | 0.45mi | 6/2.0 | 2,196 (-8%) | 4mo | $425,000 | $194 | 60 |
| 100-102 Hood St | 0.36mi | 6/3.0 | 2,490 (+4%) | 18mo | $569,900 | $229 | 60 |
| 1000 Riverside Ave | 0.49mi | 6/2.0 | 2,592 (+8%) | 5mo | $765,000 | $295 | 57 |
| 243 Crescent St | 0.56mi | 7/3.0 (+1) | 2,281 (-5%) | 10mo | $650,000 | $285 | 51 |
| 536 N Underwood St | 0.37mi | 6/2.0 | 2,736 (+14%) | 9mo | $500,000 | $183 | 50 |
| 663-667 June St | 0.60mi | 6/3.0 | 2,560 (+7%) | 14mo | $705,000 | $275 | 47 |
Match score weights: distance 35% · size 25% · config 20% · recency 20%. Top-matched comps best support the ARV.
Projected returns pro-forma
-3.0% appreciation · 5.76% rent growth · sell at horizon
- IRR
- -0.1%
- Equity multiple
- 0.99×
- Total profit
- $-759
- Equity at exit
- $77,534
- IRR
- 12.0%
- Equity multiple
- 2.06×
- Total profit
- $154,249
- Equity at exit
- $44,960
Cash invested: $145,600 (down + closing). Projections, not guarantees.
Landlord ↔ Tenant lean methodology
- Overall (STATE)
- 20 Strongly Tenant-Friendly
- State Massachusetts
- 20 Strongly Tenant-Friendly · D+15
- County
- — inherits STATE
- City
- — inherits STATE
ZIP-level market 02720
- Home prices YoY
- -15.1%
- Rents YoY
- 5.8%
- Active inventory
- 62
- Price-to-rent
- 15.8×
Monthly cashflow live
- Estimated rent
- $5,475 medium interval (Pro) →
- Mortgage (P&I)
- −$2,727
- Tax from tax record
- −$314 /mo · $3,767/yr
- Insurance
- −$217
- HOA
- −$0
- Vacancy / Maint / Mgmt
- −$1,150
- Net cashflow
- $1,068
Break-even live
2-unit breakdown (identical units grouped — click to expand)
| Units | Beds | Baths | Est. rent |
|---|---|---|---|
| 2× units | 6.0 | 2.5 | $5,474 |
| #1 | 6.0 | 2.5 | $2,737 |
| #2 | 6.0 | 2.5 | $2,737 |
| Total (2 units) | $5,475 | ||
UW: 25.0% down · 7.5% · 30yr · 1.5% tax · 5.0% vac · 8.0% maint · 8.0% mgmt
Financing live
Cash to close
- Down payment
- $130,000
- Closing costs
- $15,600
- Reserves months
- —
- Total cash needed
- —
Loan-product check · same deal, 3 products live
Conventional
25% down · 7.5% · 30yr
- Down + closing
- —
- Monthly P&I
- —
- Monthly cashflow
- —
- DSCR
- —
- Eligible?
- —
Personal DTI + credit; lowest rate.
DSCR
20% down · 8.5% · 30yr
- Down + closing
- —
- Monthly P&I
- —
- Monthly cashflow
- —
- DSCR
- —
- Eligible?
- —
No personal income docs; deal must DSCR.
Hard money
10% down · 12.0% · 12mo
- Down + closing
- —
- Monthly P&I
- —
- Monthly cashflow
- —
- DSCR
- —
- Eligible?
- —
Short-term bridge; refi at stabilization.
Listing history 11 events
-
2026-06-18days on market $520,000 Active 15 DOM
-
2026-06-17days on market $520,000 Active 14 DOM
-
2026-06-16days on market $520,000 Active 13 DOM
-
2026-06-15days on market $520,000 Active 12 DOM
-
2026-06-13days on market $520,000 Active 10 DOM
-
2026-06-09days on market $520,000 Active 6 DOM
-
2026-06-08days on market $520,000 Active 5 DOM
-
2026-06-08status $520,000 Active 4 DOM
-
2026-06-07days on market $520,000 New 4 DOM
-
2026-06-03remarks 699-char remark
-
2026-06-03$520,000 New 1 DOM
ⓘ Source: listings_history table (triggers on properties + properties_extension) + one-shot
backfill from property_details.listing_events for pre-trigger history.
Tax reassessment forecast MA · Partial reset (capped growth)
- Current annual tax
- $3,767 · $314/mo
- Projected year-2 tax
- $5,082 · $423/mo
- Expected delta
- +$1,314/yr (+$110/mo · 34.9%)
ⓘ Screening estimate from a state-policy table — verify with the county assessor before closing.
Climate risk First Street
- Flood 1/10 Low FEMA zone X (unshaded) · 0% chance over 30 yrs
- Wildfire 1/10 Low
- Heat 6/10 Major 7 d/yr ≥96°F today · 15 d/yr by 30 yrs out
- Wind 8/10 Severe 80% chance of damaging wind over 30 yrs
- Air quality 2/10 Low 1 unhealthy d/yr today · 2 by 30 yrs out
Nearby sold comps map
Loading sold comps map…
Walkable amenities ~0.75 mi
Loading nearby amenities…
Taxation est. · year 1
- Rental income
- $65,700
- − Mortgage interest
- −$29,128
- − Property taxes
- −$3,767
- − Insurance
- −$2,600
- − Repairs & maintenance
- −$5,256
- − Management
- −$5,256
- − Depreciation
- −$15,127
- Taxable income
- $4,566
- Est. tax owed @ 24.0%
- −$1,096
- After-tax cash flow
- $11,717/yr
For passive investors: Depreciation is non-cash, so a rental often shows a tax loss while cash-flowing — sheltering income. Rental losses are passive: they offset passive income freely, and up to $25,000/yr can offset ordinary (W-2) income if you actively participate and your MAGI is under $100k (phasing out to $0 by $150k); unused losses carry forward. On sale, claimed depreciation is recaptured at up to 25%, and gains may owe capital-gains tax (a 1031 exchange can defer both). Figures are a year-1 estimate at your 24.0% rate — not tax advice; consult a CPA.
Schools (NCES district)
- District
- Fall River
- NCES district ID
- 2504830
- Math proficiency
- 17% ▼ -15.00%
- Reading proficiency
- 28% ▼ -6.00%
- Median HH income
- $35,773
- Composite
- 18.59/100
- National rank
- #8905
- State rank
- #288 of 302 in MA
Livability — Fall River
- Score
- 61/100
- State rank
- #221
- US rank
- #18220
Category grades
Schools grade is shown separately in the Schools card above.
Census & demographics
- Census place
- Fall River, MA
- County
- Bristol County · 342,083 people
- City population
- 93,033
- Metro
- Providence-Warwick, RI-MA
- Population (ZIP)
- 30,940
- Household income
- $62,196
- Rent vs Own
- Severe rent burden
- 2239.0
Population outlook (Bristol County) Hauer SSP2
- Today (2025)
- 570,212 people
- By 2030
- 571,181 · +0.2%
- By 2040
- 565,389 · -0.8%
- By 2050
- 552,141 · -3.2%
- By 2075
- 520,923 · -8.6%
- By 2100
- 474,363 · -16.8%
Race, ethnicity, and origin ACS 2023
- Neighborhood character
- Predominantly White (75%)
- Race & ethnicity
- White 75% Hispanic / Latino 11% Two or more races 8% Black 6% Asian 3%
- Hispanic origin (detail)
- Puerto Rican 5% Dominican 1%
- Common ancestry
- Russian 37% Lithuanian 7% Romanian 2%
- Foreign-born
- 21% · Canada, China, Jamaica
- Languages at home
- 66% English-only · Other Indo-European 21% Spanish 8% French/Haitian/Cajun 2%
Political lean MEDSL · Bristol
- 2024 margin
- Toss-up / Even · D 49.8% · R 48.5% · Other 1.8%
- 2008→2024 swing
- -21.9pp toward R · 2008: 23.2pp · 2024: 1.3pp
- All cycles
- 2024: D+1.3 2020: D+12.0 2016: D+9.3 2012: D+20.5 2008: D+23.2
Not yet ingested
- Civics
- —
Market trends
- HPI YoY
- ▼ -63.98%
- Current HPI
- 360.4882
- Rent YoY
- ▲ 5.76%
- Metro
- Providence-Warwick, RI-MA
- State GDP YoY
- ▲ 2.28%
- F500 in state
- 38
Industry mix (Fortune 500 HQ in MA)
| Industry | F500 HQs | Revenue |
|---|---|---|
| Technology | 3 | $17B |
|
||
| Insurance | 2 | $84B |
|
||
| Retail | 2 | $76B |
|
||
| Life Sciences | 1 | $43B |
|
||
| Energy Technology | 1 | $31B |
|
||
| Aerospace / Defense | 1 | $18B |
|
||
Price history
+372.7% since first listed10 events — show timeline
- 2026-06-03 Listed $520,000 MLS PIN
- 2023-06-05 Sold (Public Records) $405,000 Public Records
- 2008-04-25 Sold (Public Records) $165,000 Public Records
- 2008-03-20 Sold (Public Records) $197,000 Public Records
- 1999-12-06 Sold (Public Records) $112,000 Public Records
- 1999-12-06 Sold (MLS) $112,000 MLS PIN
- 1999-04-21 Listed $112,000 MLS PIN
- 1994-04-06 Sold (Public Records) $110,000 Public Records
- 1994-03-31 Sold (MLS) $110,000 MLS PIN
- 1993-10-25 Listed $110,000 MLS PIN
Property tax history
+4.7%/yrLatest (2023): $3,767 · +8.8% YoY. Source: county tax records.
Cash-flow waterfall
monthlySold comps — $/sqft
last 12 mo · ≤1 miLoading sold comps…