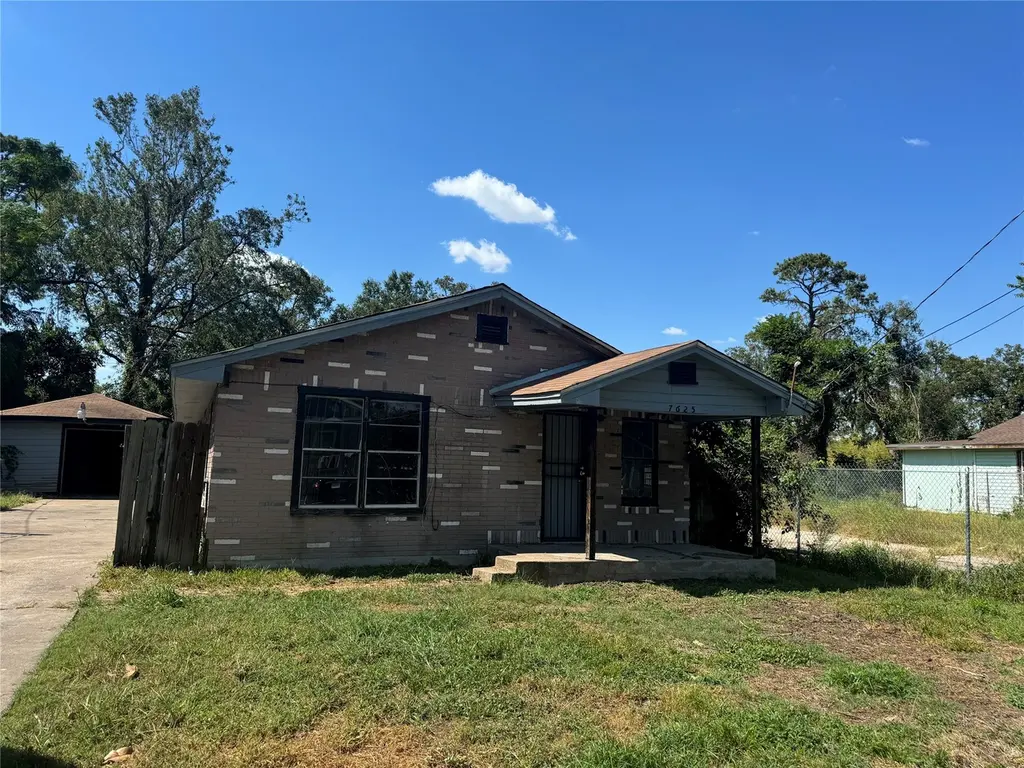
7625 Pointer St · Houston, TX
Flood risk 1/10 · Minimal
- FEMA flood zone
- X (unshaded)
- Chance of flooding over 30 yrs
- 0.0%
- Est. flood insurance / yr
- $507 – $1,088
Fire risk 1/10 · Minimal
- Est. fire insurance / yr
- $1,222 – $2,270
Heat risk 9/10 · Severe
- Hot days now (above 109°F)
- 7 days/yr
- Hot days in 30 yrs
- 24 days/yr
Wind risk 9/10 · Severe
- Chance of severe wind over 30 yrs
- 99.0%
Air-quality risk 3/10 · Minor
- Unhealthy air days now
- 2 days/yr
- Unhealthy air days in 30 yrs
- 3 days/yr
Risk factors via First Street. Map © Google.
Why this score? — see what drove the A- grade
The composite is a weighted blend of 9 inputs, each scored 0–100. Each bar is that input's sub-score; the figure is the points it added to the 100-point composite (weight × sub-score).
- Cash flow +28.9/30.0
- ARV discount +15.0/15.0
- DSCR +10.0/10.0
- Appreciation +9.3/10.0
- 1% rule +8.4/10.0
- Livability +3.7/5.0
- Schools +2.7/10.0
- Rent growth +2.6/5.0
- Condition / age +2.5/5.0
$165,000
🖨 Deal sheet (PDF) 📄 Offer letter ✓ Due diligence
Listing remarks
Investment property or great 1st home. Needs repairs, sold AS-IS. Has a detached garage. Room size and lot sqft are approximate buyer and buyers agent to verify. Home has a great layout and plenty of front/backyard. Lots of new construction near buy. Close to Downtown Houston, Breweries, TMC, and more. Buyer will need to purchase survey if needed. For additional information, please contact co-list or listing agent.
Key facts
- Great layout
- New construction
- Detached garage
Tags
Property features AI
Exterior
- Parking: Detached garage (1 car)
- Utilities: Public water; Public sewer
- Home design: Residential property
- Construction: Brick construction; Built in 1950; Composition roof; Block foundation
- Exterior features: Subdivision lot
Interior
- Bedrooms: Three bedrooms on the first floor (approx. 10x12, 10x10, 10x10)
- Bathrooms: One full bathroom
- Interior features: 3 total rooms
Neighborhood map
What this means for you Summary
Snapshot
- This is a 4-bed/1.0-bath single-family listed at $165k.
Deal economics
- At list price, monthly cash flow is $559 ($7k/yr) — positive.
- The deal already cash-flows at list — no discount required.
- Meets the 1% rule at list price ($2k rent vs $165k).
- Cap rate 10.4% vs local median 3.2% in Houston — top-decile yield for the area; either an underpriced asset or a hidden risk that comps aren't pricing in. Stress-test before assuming the spread holds.
Location & tenants
- Location reads 74/100 on livability (#184 in TX, #4,771 nationally) — a middle-class / working-renter tenant base. Strengths: amenities A+, cost of living A+, housing A+; Watch: crime F.
- Houston ISD (urban): math 27% / reading 35% proficiency, ranked #593 of 826 in TX (top 72%) — families likely to look elsewhere, expect single-tenant / working-renter base with shorter leases; 71% free/reduced lunch — lower-income household profile, screen leases tightly.
- Zoned schools: Cook Jr El (math 22% / reading 37%, grade F, #2,525 of 4,322 statewide, top 62%, 519 students, 96% FRL); Key Middle (math 10% / reading 20%, grade F, #1,569 of 1,662 statewide, top 95%, 615 students, 100% FRL); Kashmere H S (math 14% / reading 22%, grade F, #1,445 of 1,632 statewide, top 89%, 725 students, 96% FRL) — zoned schools average 97% FRL vs 71% district-wide (26 pts higher); higher-poverty schools than district average — tighter screening recommended.
- Market conditions: Rents flat; 376 active listings in the ZIP; 20 comparable units currently listed for rent nearby; rentals at typical pace (median 26d on market — plan ~3-4 weeks tenant-placement turnaround); 45% of comp listings sitting > 30 days — soft ceiling on asking rent; 29,883 units permitted in Harris County in 2024 (8,621 in 5+ unit buildings).
- At $2,214/mo this rent would consume 56% of the median local household income ($48k/yr) (locally 1297% of renters already pay >50% of income on rent) — very limited rent-growth headroom before tenants either downsize or default.
Forward outlook
- In year one you build about $15k of equity ($1k loan paydown + $14k appreciation (8.7% local appreciation)).
- Harris County population projected at +47% by 2050 — long-run rental-demand tailwind backs the buy-and-hold thesis.
- At projected returns (8.7% appreciation + 0.4% rent growth), your $46k cash investment doubles in ~3 years — after that, you're playing with house money.
- By year 3, paydown + projected appreciation supports a ~$39k cash-out refi (75% LTV) — recoverable capital for the next deal without selling this one.
Negotiation context
- Only 5 days on market — expect competitive offers; lowballing is unlikely to land.
- 4 sale attempts since 3y ago with the ask held roughly flat each time — persistent listings suggest the price (not the market) is what's stuck; bring a comps-based counter.
Risks & watch-outs
- Watch-outs: built in 1950 — expect roof / HVAC / electrical / plumbing capex.
- Climate carrying-cost: severe wind risk, 99% chance of damaging wind over 30y; extreme-heat days projected 7→24/yr by 2055 (HVAC capex compounding) — expect insurance premiums to compound above CPI over the hold.
Questions for the listing agent
- Built in 1950 — when were the roof, HVAC, electrical panel, plumbing, and water heater last replaced?
- Is there a deadline driving the sale (1031 exchange, divorce, estate, relocation)? That informs how much negotiation room exists.
- Schools are D-rated, which usually means shorter tenancies and higher turnover. Who's the typical renter profile here, and what's been the actual vacancy rate?
- Crime grade is F in this area — have there been break-ins, vandalism, or insurance claims at this property in the last 3 years? What carrier currently insures it and at what premium?
- What's the average days-on-market for RENTAL listings here right now (not sales)? A rising rental-DOM trend means longer vacancies and softer asking-rent achievability than the comps imply.
- What's the recent tenant-quality profile in this submarket — average credit score on applications, eviction rate, late-payment / NSF rate, and stable-employment percentage? A property-management company in the area should have these aggregated.
- How much new for-sale + rental construction is in the pipeline within 1–3 miles? Heavy new supply typically softens prices + rents 12–24 months out; constrained supply supports both.
Investment metrics
- 1% rule
- 1.34% ✓
- Cap rate
- 10.36%
- Cash-on-cash
- 14.51%
- DSCR
- 1.65
- GRM
- 6.2
CMA / ARV
- ARV (median comp)
- $214,560
- List price
- $165,000
- Delta
- -23.10%
- Verdict
- UNDERPRICED
- Comps
- 20 within 1.0 mi
Show comp detail 12 sales within ~0.75 mi
| Address | Dist | Beds/Ba | Sqft | Sold | Price | $/sf | Match |
|---|---|---|---|---|---|---|---|
| 7701 Sayers St | 0.38mi | 3/2.5 (-1) | 1,575 (-2%) | 8mo | $299,999 | $190 | 61 |
| 4209 Tampico Rd | 0.28mi | 3/2.5 (-1) | 1,445 (-10%) | 5mo | $225,000 | $156 | 55 |
| 7810 Magna St | 0.44mi | 3/2.0 (-1) | 1,500 (-7%) | 8mo | $225,000 | $150 | 53 |
| 4006 Yorkshire St | 0.42mi | 3/2.0 (-1) | 1,768 (+10%) | 5mo | $79,900 | $45 | 51 |
| 4819 Keeland St | 0.63mi | 3/2.5 (-1) | 1,627 (+1%) | 8mo | $252,000 | $155 | 51 |
| 4813 Keeland St | 0.63mi | 3/2.5 (-1) | 1,627 (+1%) | 9mo | $252,000 | $155 | 50 |
| 4815 Keeland St | 0.63mi | 3/2.5 (-1) | 1,627 (+1%) | 10mo | $252,000 | $155 | 49 |
| 8718 Magna St | 0.72mi | 3/1.5 (-1) | 1,528 (-5%) | 4mo | $200,000 | $131 | 48 |
| 7831 Wileyvale Rd | 0.49mi | 4/2.0 | 1,781 (+11%) | 10mo | $275,000 | $154 | 47 |
| 7609 Shotwell St | 0.69mi | 3/2.0 (-1) | 1,660 (+3%) | 8mo | $180,000 | $108 | 46 |
| 7302 Sandra St | 0.71mi | 3/1.0 (-1) | 1,460 (-9%) | 1mo | $239,900 | $164 | 46 |
| 3802 Keeland St | 0.64mi | 4/3.0 | 1,770 (+10%) | 2mo | $329,000 | $186 | 44 |
Match score weights: distance 35% · size 25% · config 20% · recency 20%. Top-matched comps best support the ARV.
Projected returns pro-forma
8.65% appreciation · 0.44% rent growth · sell at horizon
- IRR
- 31.2%
- Equity multiple
- 3.27×
- Total profit
- $104,966
- Equity at exit
- $132,705
- IRR
- 26.6%
- Equity multiple
- 6.81×
- Total profit
- $268,420
- Equity at exit
- $270,756
Cash invested: $46,200 (down + closing). Projections, not guarantees.
Landlord ↔ Tenant lean methodology
- Overall (STATE)
- 87 Strongly Landlord-Friendly
- State Texas
- 87 Strongly Landlord-Friendly · R+5
- County
- — inherits STATE
- City
- — inherits STATE
ZIP-level market 77016
- Home prices YoY
- 2.8%
- Rents YoY
- 0.4%
- Active inventory
- 376
- Price-to-rent
- 6.2×
Monthly cashflow live
- Estimated rent
- $2,214 high interval (Pro) →
- Mortgage (P&I)
- −$865
- Tax from tax record
- −$256 /mo · $3,074/yr
- Insurance
- −$69
- HOA
- −$0
- Vacancy / Maint / Mgmt
- −$465
- Net cashflow
- $559
Break-even live
Sensitivity live
| Price | -10% $652 | -5% $605 | +0% $559 | +5% $512 | +10% $465 |
|---|---|---|---|---|---|
| Rent | -10% $384 | -5% $471 | +0% $559 | +5% $646 | +10% $734 |
| Rate | -1.0pp $642 | -0.5pp $601 | base $559 | +0.5pp $516 | +1.0pp $472 |
UW: 25.0% down · 7.5% · 30yr · 1.5% tax · 5.0% vac · 8.0% maint · 8.0% mgmt
Financing live
Cash to close
- Down payment
- $41,250
- Closing costs
- $4,950
- Reserves months
- —
- Total cash needed
- —
Loan-product check · same deal, 3 products live
Conventional
25% down · 7.5% · 30yr
- Down + closing
- —
- Monthly P&I
- —
- Monthly cashflow
- —
- DSCR
- —
- Eligible?
- —
Personal DTI + credit; lowest rate.
DSCR
20% down · 8.5% · 30yr
- Down + closing
- —
- Monthly P&I
- —
- Monthly cashflow
- —
- DSCR
- —
- Eligible?
- —
No personal income docs; deal must DSCR.
Hard money
10% down · 12.0% · 12mo
- Down + closing
- —
- Monthly P&I
- —
- Monthly cashflow
- —
- DSCR
- —
- Eligible?
- —
Short-term bridge; refi at stabilization.
Rent comps 20 comps
| Address | Beds | Baths | Sqft | Rent | $/sqft | DOM | Units | Dist |
|---|---|---|---|---|---|---|---|---|
| 4326 Plaag St Unit B Houston, TX | 3.0 | 2.5 | 1150 | $1,595 | $1.39 | 45d | 1 | 0.29mi |
| 7740 Wileyvale Rd Unit B Houston, TX | 3.0 | 2.0 | 1500 | $3,000 | $2.00 | 45d | 1 | 0.54mi |
| 4626 Shreveport Blvd Unit B Houston, TX | 3.0 | 2.0 | 1150 | $1,490 | $1.30 | 15d | 1 | 0.64mi |
| 3812 Lynnfield St Houston, TX | 3.0 | 2.0 | 1298 | $1,545 | $1.19 | 6d | 1 | 0.77mi |
| 3810 Lynnfield St Houston, TX | 3.0 | 2.0 | 1298 | $1,599 | $1.23 | 16d | 1 | 0.78mi |
| 3222 Bostic St Unit 1571615P Houston, TX | 3.0 | 2.5 | 1593 | $5,423 | $3.40 | 0d | 1 | 0.85mi |
| 8318 Curry Rd Houston, TX | 3.0 | 2.0 | 1558 | $2,299 | $1.48 | 45d | 1 | 0.87mi |
| 8320 Curry Rd Houston, TX | 3.0 | 2.5 | 1558 | $8,950 | $5.74 | 23d | 1 | 0.88mi |
| 8320 Curry Rd Unit 1391267P Houston, TX | 3.0 | 2.5 | 1550 | $5,033 | $3.25 | 0d | 1 | 0.88mi |
| 8322 Curry Rd Houston, TX | 3.0 | 2.5 | 1599 | $2,500 | $1.56 | 45d | 1 | 0.88mi |
| 3208 Bostic St Unit 1254540P Houston, TX | 3.0 | 2.0 | 1603 | $3,673 | $2.29 | 0d | 1 | 0.88mi |
| 8326 Curry Rd Unit 1228882P Houston, TX | 3.0 | 2.0 | 1614 | $2,878 | $1.78 | 9d | 1 | 0.89mi |
| 8326 Curry Rd Unit 1227052P Houston, TX | 3.0 | 2.0 | 1270 | $3,317 | $2.61 | 0d | 1 | 0.89mi |
| 5609 Denmark St Unit A Houston, TX | 3.0 | 2.0 | 1410 | $1,595 | $1.13 | 45d | 1 | 0.90mi |
| 8639 Peachtree St Unit A Houston, TX | 3.0 | 2.5 | 1150 | $1,750 | $1.52 | 45d | 1 | 0.91mi |
| 7320 Jensen Dr Houston, TX | 1.0–3.0 | 1.0–2.0 | 935 | $1,176 | $1.26 | 3d | 5 | 1.02mi |
| 6315 Sandra St Unit A Houston, TX | 3.0 | 2.0 | 1150 | $1,399 | $1.22 | 45d | 1 | 1.02mi |
| 4030 Reid St Houston, TX | 3.0 | 2.0 | 1680 | $2,000 | $1.19 | 45d | 1 | 1.02mi |
| 2623 Huntington Creek Ln Houston, TX | 3.0 | 2.5 | 1553 | $2,299 | $1.48 | 25d | 1 | 1.19mi |
| 9422 Sandra St Unit B Houston, TX | 3.0 | 2.5 | 1461 | $1,875 | $1.28 | 45d | 1 | 1.47mi |
Listing history 12 events
-
2026-06-21days on market $165,000 Active 5 DOM
-
2026-06-18days on market $165,000 Active 2 DOM
-
2026-06-16remarks 418-char remark
-
2026-06-16days on market $165,000 Active 1 DOM
-
2025-11-25$165,000 Active 195-char remark
-
2025-10-31historical
-
2025-02-18$160,000 Active
-
2023-12-31historical
-
2023-08-24$160,000 Active
-
2002-05-16soldstatus
-
1998-10-09soldstatus
-
1998-08-03soldstatus
ⓘ Source: listings_history table (triggers on properties + properties_extension) + one-shot
backfill from property_details.listing_events for pre-trigger history.
Tax reassessment forecast TX · Resets to sale price
- Current annual tax
- $3,074 · $256/mo
- Projected year-2 tax
- $3,074 · $256/mo
- Expected delta
- $0/yr ($0/mo · 0.0%)
ⓘ Screening estimate from a state-policy table — verify with the county assessor before closing.
Climate risk First Street
- Flood 1/10 Low FEMA zone X (unshaded) · 0% chance over 30 yrs
- Wildfire 1/10 Low
- Heat 9/10 Extreme 7 d/yr ≥109°F today · 24 d/yr by 30 yrs out
- Wind 9/10 Extreme 99% chance of damaging wind over 30 yrs
- Air quality 3/10 Moderate 2 unhealthy d/yr today · 3 by 30 yrs out
Nearby sold comps map
Loading sold comps map…
Walkable amenities ~0.75 mi
Loading nearby amenities…
Taxation est. · year 1
- Rental income
- $26,565
- − Mortgage interest
- −$9,243
- − Property taxes
- −$3,074
- − Insurance
- −$825
- − Repairs & maintenance
- −$2,125
- − Management
- −$2,125
- − Depreciation
- −$4,800
- Taxable income
- $4,373
- Est. tax owed @ 24.0%
- −$1,050
- After-tax cash flow
- $5,655/yr
For passive investors: Depreciation is non-cash, so a rental often shows a tax loss while cash-flowing — sheltering income. Rental losses are passive: they offset passive income freely, and up to $25,000/yr can offset ordinary (W-2) income if you actively participate and your MAGI is under $100k (phasing out to $0 by $150k); unused losses carry forward. On sale, claimed depreciation is recaptured at up to 25%, and gains may owe capital-gains tax (a 1031 exchange can defer both). Figures are a year-1 estimate at your 24.0% rate — not tax advice; consult a CPA.
Schools (NCES district)
- District
- Houston ISD
- NCES district ID
- 4823640
- Math proficiency
- 27% ▼ -18.00%
- Reading proficiency
- 35% ▼ -6.00%
- Median HH income
- $46,054
- Composite
- 26.63/100
- National rank
- #7173
- State rank
- #593 of 826 in TX
Livability — Houston
- Score
- 74/100
- State rank
- #184
- US rank
- #4771
Category grades
Schools grade is shown separately in the Schools card above.
Census & demographics
- Census place
- Houston, TX
- County
- Harris County · 4,702,590 people
- City population
- 3,226,434
- Metro
- Houston-The Woodlands-Sugar Land, TX
- Population (ZIP)
- 29,841
- Household income
- $47,677
- Rent vs Own
- Severe rent burden
- 1297.0
Population outlook (Harris County) Hauer SSP2
- Today (2025)
- 5,571,493 people
- By 2030
- 6,089,821 · +9.3%
- By 2040
- 7,142,806 · +28.2%
- By 2050
- 8,185,864 · +46.9%
- By 2075
- 10,574,329 · +89.8%
- By 2100
- 12,109,958 · +117.4%
Race, ethnicity, and origin ACS 2023
- Neighborhood character
- Majority Black (56%)
- Race & ethnicity
- Black 56% Hispanic / Latino 42% Two or more races 28%
- Hispanic origin (detail)
- Mexican 34%
- Foreign-born
- 18% · Canada
- Languages at home
- 61% English-only · Spanish 37%
Political lean MEDSL · Harris
- 2024 margin
- Lean D (+5.5) · D 52.0% · R 46.4% · Other 1.6%
- 2008→2024 swing
- +3.9pp toward D · 2008: 1.6pp · 2024: 5.5pp
- All cycles
- 2024: D+5.5 2020: D+13.3 2016: D+12.4 2012: D+0.1 2008: D+1.6
Not yet ingested
- Civics
- —
Market trends
- HPI YoY
- ▲ 8.65%
- Current HPI
- 315.6765
- Rent YoY
- ▲ 0.44%
- Metro
- Houston-The Woodlands-Sugar Land, TX
- State GDP YoY
- ▲ 3.95%
- F500 in state
- 110
Industry mix (Fortune 500 HQ in TX)
| Industry | F500 HQs | Revenue |
|---|---|---|
| Energy | 16 | $1,198B |
|
||
| Technology | 5 | $198B |
|
||
| Engineering / Construction | 4 | $72B |
|
||
| Energy Services | 3 | $60B |
|
||
| Utilities | 3 | $41B |
|
||
| Healthcare | 2 | $330B |
|
||
Price history
+3.1% since first listed10 events — show timeline
- 2026-06-16 Listed $165,000 HARMLS
- 2026-05-25 Listing Removed — HARMLS
- 2025-11-25 Listed $165,000 HARMLS
- 2025-10-31 Listing Removed — HARMLS
- 2025-02-18 Listed $160,000 HARMLS
- 2023-12-31 Listing Removed — HARMLS
- 2023-08-24 Listed $160,000 HARMLS
- 2002-05-16 Sold (Public Records) — Public Records
- 1998-10-09 Sold (Public Records) — Public Records
- 1998-08-03 Sold (Public Records) — Public Records
Property tax history
+9.8%/yrLatest (2025): $3,074 · +1.6% YoY. Source: county tax records.
Cash-flow waterfall
monthlySold comps — $/sqft
last 12 mo · ≤1 miLoading sold comps…