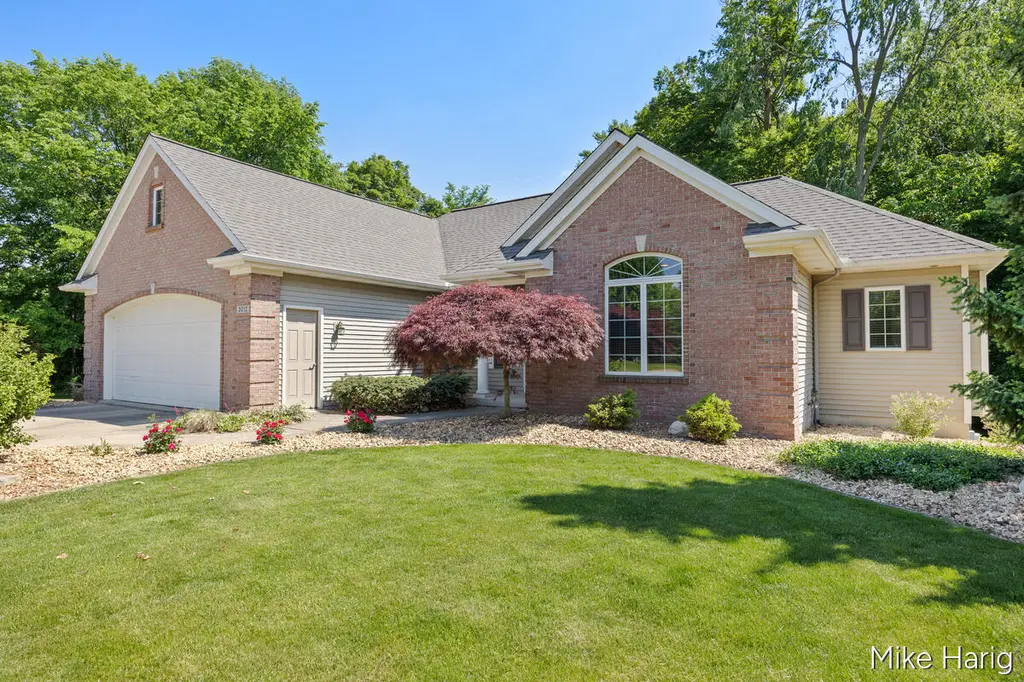
3012 Hunters Dr SW · Jenison, MI
Flood risk 1/10 · Minimal
- FEMA flood zone
- X (unshaded)
- Chance of flooding over 30 yrs
- 0.0%
- Est. flood insurance / yr
- $473 – $860
Fire risk 1/10 · Minimal
- Est. fire insurance / yr
- $784 – $1,456
Heat risk 2/10 · Minimal
- Hot days now (above 95°F)
- 7 days/yr
- Hot days in 30 yrs
- 16 days/yr
Wind risk 2/10 · Minimal
- Chance of severe wind over 30 yrs
- —
Air-quality risk 2/10 · Minimal
- Unhealthy air days now
- 1 days/yr
- Unhealthy air days in 30 yrs
- 1 days/yr
Risk factors via First Street. Map © Google.
Why this score? — see what drove the F grade
The composite is a weighted blend of 9 inputs, each scored 0–100. Each bar is that input's sub-score; the figure is the points it added to the 100-point composite (weight × sub-score).
- ARV discount +7.5/15.0
- Schools +5.5/10.0
- Livability +3.7/5.0
- Rent growth +2.5/5.0
- Condition / age +2.5/5.0
- Cash flow +1.4/30.0
- 1% rule +0.0/10.0
- DSCR +0.0/10.0
- Appreciation +0.0/10.0
$550,000
🖨 Deal sheet 📄 Offer letter ✓ Due diligence
Listing remarks MLS
Check out this custom ranch home in Hager Park West! Tastefully decorated, the open concept main level living space features a large kitchen with granite countertops, center island, recently refinished hardwood floors (2026), a spacious living room with gas-log fireplace, built-ins, large windows with a slider door that opens to the deck where you can enjoy the private wooded back yard. Main level also offers a primary suite, a second bedroom with new vinyl plank flooring (2026) through the full bath, laundry, half bath and front entryway. Updated lower level has a large family room with a gas-long fireplace, kitchenette, two additional bedrooms and a full bathroom. Storage abounds in this home with a basement 3 stall garage and additional attic space storage accessible in the main floor garage. New roof (2026) and new siding, scheduled to be completed in June 2026.This home is situated on a private 1 acre wooded lot that backs up to an association nature park with a wooded walking trails. Offer deadline of Monday June 1 at Noon. Call for your private showing today!
Key facts
- Large kitchen
- Custom ranch home
- Granite countertops
Tags
Property features AI
Finance
- Other: Living area reported as 3,021
- HOA & community: Homeowners association with $250 annual fee
Exterior
- Parking: Attached garage; 5-car garage
- Utilities: Public water; Natural gas connected; Cable connected; Natural gas water heater
- Home design: Ranch-style single family home; Built in 2001
- Construction: Brick and vinyl siding exterior; Composition roof
- Exterior features: Sidewalk; Wooded lot; Paved road
Interior
- Kitchen: Microwave; Oven; Range; Refrigerator
- Bathrooms: 3 full bathrooms; 1 half bathroom
- Heating & cooling: Forced air heating; Wall furnace; Has cooling
- Interior features: Garage door opener; Wet bar; Eat-in kitchen; Gas log fireplace; Window treatments; 8 total rooms
Neighborhood map
What this means for you Summary
Snapshot
- This is a 4-bed/3.5-bath single-family listed at $550k.
Deal economics
- At list price, monthly cash flow is $-2k ($-26k/yr) — negative.
- To cash-flow at today's rent, offer at most $166k (69.8% below list).
- To meet the 1% rule (rent ≥ 1% of price), the offer needs to be $174k (68.3% below list).
- Recommended offer: $166k (69.8% below list) — sets the bar for cash-flow.
- Cap rate 1.6% vs local median 3.3% in Jenison — below-typical yield; the buyer is paying a premium for something (appreciation thesis, condition, location) that the cap rate doesn't capture.
Location & tenants
- Location reads 74/100 on livability (#178 in MI, #4,596 nationally) — a middle-class / working-renter tenant base. Strengths: cost of living A+, housing A+, employment A; Watch: amenities F, commute F, health & safety F.
- Hudsonville Public School District (suburban): math 55% / reading 70% proficiency, ranked #32 of 540 in MI (top 6%) — acceptable for families but not a draw, mixed tenant base, ~2y average lease; only 15% free/reduced lunch — higher-income household profile.
- Market conditions: 142 active listings in the ZIP; 1 comparable units currently listed for rent nearby; 1,237 units permitted in Ottawa County in 2024 (443 in 5+ unit buildings).
Forward outlook
- Local home prices are declining (-3.0%/yr); year-one equity from $4k of loan paydown is wiped out by about $16k of value loss. Plan a longer hold.
- Ottawa County population projected at +24% by 2050 — long-run rental-demand tailwind backs the buy-and-hold thesis.
Negotiation context
- Only 4 days on market — expect competitive offers; lowballing is unlikely to land.
- 6 sale attempts since 11y ago with the ask held roughly flat each time — persistent listings suggest the price (not the market) is what's stuck; bring a comps-based counter.
- Current owner paid $329k; list at $550k implies a 67% gain — meaningful room to come down on a strong offer.
Questions for the listing agent
- What do current leases actually rent for vs. the listed asking? Can we see a recent rent roll and the last 12 months of T-12 income?
- What does the HOA fee cover, when was the last increase, and are there any pending special assessments or reserve-fund shortfalls?
- Is there a deadline driving the sale (1031 exchange, divorce, estate, relocation)? That informs how much negotiation room exists.
- Schools are B-rated — typically a magnet for longer-tenancy family renters. What's the average tenant stay here, and is there a school-zone premium baked into asking?
- The area grade is low — what's the realistic commute time and amenity access for the typical tenant pool here? Any planned neighborhood developments (good or bad) we should know about?
- What's the average days-on-market for RENTAL listings here right now (not sales)? A rising rental-DOM trend means longer vacancies and softer asking-rent achievability than the comps imply.
- What's the recent tenant-quality profile in this submarket — average credit score on applications, eviction rate, late-payment / NSF rate, and stable-employment percentage? A property-management company in the area should have these aggregated.
- How much new for-sale + rental construction is in the pipeline within 1–3 miles? Heavy new supply typically softens prices + rents 12–24 months out; constrained supply supports both.
Investment metrics
- 1% rule
- 0.32% ✗
- Cap rate
- 1.55%
- Cash-on-cash
- -16.92%
- DSCR
- 0.25
- GRM
- 26.3
CMA / ARV
- ARV (on-the-fly)
- $361,483
- Comps found
- 10
Show comp detail 10 sales within ~0.75 mi
| Address | Dist | Beds/Ba | Sqft | Sold | Price | $/sf | Match |
|---|---|---|---|---|---|---|---|
| 8367 Bauer Ridge Ave | 0.54mi | 3/2.5 (-1) | 1,602 (-1%) | 1mo | $510,000 | $318 | 63 |
| 8448 Tucker Ct | 0.43mi | 4/2.0 | 1,700 (+5%) | 8mo | $395,000 | $232 | 59 |
| 2493 Almar St | 0.70mi | 3/1.5 (-1) | 1,644 (+1%) | 6mo | $351,000 | $214 | 47 |
| 3052 Gilmore Ln | 0.48mi | 3/2.5 (-1) | 1,560 (-4%) | 18mo | $370,000 | $237 | 47 |
| 8432 Tucker Ct | 0.40mi | 4/2.0 | 1,791 (+10%) | 13mo | $400,000 | $223 | 47 |
| 8329 Stonington Dr | 0.45mi | 4/2.0 | 1,825 (+13%) | 8mo | $385,000 | $211 | 45 |
| 3215 Baldwin St | 0.67mi | 3/2.5 (-1) | 1,576 (-3%) | 24mo | $323,000 | $205 | 36 |
| 7595 28th Ave | 0.72mi | 3/1.0 (-1) | 1,500 (-8%) | 6mo | $257,000 | $171 | 34 |
| 7762 Emberly Dr | 0.75mi | 3/2.0 (-1) | 1,556 (-4%) | 18mo | $345,000 | $222 | 32 |
| 2682 Thrush Dr | 0.63mi | 3/2.5 (-1) | 1,849 (+14%) | 9mo | $412,500 | $223 | 31 |
Match score weights: distance 35% · size 25% · config 20% · recency 20%. Top-matched comps best support the ARV.
Projected returns pro-forma
-3.0% appreciation · 3.0% rent growth · sell at horizon
- IRR
- -49.8%
- Equity multiple
- -0.48×
- Total profit
- $-227,564
- Equity at exit
- $82,007
- IRR
- -99.1%
- Equity multiple
- -1.45×
- Total profit
- $-376,777
- Equity at exit
- $47,554
Cash invested: $154,000 (down + closing). Projections, not guarantees.
Landlord ↔ Tenant lean methodology
- Overall (STATE)
- 62 Landlord-Friendly
- State Michigan
- 62 Landlord-Friendly · EVEN
- County
- — inherits STATE
- City
- — inherits STATE
ZIP-level market 49428
- Active inventory
- 142
- Price-to-rent
- 26.3×
Monthly cashflow live
- Estimated rent
- $1,745 medium interval (Pro) →
- Mortgage (P&I)
- −$2,884
- Tax from tax record
- −$416 /mo · $4,989/yr
- Insurance
- −$229
- HOA
- −$21
- Vacancy / Maint / Mgmt
- −$366
- Net cashflow
- $-2,172
Break-even live
UW: 25.0% down · 7.5% · 30yr · 1.5% tax · 5.0% vac · 8.0% maint · 8.0% mgmt
Financing live
Cash to close
- Down payment
- $137,500
- Closing costs
- $16,500
- Reserves months
- —
- Total cash needed
- —
Loan-product check · same deal, 3 products live
Conventional
25% down · 7.5% · 30yr
- Down + closing
- —
- Monthly P&I
- —
- Monthly cashflow
- —
- DSCR
- —
- Eligible?
- —
Personal DTI + credit; lowest rate.
DSCR
20% down · 8.5% · 30yr
- Down + closing
- —
- Monthly P&I
- —
- Monthly cashflow
- —
- DSCR
- —
- Eligible?
- —
No personal income docs; deal must DSCR.
Hard money
10% down · 12.0% · 12mo
- Down + closing
- —
- Monthly P&I
- —
- Monthly cashflow
- —
- DSCR
- —
- Eligible?
- —
Short-term bridge; refi at stabilization.
Rent comps 1 comps
| Address | Beds | Baths | Sqft | Rent | $/sqft | DOM | Units | Dist |
|---|---|---|---|---|---|---|---|---|
| 7999 Green Meadow Ct Apt 1 Georgetown Township, MI | 3.0 | 1.5 | 1200 | $1,745 | $1.45 | 43d | 1 | 0.18mi |
HOA detail
- Monthly dues
- $21 · $252/yr
- Likely covers
- gas
Listing history 15 events
-
2026-06-02status $550,000 Pending 4 DOM
-
2026-06-01days on market $550,000 Active 4 DOM
-
2026-05-31days on market $550,000 Active 3 DOM
-
2026-05-28$550,000 Active 1082-char remark
Show marketing remark (878 chars)
Check out this custom ranch home in Hager Park West! Tastefully decorated, the open concept main level living space features a large kitchen with granite countertops, center island, recently refinished hardwood floors (2026), a spacious living room with gas-log fireplace, built-ins, large windows with a slider door that opens to the deck where you can enjoy the private wooded back yard. Main level also offers a primary suite, a second bedroom with new vinyl plank flooring (2026) through the full bath, laundry, half bath and front entryway. Updated lower level has a large family room with a gas-long fireplace, kitchenette, two additional bedrooms and a full bathroom. Storage abounds in this home with a basement 3 stall garage and additional attic space storage accessible in the main floor garage. New roof (2026) and new siding, scheduled to be completed in June 2026.
-
2026-05-28$550,000 Active 878-char remark
Show marketing remark (878 chars)
Check out this custom ranch home in Hager Park West! Tastefully decorated, the open concept main level living space features a large kitchen with granite countertops, center island, recently refinished hardwood floors (2026), a spacious living room with gas-log fireplace, built-ins, large windows with a slider door that opens to the deck where you can enjoy the private wooded back yard. Main level also offers a primary suite, a second bedroom with new vinyl plank flooring (2026) through the full bath, laundry, half bath and front entryway. Updated lower level has a large family room with a gas-long fireplace, kitchenette, two additional bedrooms and a full bathroom. Storage abounds in this home with a basement 3 stall garage and additional attic space storage accessible in the main floor garage. New roof (2026) and new siding, scheduled to be completed in June 2026.
-
2026-05-28$550,000 Active
Show marketing remark (878 chars)
Check out this custom ranch home in Hager Park West! Tastefully decorated, the open concept main level living space features a large kitchen with granite countertops, center island, recently refinished hardwood floors (2026), a spacious living room with gas-log fireplace, built-ins, large windows with a slider door that opens to the deck where you can enjoy the private wooded back yard. Main level also offers a primary suite, a second bedroom with new vinyl plank flooring (2026) through the full bath, laundry, half bath and front entryway. Updated lower level has a large family room with a gas-long fireplace, kitchenette, two additional bedrooms and a full bathroom. Storage abounds in this home with a basement 3 stall garage and additional attic space storage accessible in the main floor garage. New roof (2026) and new siding, scheduled to be completed in June 2026.
-
2015-12-10soldstatus $328,900
-
2015-11-13soldstatus $328,900
-
2015-11-13soldstatus $328,900 Sold
-
2015-11-05status Pending
-
2015-10-06price $334,900
-
2015-09-24status Active
-
2015-09-24historical
-
2015-09-20$339,900 Active
-
2015-09-18$334,900
ⓘ Source: listings_history table (triggers on properties + properties_extension) + one-shot
backfill from property_details.listing_events for pre-trigger history.
Tax reassessment forecast MI · Partial reset (capped growth)
- Current annual tax
- $4,989 · $416/mo
- Projected year-2 tax
- $6,730 · $561/mo
- Expected delta
- +$1,740/yr (+$145/mo · 34.9%)
ⓘ Screening estimate from a state-policy table — verify with the county assessor before closing.
Climate risk First Street
- Flood 1/10 Low FEMA zone X (unshaded) · 0% chance over 30 yrs
- Wildfire 1/10 Low
- Heat 2/10 Low 7 d/yr ≥95°F today · 16 d/yr by 30 yrs out
- Wind 2/10 Low
- Air quality 2/10 Low 1 unhealthy d/yr today · 1 by 30 yrs out
Nearby sold comps map
Loading sold comps map…
Walkable amenities ~0.75 mi
Loading nearby amenities…
Taxation est. · year 1
- Rental income
- $20,940
- − Mortgage interest
- −$30,809
- − Property taxes
- −$4,989
- − Insurance
- −$2,750
- − Repairs & maintenance
- −$1,675
- − Management
- −$1,675
- − HOA
- −$252
- − Depreciation
- −$16,000
- Taxable loss
- −$37,210
- Est. tax savings @ 24.0%
- +$8,930
- After-tax cash flow
- $-17,129/yr
For passive investors: Depreciation is non-cash, so a rental often shows a tax loss while cash-flowing — sheltering income. Rental losses are passive: they offset passive income freely, and up to $25,000/yr can offset ordinary (W-2) income if you actively participate and your MAGI is under $100k (phasing out to $0 by $150k); unused losses carry forward. On sale, claimed depreciation is recaptured at up to 25%, and gains may owe capital-gains tax (a 1031 exchange can defer both). Figures are a year-1 estimate at your 24.0% rate — not tax advice; consult a CPA.
Schools (NCES district)
- District
- Hudsonville Public School District
- NCES district ID
- 2618840
- Math proficiency
- 55% ▼ -10.00%
- Reading proficiency
- 70% ▼ -4.00%
- Median HH income
- $69,784
- Composite
- 54.98/100
- National rank
- #1301
- State rank
- #32 of 540 in MI
Livability — Jenison
- Score
- 74/100
- State rank
- #178
- US rank
- #4596
Category grades
Schools grade is shown separately in the Schools card above.
Census & demographics
- City population
- 28,090
- Population (ZIP)
- 28,090
Population outlook (Ottawa County) Hauer SSP2
- Today (2025)
- 313,561 people
- By 2030
- 330,027 · +5.3%
- By 2040
- 361,118 · +15.2%
- By 2050
- 388,414 · +23.9%
- By 2075
- 452,175 · +44.2%
- By 2100
- 473,041 · +50.9%
Race, ethnicity, and origin ACS 2023
- Neighborhood character
- Predominantly White (91%)
- Race & ethnicity
- White 91% Hispanic / Latino 4% Two or more races 3% Asian 1%
- Common ancestry
- Iranian 37% Romanian 8% Lithuanian 3%
- Foreign-born
- 2% · Canada, China, South Korea
- Languages at home
- 97% English-only · Spanish 2%
Political lean MEDSL · Ottawa
- 2024 margin
- Strong R (+20.4) · D 39.0% · R 59.5% · Other 1.5%
- 2008→2024 swing
- +3.4pp toward D · 2008: -23.9pp · 2024: -20.4pp
- All cycles
- 2024: R+20.4 2020: R+21.5 2016: R+30.4 2012: R+34.2 2008: R+23.9
Not yet ingested
- Civics
- —
Market trends
- HPI YoY
- ▼ -234.19%
- Current HPI
- 264.7304
- Rent YoY
- —
- Metro
- —
- State GDP YoY
- ▲ 1.37%
- F500 in state
- 28
Industry mix (Fortune 500 HQ in MI)
| Industry | F500 HQs | Revenue |
|---|---|---|
| Automotive Parts | 3 | $48B |
|
||
| Automotive | 2 | $372B |
|
||
| Chemicals | 1 | $45B |
|
||
| Automotive Retail | 1 | $29B |
|
||
| Healthcare / Medical Devices | 1 | $23B |
|
||
| Automotive Technology | 1 | $20B |
|
||
Price history
+64.2% since first listed12 events — show timeline
- 2026-05-28 Listed $550,000 REALCOMP
- 2026-05-28 Listed $550,000 SW Michigan MLS
- 2026-05-28 Listed $550,000 MiRealSource-MiMLS
- 2015-12-10 Sold (Public Records) $328,900 Public Records
- 2015-11-13 Sold (MLS) $328,900 SW Michigan MLS
- 2015-11-13 Sold (MLS) $328,900 REALCOMP
- 2015-11-05 Pending — SW Michigan MLS
- 2015-10-06 Price Changed $334,900 SW Michigan MLS
- 2015-09-24 Relisted — SW Michigan MLS
- 2015-09-24 Listing Removed — SW Michigan MLS
- 2015-09-20 Listed $339,900 SW Michigan MLS
- 2015-09-18 Listed $334,900 REALCOMP
Property tax history
+2.9%/yrLatest (2025): $4,989 · +3.9% YoY. Source: county tax records.
Cash-flow waterfall
monthlySold comps — $/sqft
last 12 mo · ≤1 miLoading sold comps…