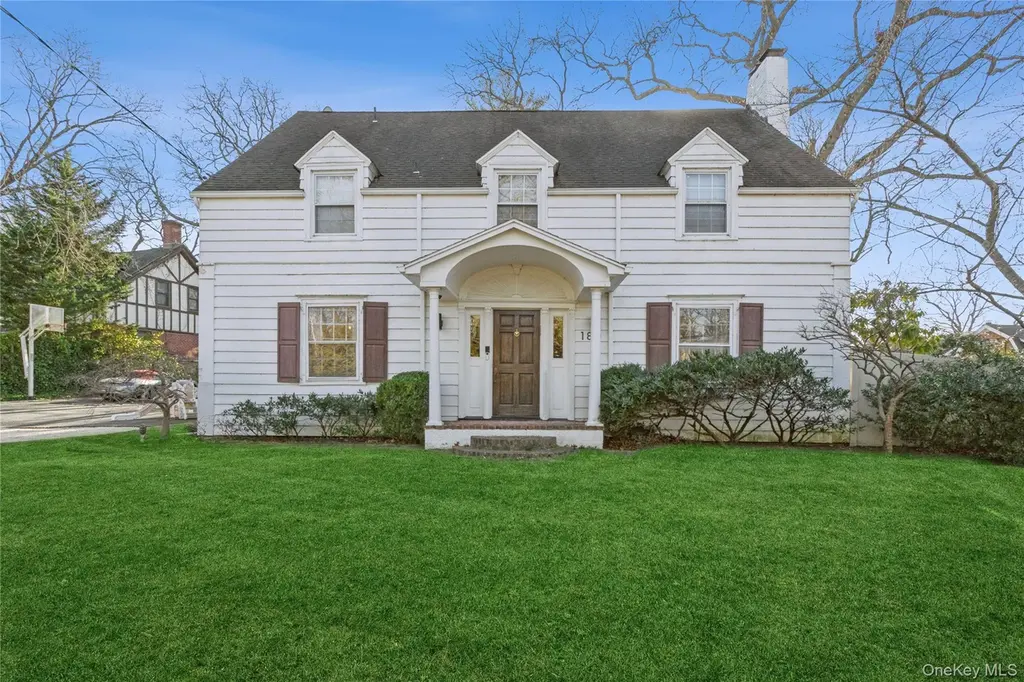
180 Longwood Xing · Lawrence, NY
Flood risk 5/10 · Moderate
- FEMA flood zone
- X (unshaded)
- Chance of flooding over 30 yrs
- 0.51%
- Est. flood insurance / yr
- $473 – $860
Fire risk 2/10 · Minimal
- Est. fire insurance / yr
- $691 – $1,283
Heat risk 6/10 · Moderate
- Hot days now (above 95°F)
- 7 days/yr
- Hot days in 30 yrs
- 14 days/yr
Wind risk 8/10 · Major
- Chance of severe wind over 30 yrs
- 80.0%
Air-quality risk 4/10 · Minor
- Unhealthy air days now
- 4 days/yr
- Unhealthy air days in 30 yrs
- 6 days/yr
Risk factors via First Street. Map © Google.
Why this score? — see what drove the D grade
The composite is a weighted blend of 9 inputs, each scored 0–100. Each bar is that input's sub-score; the figure is the points it added to the 100-point composite (weight × sub-score).
- Appreciation +10.0/10.0
- Cash flow +9.4/30.0
- ARV discount +7.5/15.0
- Schools +4.2/10.0
- Livability +3.0/5.0
- DSCR +2.6/10.0
- Rent growth +2.5/5.0
- Condition / age +2.5/5.0
- 1% rule +1.8/10.0
$3,350,000
🖨 Deal sheet (PDF) 📄 Offer letter ✓ Due diligence
Listing remarks MLS
Step into this timeless colonial-style home, featuring five bedrooms and four and a half baths. The elegant design include an expansive Eat in kitchen a formal living room, a dining room, and a cozy den with views of the spacious backyard. An added feature is a full 3rd floor office ,Den and full bath. Nestled in the back of Lawrence, this home sits on close to an acre of beautifully landscaped property, complete with a stunning pool and low taxes! Close to all house of worship! make it your own. All offers being reviewed. Great opportunity
Key facts
- Colonial style home
- Cozy den
- Expansive kitchen
Tags
Neighborhood map
What this means for you Summary
Snapshot
- This is a 5-bed/5.0-bath single-family listed at $3.35M.
Deal economics
- At list price, monthly cash flow is $-2k ($-29k/yr) — negative.
- To cash-flow at today's rent, offer at most $2.93M (12.6% below list).
- To meet the 1% rule (rent ≥ 1% of price), the offer needs to be $2.28M (31.9% below list).
- Recommended offer: $2.28M (31.9% below list) — sets the bar for 1% rule.
- Cap rate 5.4% vs local median 2.8% in Lawrence — top-decile yield for the area; either an underpriced asset or a hidden risk that comps aren't pricing in. Stress-test before assuming the spread holds.
Location & tenants
- Location reads 60/100 on livability (#981 in NY) — a middle-class / working-renter tenant base. Strengths: crime A+, employment A+; Watch: housing C-, amenities F, commute F.
- Lawrence Union Free School District (suburban): math 43% / reading 46% proficiency, ranked #399 of 590 in NY (top 68%) — families likely to look elsewhere, expect single-tenant / working-renter base with shorter leases.
- Zoned schools: Lawrence Middle School At Broadway Campus (math 12% / reading 37%, grade F, #611 of 729 statewide, top 88%, 405 students, 79% FRL); Lawrence Senior High School (math 87% / reading 30%, grade C, #877 of 1,100 statewide, top 80%, 770 students, 70% FRL) — zoned schools average 75% FRL vs 52% district-wide (23 pts higher); higher-poverty schools than district average — tighter screening recommended.
- Market conditions: 53 active listings in the ZIP; 8 comparable units currently listed for rent nearby; rentals at typical pace (median 27d on market — plan ~3-4 weeks tenant-placement turnaround); 824 units permitted in Nassau County in 2024 (153 in 5+ unit buildings).
Forward outlook
- In year one you build about $358k of equity ($23k loan paydown + $335k appreciation (10.0% local appreciation)).
- Nassau County population projected at +7% by 2050 — modest demand growth; plan on rents tracking national, not racing it.
- By year 2, paydown + projected appreciation supports a ~$576k cash-out refi (75% LTV) — recoverable capital for the next deal without selling this one.
Negotiation context
- It's been on market 520 days — a 12% lower offer ($2.95M) is reasonable based on typical stale-listing flexibility.
- Current owner paid $540k; list at $3.35M implies a 520% gain — meaningful room to come down on a strong offer.
Risks & watch-outs
- Watch-outs: built in 1923 — expect roof / HVAC / electrical / plumbing capex.
- Climate carrying-cost: moderate flood risk; severe wind risk, 80% chance of damaging wind over 30y; extreme-heat days projected 7→14/yr by 2055 (HVAC capex compounding) — expect insurance premiums to compound above CPI over the hold.
Questions for the listing agent
- What do current leases actually rent for vs. the listed asking? Can we see a recent rent roll and the last 12 months of T-12 income?
- It's been on market 520 days. Have you received any prior offers? Is the seller open to a 32% concession, seller financing, or rate buy-down credit?
- Built in 1923 — when were the roof, HVAC, electrical panel, plumbing, and water heater last replaced?
- Why hasn't it sold? Are there any deal-killer items the seller is aware of (foundation, flood, title, zoning, code violations)?
- Is there a deadline driving the sale (1031 exchange, divorce, estate, relocation)? That informs how much negotiation room exists.
- The area grade is low — what's the realistic commute time and amenity access for the typical tenant pool here? Any planned neighborhood developments (good or bad) we should know about?
- What's the average days-on-market for RENTAL listings here right now (not sales)? A rising rental-DOM trend means longer vacancies and softer asking-rent achievability than the comps imply.
- What's the recent tenant-quality profile in this submarket — average credit score on applications, eviction rate, late-payment / NSF rate, and stable-employment percentage? A property-management company in the area should have these aggregated.
- How much new for-sale + rental construction is in the pipeline within 1–3 miles? Heavy new supply typically softens prices + rents 12–24 months out; constrained supply supports both.
Investment metrics
- 1% rule
- 0.68% ✗
- Cap rate
- 5.44%
- Cash-on-cash
- -3.05%
- DSCR
- 0.86
- GRM
- 12.2
CMA / ARV
- ARV (median comp)
- $2,072,579
- List price
- $3,350,000
- Delta
- 61.63%
- Verdict
- OVERPRICED
- Comps
- 12 within 1.0 mi
Show comp detail 5 sales within ~0.75 mi
| Address | Dist | Beds/Ba | Sqft | Sold | Price | $/sf | Match |
|---|---|---|---|---|---|---|---|
| 235 Ocean Ave | 0.50mi | 5/3.0 | 3,013 (-3%) | 4mo | $1,999,999 | $664 | 60 |
| 26 Bayberry Rd | 0.26mi | 5/4.0 | 2,800 (-10%) | 11mo | $2,400,000 | $857 | 59 |
| 520 Chauncey Ln | 0.39mi | 5/2.5 | 3,240 (+4%) | 10mo | $1,800,000 | $556 | 56 |
| 7 Stuyvesant Pl | 0.53mi | 4/3.5 (-1) | 2,888 (-7%) | 5mo | $2,400,000 | $831 | 49 |
| 16 Hawthorne Ln | 0.61mi | 4/4.0 (-1) | 3,032 (-2%) | 13mo | $1,999,000 | $659 | 48 |
Match score weights: distance 35% · size 25% · config 20% · recency 20%. Top-matched comps best support the ARV.
Projected returns pro-forma
10.0% appreciation · 3.0% rent growth · sell at horizon
- IRR
- 22.1%
- Equity multiple
- 2.78×
- Total profit
- $1,671,067
- Equity at exit
- $3,017,945
- IRR
- 19.8%
- Equity multiple
- 6.37×
- Total profit
- $5,037,943
- Equity at exit
- $6,508,313
Cash invested: $938,000 (down + closing). Projections, not guarantees.
Landlord ↔ Tenant lean methodology
- Overall (STATE)
- 15 Strongly Tenant-Friendly
- State New York
- 15 Strongly Tenant-Friendly · D+10
- County
- — inherits STATE
- City
- — inherits STATE
ZIP-level market 11559
- Home prices YoY
- 4.1%
- Active inventory
- 53
- Price-to-rent
- 12.2×
Monthly cashflow live
- Estimated rent
- $22,805 high interval (Pro) →
- Mortgage (P&I)
- −$17,568
- Tax from tax record
- −$1,440 /mo · $17,281/yr
- Insurance
- −$1,396
- HOA
- −$0
- Vacancy / Maint / Mgmt
- −$4,789
- Net cashflow
- $-2,388
Break-even live
Sensitivity live
| Price | -10% $-492 | -5% $-1,440 | +0% $-2,388 | +5% $-3,336 | +10% $-4,284 |
|---|---|---|---|---|---|
| Rent | -10% $-4,189 | -5% $-3,289 | +0% $-2,388 | +5% $-1,487 | +10% $-586 |
| Rate | -1.0pp $-701 | -0.5pp $-1,536 | base $-2,388 | +0.5pp $-3,256 | +1.0pp $-4,139 |
UW: 25.0% down · 7.5% · 30yr · 1.5% tax · 5.0% vac · 8.0% maint · 8.0% mgmt
Financing live
Cash to close
- Down payment
- $837,500
- Closing costs
- $100,500
- Reserves months
- —
- Total cash needed
- —
Loan-product check · same deal, 3 products live
Conventional
25% down · 7.5% · 30yr
- Down + closing
- —
- Monthly P&I
- —
- Monthly cashflow
- —
- DSCR
- —
- Eligible?
- —
Personal DTI + credit; lowest rate.
DSCR
20% down · 8.5% · 30yr
- Down + closing
- —
- Monthly P&I
- —
- Monthly cashflow
- —
- DSCR
- —
- Eligible?
- —
No personal income docs; deal must DSCR.
Hard money
10% down · 12.0% · 12mo
- Down + closing
- —
- Monthly P&I
- —
- Monthly cashflow
- —
- DSCR
- —
- Eligible?
- —
Short-term bridge; refi at stabilization.
Rent comps 8 comps
| Address | Beds | Baths | Sqft | Rent | $/sqft | DOM | Units | Dist |
|---|---|---|---|---|---|---|---|---|
| 49 Harborview W Lawrence, NY | 4.0 | 4.5 | 3877 | $35,000 | $9.03 | 45d | 1 | 0.74mi |
| 128 Hards Ln Lawrence, NY | 4.0 | 2.5 | 2685 | $8,000 | $2.98 | 45d | 1 | 1.01mi |
| 803 Barberry Ln Woodmere, NY | 6.0 | 3.5 | 4400 | $8,600 | $1.95 | 0d | 1 | 1.12mi |
| 1701 Bay Blvd Atlantic Beach, NY | 4.0 | 3.0 | 2730 | $25,000 | $9.16 | 26d | 1 | 1.37mi |
| 1495 Bay Blvd Atlantic Beach, NY | 6.0 | 4.5 | 3744 | $20,000 | $5.34 | 0d | 1 | 1.44mi |
| 486 Oxford Rd Cedarhurst, NY | 6.0 | 3.5 | 3465 | $8,000 | $2.31 | 4d | 1 | 1.44mi |
| 77 Tioga Ave Atlantic Beach, NY | 4.0 | 2.5 | 2800 | $5,800 | $2.07 | 26d | 1 | 1.46mi |
| 215 Scott Dr Atlantic Beach, NY | 5.0 | 3.0 | 2862 | $22,500 | $7.86 | 0d | 1 | 1.50mi |
Listing history 21 events
-
2026-06-21days on market $3,350,000 Active 520 DOM
-
2026-06-18days on market $3,350,000 Active 517 DOM
-
2026-06-17days on market $3,350,000 Active 516 DOM
-
2026-06-16remarks 623-char remark
-
2026-06-16days on market $3,350,000 Active 515 DOM
-
2026-06-15days on market $3,350,000 Active 514 DOM
-
2026-06-13days on market $3,350,000 Active 512 DOM
-
2026-06-13days on market $3,350,000 Active 511 DOM
-
2026-06-09days on market $3,350,000 Active 508 DOM
-
2026-06-08days on market $3,350,000 Active 507 DOM
-
2026-06-07days on market $3,350,000 Active 506 DOM
-
2026-06-04days on market $3,350,000 Active 503 DOM
-
2026-06-03days on market $3,350,000 Active 502 DOM
-
2026-06-02days on market $3,350,000 Active 501 DOM
-
2026-06-01days on market $3,350,000 Active 500 DOM
-
2026-05-31days on market $3,350,000 Active 499 DOM
-
2026-04-13price $3,350,000 546-char remark
Show marketing remark (546 chars)
Step into this timeless colonial-style home, featuring five bedrooms and four and a half baths. The elegant design include an expansive Eat in kitchen a formal living room, a dining room, and a cozy den with views of the spacious backyard. An added feature is a full 3rd floor office ,Den and full bath. Nestled in the back of Lawrence, this home sits on close to an acre of beautifully landscaped property, complete with a stunning pool and low taxes! Close to all house of worship! make it your own. All offers being reviewed. Great opportunity
-
2025-06-20price $3,899,000 546-char remark
Show marketing remark (546 chars)
Step into this timeless colonial-style home, featuring five bedrooms and four and a half baths. The elegant design include an expansive Eat in kitchen a formal living room, a dining room, and a cozy den with views of the spacious backyard. An added feature is a full 3rd floor office ,Den and full bath. Nestled in the back of Lawrence, this home sits on close to an acre of beautifully landscaped property, complete with a stunning pool and low taxes! Close to all house of worship! make it your own. All offers being reviewed. Great opportunity
-
2025-01-17$4,599,000 Active 546-char remark
Show marketing remark (546 chars)
Step into this timeless colonial-style home, featuring five bedrooms and four and a half baths. The elegant design include an expansive Eat in kitchen a formal living room, a dining room, and a cozy den with views of the spacious backyard. An added feature is a full 3rd floor office ,Den and full bath. Nestled in the back of Lawrence, this home sits on close to an acre of beautifully landscaped property, complete with a stunning pool and low taxes! Close to all house of worship! make it your own. All offers being reviewed. Great opportunity
-
1996-02-16soldstatus $540,000
-
1974-08-01soldstatus $90,000
ⓘ Source: listings_history table (triggers on properties + properties_extension) + one-shot
backfill from property_details.listing_events for pre-trigger history.
Tax reassessment forecast NY · Partial reset (capped growth)
- Current annual tax
- $17,281 · $1,440/mo
- Projected year-2 tax
- $36,948 · $3,079/mo
- Expected delta
- +$19,667/yr (+$1,639/mo · 113.8%)
ⓘ Screening estimate from a state-policy table — verify with the county assessor before closing.
Climate risk First Street
- Flood 5/10 Major FEMA zone X (unshaded) · 51% chance over 30 yrs
- Wildfire 2/10 Low
- Heat 6/10 Major 7 d/yr ≥95°F today · 14 d/yr by 30 yrs out
- Wind 8/10 Severe 80% chance of damaging wind over 30 yrs
- Air quality 4/10 Moderate 4 unhealthy d/yr today · 6 by 30 yrs out
Nearby sold comps map
Loading sold comps map…
Walkable amenities ~0.75 mi
Loading nearby amenities…
Taxation est. · year 1
- Rental income
- $273,657
- − Mortgage interest
- −$187,652
- − Property taxes
- −$17,281
- − Insurance
- −$16,750
- − Repairs & maintenance
- −$21,893
- − Management
- −$21,893
- − Depreciation
- −$97,455
- Taxable loss
- −$89,266
- Est. tax savings @ 24.0%
- +$21,424
- After-tax cash flow
- $-7,231/yr
For passive investors: Depreciation is non-cash, so a rental often shows a tax loss while cash-flowing — sheltering income. Rental losses are passive: they offset passive income freely, and up to $25,000/yr can offset ordinary (W-2) income if you actively participate and your MAGI is under $100k (phasing out to $0 by $150k); unused losses carry forward. On sale, claimed depreciation is recaptured at up to 25%, and gains may owe capital-gains tax (a 1031 exchange can defer both). Figures are a year-1 estimate at your 24.0% rate — not tax advice; consult a CPA.
Schools (NCES district)
- District
- Lawrence Union Free School District
- NCES district ID
- 3616830
- Math proficiency
- 43% ▼ -2.00%
- Reading proficiency
- 46% ▼ -8.00%
- Median HH income
- $91,008
- Composite
- 42.14/100
- National rank
- #3307
- State rank
- #399 of 590 in NY
Livability — Lawrence
- Score
- 60/100
- State rank
- #981
- US rank
- #19168
Category grades
Schools grade is shown separately in the Schools card above.
Census & demographics
- Census place
- Lawrence, NY
- City population
- 9,130
- Population (ZIP)
- 9,130
Population outlook (Nassau County) Hauer SSP2
- Today (2025)
- 1,409,302 people
- By 2030
- 1,431,482 · +1.6%
- By 2040
- 1,471,607 · +4.4%
- By 2050
- 1,502,845 · +6.6%
- By 2075
- 1,575,403 · +11.8%
- By 2100
- 1,554,356 · +10.3%
Race, ethnicity, and origin ACS 2023
- Neighborhood character
- Predominantly White (76%)
- Race & ethnicity
- White 76% Hispanic / Latino 17% Black 5% Two or more races 2% Asian 2%
- Hispanic origin (detail)
- Puerto Rican 3% Dominican 2%
- Common ancestry
- Romanian 19% Slovak 3% Hispanic 3%
- Foreign-born
- 20% · Canada
- Languages at home
- 67% English-only · Spanish 11% French/Haitian/Cajun 4% Russian/Polish/Slavic 3%
Political lean MEDSL · Nassau
- 2024 margin
- Toss-up / Even · D 47.9% · R 52.1%
- 2008→2024 swing
- -12.6pp toward R · 2008: 8.4pp · 2024: -4.2pp
- All cycles
- 2024: R+4.2 2020: D+9.5 2016: D+5.3 2012: D+6.7 2008: D+8.4
Not yet ingested
- Civics
- —
Market trends
- HPI YoY
- ▲ 17.24%
- Current HPI
- 436.7253
- Rent YoY
- —
- Metro
- —
- State GDP YoY
- ▲ 2.60%
- F500 in state
- 92
Industry mix (Fortune 500 HQ in NY)
| Industry | F500 HQs | Revenue |
|---|---|---|
| Financial Services | 10 | $950B |
|
||
| Consumer Goods | 9 | $162B |
|
||
| Insurance | 4 | $225B |
|
||
| Telecommunications | 2 | $144B |
|
||
| Pharmaceuticals | 2 | $112B |
|
||
| Media / Entertainment | 2 | $69B |
|
||
Price history
+3622.2% since first listed5 events — show timeline
- 2026-04-13 Price Changed $3,350,000 OneKey® MLS as Distributed by MLS Grid
- 2025-06-20 Price Changed $3,899,000 OneKey® MLS as Distributed by MLS Grid
- 2025-01-17 Listed $4,599,000 OneKey® MLS as Distributed by MLS Grid
- 1996-02-16 Sold (Public Records) $540,000 Public Records
- 1974-08-01 Sold (Public Records) $90,000 Public Records
Property tax history
-0.3%/yrLatest (2024): $17,281 · -8.0% YoY. Source: county tax records.
Cash-flow waterfall
monthlySold comps — $/sqft
last 12 mo · ≤1 miLoading sold comps…