 🏷️ Likely Rental
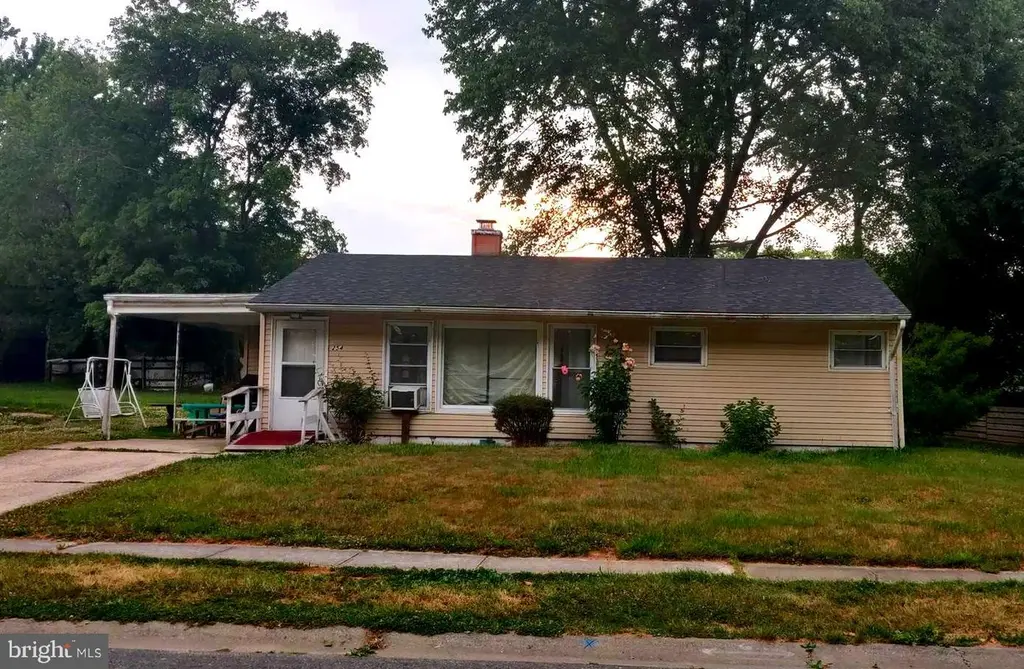
254 N Governors Blvd · Kent Acres, DE
Flood risk 1/10 · Minimal
- FEMA flood zone
- X (unshaded)
- Chance of flooding over 30 yrs
- 0.0%
- Est. flood insurance / yr
- $507 – $1,088
Fire risk 1/10 · Minimal
- Est. fire insurance / yr
- $476 – $884
Heat risk 8/10 · Major
- Hot days now (above 100°F)
- 7 days/yr
- Hot days in 30 yrs
- 16 days/yr
Wind risk 7/10 · Major
- Chance of severe wind over 30 yrs
- 78.0%
Air-quality risk 2/10 · Minimal
- Unhealthy air days now
- 1 days/yr
- Unhealthy air days in 30 yrs
- 2 days/yr
Risk factors via First Street. Map © Google.
Why this score? — see what drove the B- grade
The composite is a weighted blend of 9 inputs, each scored 0–100. Each bar is that input's sub-score; the figure is the points it added to the 100-point composite (weight × sub-score).
- Cash flow +26.5/30.0
- ARV discount +15.0/15.0
- DSCR +9.0/10.0
- 1% rule +6.5/10.0
- Livability +3.3/5.0
- Rent growth +3.0/5.0
- Condition / age +2.5/5.0
- Schools +2.0/10.0
- Appreciation +0.0/10.0
$160,000
🖨 Deal sheet (PDF) 📄 Offer letter ✓ Due diligence
Listing remarks MLS
"INVESTOR ALERT" "REDUCED" 3 bed, 1 Bath Ranch Home in Capitol Park. Nice Cabinets in Kitchen, Separate Eating Area. Nice Size Living Room. All Newer Windows, New Bathtub and Surround. Floored Attic Storage. Currently renting for 700.00 with tenant in place.
Key facts
- 8,320 sq ft lot
- Parking
- Built 1954
Property features AI
Exterior
- Parking: Concrete driveway; Driveway parking; Attached carport (1 space); Total of 1 garage/parking space
- Utilities: Public water; Public sewer
- Home design: Detached structure; Fee simple ownership; Average condition; Architectural shingle roof
- Construction: Vinyl and aluminum siding; Slab foundation
- Exterior features: Street lights; Lot approximately 96.8 x 110.1
Interior
- Kitchen: Kitchen on main level
- Bedrooms: Three bedrooms on the main level (Bedroom 1, Bedroom 2, Bedroom 3)
- Flooring: Luxury vinyl tile
- Bathrooms: One full bathroom on the main level
- Heating & cooling: Hot water heating; Oil fuel for heating; Electric cooling
- Interior features: Luxury vinyl tile flooring; Living room; Dining room; No basement
Neighborhood map
What this means for you Summary
Snapshot
- This is a 3-bed/1.0-bath single-family listed at $160k.
Deal economics
- At list price, monthly cash flow is $424 ($5k/yr) — positive.
- The deal already cash-flows at list — no discount required.
- Meets the 1% rule at list price ($2k rent vs $160k).
- Recommended offer: $155k (3.0% below list) — sets the bar for market timing.
Location & tenants
- Location reads 66/100 on livability (#41 in DE) — a middle-class / working-renter tenant base. Strengths: crime A+, cost of living A+, health & safety B; Watch: amenities F, commute F, employment D-.
- Capital School District (urban): math 14% / reading 31% proficiency, ranked #24 of 26 in DE (top 92%) — low school quality limits family demand, transient renter base, plan for 1-2y turnover.
- Zoned schools: South Dover Elementary School (math 12% / reading 27%, grade F, #78 of 105 statewide, top 78%, 610 students, 0% FRL); Central Middle School (math 12% / reading 31%, grade F, #27 of 36 statewide, top 77%, 860 students, 0% FRL); Dover High School (math 21% / reading 45%, grade F, #22 of 40 statewide, top 56%, 1,771 students, 0% FRL) — zoned schools average 0% FRL vs 56% district-wide (56 pts lower); this property's tenant base skews higher-income than the district average.
- Market conditions: Rents rising (+2.0%/yr); 190 active listings in the ZIP; 5 comparable units currently listed for rent nearby; rentals lingering (median 46d on market — plan ~5-8 weeks vacancy on turnover, expect pricing pressure); 100% of comp listings sitting > 30 days — soft ceiling on asking rent; 1,201 units permitted in Kent County in 2024 (116 in 5+ unit buildings).
- This rent runs 33% of the median local income ($66k/yr) — at the standard rent-burdened threshold; future hikes will face affordability resistance.
Forward outlook
- Local home prices are declining (-3.0%/yr); year-one equity from $1k of loan paydown is wiped out by about $5k of value loss. Plan a longer hold.
- Kent County population projected at +22% by 2050 — long-run rental-demand tailwind backs the buy-and-hold thesis.
Negotiation context
- It's been on market 39 days — a 3% lower offer ($155k) is reasonable based on typical stale-listing flexibility.
- 6 sale attempts since 30y ago with the ask held roughly flat each time — persistent listings suggest the price (not the market) is what's stuck; bring a comps-based counter.
- Current owner paid $45k; list at $160k implies a 256% gain — meaningful room to come down on a strong offer.
Risks & watch-outs
- Watch-outs: built in 1954 — expect roof / HVAC / electrical / plumbing capex.
- Climate carrying-cost: major wind risk, 78% chance of damaging wind over 30y; extreme-heat days projected 7→16/yr by 2055 (HVAC capex compounding) — expect insurance premiums to compound above CPI over the hold.
Questions for the listing agent
- It's been on market 39 days. Have you received any prior offers? Is the seller open to a 3% concession, seller financing, or rate buy-down credit?
- Built in 1954 — when were the roof, HVAC, electrical panel, plumbing, and water heater last replaced?
- Is there a deadline driving the sale (1031 exchange, divorce, estate, relocation)? That informs how much negotiation room exists.
- Schools are F-rated, which usually means shorter tenancies and higher turnover. Who's the typical renter profile here, and what's been the actual vacancy rate?
- What's the average days-on-market for RENTAL listings here right now (not sales)? A rising rental-DOM trend means longer vacancies and softer asking-rent achievability than the comps imply.
- What's the recent tenant-quality profile in this submarket — average credit score on applications, eviction rate, late-payment / NSF rate, and stable-employment percentage? A property-management company in the area should have these aggregated.
- How much new for-sale + rental construction is in the pipeline within 1–3 miles? Heavy new supply typically softens prices + rents 12–24 months out; constrained supply supports both.
Investment metrics
- 1% rule
- 1.15% ✓
- Cap rate
- 9.47%
- Cash-on-cash
- 11.35%
- DSCR
- 1.50
- GRM
- 7.3
CMA / ARV
- ARV (median comp)
- $205,413
- List price
- $160,000
- Delta
- -22.11%
- Verdict
- UNDERPRICED
- Comps
- 20 within 1.0 mi
Show comp detail 12 sales within ~0.75 mi
| Address | Dist | Beds/Ba | Sqft | Sold | Price | $/sf | Match |
|---|---|---|---|---|---|---|---|
| 2 Congress Pl | 0.12mi | 3/1.0 | 944 (0%) | 1mo | $238,000 | $252 | 94 |
| 223 President | 0.07mi | 3/1.0 | 944 (0%) | 6mo | $200,000 | $212 | 92 |
| 1 Congress Pl | 0.14mi | 3/1.0 | 944 (0%) | 8mo | $240,000 | $254 | 87 |
| 230 President Dr | 0.05mi | 3/1.0 | 944 (0%) | 13mo | $210,000 | $222 | 87 |
| 153 President Dr | 0.25mi | 3/1.0 | 944 (0%) | 6mo | $222,000 | $235 | 83 |
| 126 President Dr | 0.35mi | 3/1.0 | 944 (0%) | 10mo | $217,000 | $230 | 75 |
| 115 President Dr | 0.38mi | 3/1.0 | 950 (+1%) | 10mo | $219,900 | $231 | 73 |
| 151 Roosevelt Ave Unit D5 | 0.44mi | 2/1.0 (-1) | 980 (+4%) | 17mo | $65,500 | $67 | 53 |
| 121 S Governors Blvd | 0.39mi | 3/1.0 | 1,082 (+15%) | 7mo | $152,500 | $141 | 52 |
| 234 Pine St | 0.72mi | 2/1.0 (-1) | 897 (-5%) | 2mo | $240,000 | $268 | 52 |
| 201 Orchard Ave | 0.68mi | 3/1.0 | 1,066 (+13%) | 8mo | $287,100 | $269 | 40 |
| 1131 S Bay Rd #84 | 0.74mi | 2/1.0 (-1) | 1,050 (+11%) | 11mo | $25,000 | $24 | 32 |
Match score weights: distance 35% · size 25% · config 20% · recency 20%. Top-matched comps best support the ARV.
Projected returns pro-forma
-3.0% appreciation · 2.03% rent growth · sell at horizon
- IRR
- -0.4%
- Equity multiple
- 0.98×
- Total profit
- $-737
- Equity at exit
- $23,857
- IRR
- 8.2%
- Equity multiple
- 1.60×
- Total profit
- $26,878
- Equity at exit
- $13,834
Cash invested: $44,800 (down + closing). Projections, not guarantees.
Landlord ↔ Tenant lean methodology
- Overall (STATE)
- 70 Landlord-Friendly
- State Delaware
- 70 Landlord-Friendly · D+7
- County
- — inherits STATE
- City
- — inherits STATE
ZIP-level market 19901
- Rents YoY
- 2.0%
- Active inventory
- 190
- Price-to-rent
- 7.3×
Monthly cashflow live
- Estimated rent
- $1,837 high interval (Pro) →
- Mortgage (P&I)
- −$839
- Tax from tax record
- −$122 /mo · $1,459/yr
- Insurance
- −$67
- HOA
- −$0
- Vacancy / Maint / Mgmt
- −$386
- Net cashflow
- $424
Break-even live
Sensitivity live
| Price | -10% $514 | -5% $469 | +0% $424 | +5% $378 | +10% $333 |
|---|---|---|---|---|---|
| Rent | -10% $279 | -5% $351 | +0% $424 | +5% $496 | +10% $569 |
| Rate | -1.0pp $504 | -0.5pp $464 | base $424 | +0.5pp $382 | +1.0pp $340 |
UW: 25.0% down · 7.5% · 30yr · 1.5% tax · 5.0% vac · 8.0% maint · 8.0% mgmt
Financing live
Cash to close
- Down payment
- $40,000
- Closing costs
- $4,800
- Reserves months
- —
- Total cash needed
- —
Loan-product check · same deal, 3 products live
Conventional
25% down · 7.5% · 30yr
- Down + closing
- —
- Monthly P&I
- —
- Monthly cashflow
- —
- DSCR
- —
- Eligible?
- —
Personal DTI + credit; lowest rate.
DSCR
20% down · 8.5% · 30yr
- Down + closing
- —
- Monthly P&I
- —
- Monthly cashflow
- —
- DSCR
- —
- Eligible?
- —
No personal income docs; deal must DSCR.
Hard money
10% down · 12.0% · 12mo
- Down + closing
- —
- Monthly P&I
- —
- Monthly cashflow
- —
- DSCR
- —
- Eligible?
- —
Short-term bridge; refi at stabilization.
Rent comps 5 comps
| Address | Beds | Baths | Sqft | Rent | $/sqft | DOM | Units | Dist |
|---|---|---|---|---|---|---|---|---|
| 814 New Castle Ave Dover, DE | 3.0 | 1.0 | 950 | $1,650 | $1.74 | 46d | 1 | 0.96mi |
| 2030 Generals Way Dover, DE | 2.0 | 1.0 | 660 | $1,499 | $2.27 | 46d | 1 | 1.13mi |
| 480 Country Dr Dover, DE | 3.0 | 1.0–2.0 | 715 | $1,875 | $2.62 | 46d | 22 | 1.18mi |
| 4 Carolee Dr Dover, DE | 3.0 | 1.0 | 1008 | $2,100 | $2.08 | 46d | 1 | 1.37mi |
| 51 Webbs Ln Dover, DE | 2.0 | 1.0–1.5 | 787 | $1,525 | $1.94 | 46d | 11 | 1.42mi |
Listing history 34 events
-
2026-06-22statusdays on market $160,000 Pending 39 DOM
-
2026-06-19days on market $160,000 Active 38 DOM
-
2026-06-18days on market $160,000 Active 37 DOM
-
2026-06-17days on market $160,000 Active 36 DOM
-
2026-06-16days on market $160,000 Active 35 DOM
-
2026-06-15days on market $160,000 Active 34 DOM
-
2026-06-14days on market $160,000 Active 32 DOM
-
2026-06-13days on market $160,000 Active 31 DOM
-
2026-06-10days on market $160,000 Active 29 DOM
-
2026-06-09days on market $160,000 Active 28 DOM
-
2026-06-08days on market $160,000 Active 27 DOM
-
2026-06-07days on market $160,000 Active 26 DOM
-
2026-06-02days on market $160,000 Active 21 DOM
-
2026-06-01days on market $160,000 Active 20 DOM
-
2026-05-31days on market $160,000 Active 19 DOM
-
2026-05-30days on market $160,000 Active 18 DOM
-
2026-05-13$160,000 Active 632-char remark
-
2026-05-08historical $160,000 632-char remark
-
2023-10-17historical
-
2023-06-26$155,000 Active
-
2017-12-29soldstatus $45,000
-
2017-12-21soldstatus $45,000 Closed
Show marketing remark (279 chars)
"INVESTOR ALERT" "REDUCED" 3 bed, 1 Bath Ranch Home in Capitol Park. Nice Cabinets in Kitchen, Separate Eating Area. Nice Size Living Room. All Newer Windows, New Bathtub and Surround. Floored Attic Storage. Currently renting for 700.00 with tenant in place.
-
2017-12-21soldstatus $45,000 Sold
Show marketing remark (279 chars)
"INVESTOR ALERT" "REDUCED" 3 bed, 1 Bath Ranch Home in Capitol Park. Nice Cabinets in Kitchen, Separate Eating Area. Nice Size Living Room. All Newer Windows, New Bathtub and Surround. Floored Attic Storage. Currently renting for 700.00 with tenant in place.
-
2017-11-22status Under Contract
-
2017-09-12price $59,500
-
2017-06-24price $62,500
-
2017-03-21$69,000 Active
Show marketing remark (279 chars)
"INVESTOR ALERT" "REDUCED" 3 bed, 1 Bath Ranch Home in Capitol Park. Nice Cabinets in Kitchen, Separate Eating Area. Nice Size Living Room. All Newer Windows, New Bathtub and Surround. Floored Attic Storage. Currently renting for 700.00 with tenant in place.
-
2017-03-21$59,500 Active
Show marketing remark (279 chars)
"INVESTOR ALERT" "REDUCED" 3 bed, 1 Bath Ranch Home in Capitol Park. Nice Cabinets in Kitchen, Separate Eating Area. Nice Size Living Room. All Newer Windows, New Bathtub and Surround. Floored Attic Storage. Currently renting for 700.00 with tenant in place.
-
2005-09-15soldstatus $80,000
-
2005-09-08soldstatus $80,000
-
2005-08-15historical
-
2005-08-01$80,000
-
1998-02-03historical
-
1996-08-15$49,900
ⓘ Source: listings_history table (triggers on properties + properties_extension) + one-shot
backfill from property_details.listing_events for pre-trigger history.
Tax reassessment forecast DE · Partial reset (capped growth)
- Current annual tax
- $1,459 · $122/mo
- Projected year-2 tax
- $1,459 · $122/mo
- Expected delta
- $0/yr ($0/mo · 0.0%)
ⓘ Screening estimate from a state-policy table — verify with the county assessor before closing.
Climate risk First Street
- Flood 1/10 Low FEMA zone X (unshaded) · 0% chance over 30 yrs
- Wildfire 1/10 Low
- Heat 8/10 Severe 7 d/yr ≥100°F today · 16 d/yr by 30 yrs out
- Wind 7/10 Severe 78% chance of damaging wind over 30 yrs
- Air quality 2/10 Low 1 unhealthy d/yr today · 2 by 30 yrs out
Nearby sold comps map
Loading sold comps map…
Walkable amenities ~0.75 mi
Loading nearby amenities…
Taxation est. · year 1
- Rental income
- $22,041
- − Mortgage interest
- −$8,962
- − Property taxes
- −$1,459
- − Insurance
- −$800
- − Repairs & maintenance
- −$1,763
- − Management
- −$1,763
- − Depreciation
- −$4,655
- Taxable income
- $2,638
- Est. tax owed @ 24.0%
- −$633
- After-tax cash flow
- $4,451/yr
For passive investors: Depreciation is non-cash, so a rental often shows a tax loss while cash-flowing — sheltering income. Rental losses are passive: they offset passive income freely, and up to $25,000/yr can offset ordinary (W-2) income if you actively participate and your MAGI is under $100k (phasing out to $0 by $150k); unused losses carry forward. On sale, claimed depreciation is recaptured at up to 25%, and gains may owe capital-gains tax (a 1031 exchange can defer both). Figures are a year-1 estimate at your 24.0% rate — not tax advice; consult a CPA.
Schools (NCES district)
- District
- Capital School District
- NCES district ID
- 1000190
- Math proficiency
- 14% ▼ -17.00%
- Reading proficiency
- 31% ▼ -12.00%
- Median HH income
- $48,499
- Composite
- 19.78/100
- National rank
- #8703
- State rank
- #24 of 26 in DE
Livability — Kent Acres
- Score
- 66/100
- State rank
- #41
- US rank
- #11466
Category grades
Schools grade is shown separately in the Schools card above.
Census & demographics
- County
- Kent County · 82,184 people
- Metro
- Dover, DE
- Population (ZIP)
- 37,763
- Household income
- $66,388
- Rent vs Own
- Severe rent burden
- 1320.0
Population outlook (Kent County) Hauer SSP2
- Today (2025)
- 194,477 people
- By 2030
- 204,351 · +5.1%
- By 2040
- 222,135 · +14.2%
- By 2050
- 236,483 · +21.6%
- By 2075
- 266,327 · +36.9%
- By 2100
- 275,335 · +41.6%
Race, ethnicity, and origin ACS 2023
- Neighborhood character
- Diverse neighborhood (Simpson 0.68)
- Race & ethnicity
- White 44% Black 34% Hispanic / Latino 13% Two or more races 11% Asian 2%
- Hispanic origin (detail)
- Mexican 3% Puerto Rican 6%
- Common ancestry
- Romanian 2% Hispanic 1% Lithuanian 1%
- Foreign-born
- 7% · Canada, South Korea
- Languages at home
- 88% English-only · Spanish 7% French/Haitian/Cajun 1% Other Asian/Pacific 1%
Political lean MEDSL · Kent
- 2024 margin
- Toss-up / Even · D 50.2% · R 48.2% · Other 1.7%
- 2008→2024 swing
- -7.8pp toward R · 2008: 9.8pp · 2024: 2.0pp
- All cycles
- 2024: D+2.0 2020: D+4.1 2016: R+4.9 2012: D+4.9 2008: D+9.8
Not yet ingested
- Civics
- —
Market trends
- HPI YoY
- ▼ -113.29%
- Current HPI
- 199.5132
- Rent YoY
- ▲ 2.03%
- Metro
- Dover, DE
- State GDP YoY
- —
- F500 in state
- 0
Price history
+220.6% since first listed18 events — show timeline
- 2026-05-13 Listed $160,000 BRIGHT MLS
- 2026-05-08 Coming Soon $160,000 BRIGHT MLS
- 2023-10-17 Listing Removed — BRIGHT MLS
- 2023-06-26 Listed $155,000 BRIGHT MLS
- 2017-12-29 Sold (Public Records) $45,000 Public Records
- 2017-12-21 Sold (MLS) $45,000 TREND
- 2017-12-21 Sold (MLS) $45,000 BRIGHT MLS
- 2017-11-22 Pending — TREND
- 2017-09-12 Price Changed $59,500 TREND
- 2017-06-24 Price Changed $62,500 TREND
- 2017-03-21 Listed $69,000 TREND
- 2017-03-21 Listed $59,500 BRIGHT MLS
- 2005-09-15 Sold (Public Records) $80,000 Public Records
- 2005-09-08 Sold (MLS) $80,000 BRIGHT MLS
- 2005-08-15 Listing Removed — BRIGHT MLS
- 2005-08-01 Listed $80,000 BRIGHT MLS
- 1998-02-03 Listing Removed — BRIGHT MLS
- 1996-08-15 Listed $49,900 BRIGHT MLS
Property tax history
+8.6%/yrLatest (2025): $1,459 · +4.7% YoY. Source: county tax records.
Cash-flow waterfall
monthlySold comps — $/sqft
last 12 mo · ≤1 miLoading sold comps…