 🏷️ Likely Rental
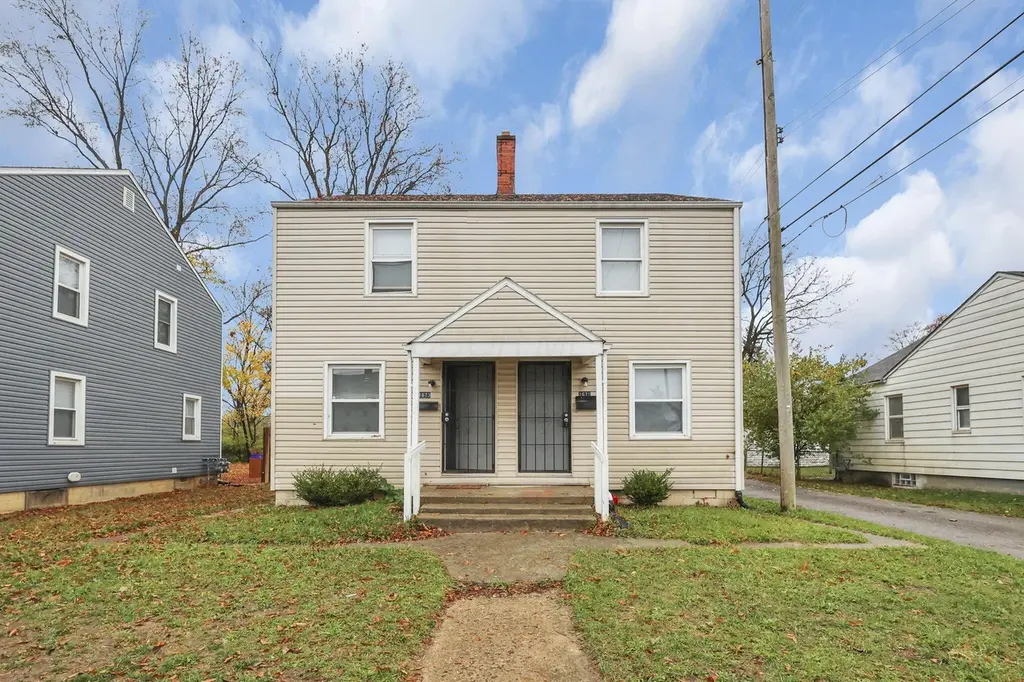
1671-1673 E Whittier St · Columbus, OH
Flood risk 1/10 · Minimal
- FEMA flood zone
- X (unshaded)
- Chance of flooding over 30 yrs
- 0.0%
- Est. flood insurance / yr
- $473 – $860
Fire risk 1/10 · Minimal
- Est. fire insurance / yr
- $713 – $1,323
Heat risk 4/10 · Minor
- Hot days now (above 100°F)
- 7 days/yr
- Hot days in 30 yrs
- 18 days/yr
Wind risk 2/10 · Minimal
- Chance of severe wind over 30 yrs
- 1.0%
Air-quality risk 3/10 · Minor
- Unhealthy air days now
- 2 days/yr
- Unhealthy air days in 30 yrs
- 3 days/yr
Risk factors via First Street. Map © Google.
Why this score? — see what drove the B- grade
The composite is a weighted blend of 9 inputs, each scored 0–100. Each bar is that input's sub-score; the figure is the points it added to the 100-point composite (weight × sub-score).
- Cash flow +27.0/30.0
- ARV discount +15.0/15.0
- DSCR +9.3/10.0
- 1% rule +6.8/10.0
- Livability +4.0/5.0
- Rent growth +3.4/5.0
- Condition / age +2.5/5.0
- Schools +1.7/10.0
- Appreciation +0.0/10.0
$214,000
🖨 Deal sheet 📄 Offer letter ✓ Due diligence
Multi-family units
County records classify this as Multi-Family (2-4 Unit). Listing-text estimate: 2 units. confirmed
Listing remarks MLS
This well-maintained, turn-key duplex in Driving Park sits just west of the desirable Bexley area and near Nationwide Hospital. Each unit features 2 bedrooms, 1 bathroom, and a spacious living area with beautiful hardwood floors throughout the main living spaces and bedrooms. Additional highlights include a large backyard and convenient off-street parking, making it an ideal choice for stable, long-term tenants. Both units are currently occupied and on a month-to-month lease for $900 per month. The tenants are responsible for all utilities. This property offers great cash flow potential. Inspection report is available upon request.
Key facts
- 5,662 sq ft lot
- Built 1942
- Listed 225 days
Neighborhood map
What this means for you Summary
Snapshot
- This is a 2 × 2-bed/1-bath units multifamily listed at $214k.
Deal economics
- At list price, monthly cash flow is $598 ($7k/yr) — positive. Per door: $299/mo.
- The deal already cash-flows at list — no discount required.
- Meets the 1% rule at list price ($3k rent vs $214k).
- Recommended offer: $188k (12.0% below list) — sets the bar for market timing.
- Cap rate 9.6% vs local median 3.8% in Columbus — top-decile yield for the area; either an underpriced asset or a hidden risk that comps aren't pricing in. Stress-test before assuming the spread holds.
Location & tenants
- Location reads 81/100 on livability (#97 in OH, #1,491 nationally) — a professional / high-income tenant draw. Strengths: commute A+, cost of living A+, housing A+; Watch: employment C-, crime F.
- Columbus City School District (urban): math 15% / reading 26% proficiency, ranked #626 of 656 in OH (top 95%) — low school quality limits family demand, transient renter base, plan for 1-2y turnover; 72% free/reduced lunch — lower-income household profile, screen leases tightly.
- Market conditions: Rents rising (+3.5%/yr); 193 active listings in the ZIP; 40 comparable units currently listed for rent nearby; rentals at typical pace (median 24d on market — plan ~3-4 weeks tenant-placement turnaround); 45% of comp listings sitting > 30 days — soft ceiling on asking rent; solid renter incomes; 8,139 units permitted in Franklin County in 2024 (5,940 in 5+ unit buildings).
- This rent runs 40% of the median local income ($76k/yr) — at the standard rent-burdened threshold; future hikes will face affordability resistance.
Forward outlook
- Local home prices are declining (-3.0%/yr); year-one equity from $1k of loan paydown is wiped out by about $6k of value loss. Plan a longer hold.
- Franklin County population projected at +34% by 2050 — long-run rental-demand tailwind backs the buy-and-hold thesis.
- At projected returns (-3.0% appreciation + 3.5% rent growth), your $60k cash investment doubles in ~9 years — after that, you're playing with house money.
Negotiation context
- It's been on market 225 days — a 12% lower offer ($188k) is reasonable based on typical stale-listing flexibility.
- 14 sale attempts since 25y ago with the ask held roughly flat each time — persistent listings suggest the price (not the market) is what's stuck; bring a comps-based counter.
Risks & watch-outs
- Watch-outs: built in 1942 — expect roof / HVAC / electrical / plumbing capex.
Questions for the listing agent
- It's been on market 225 days. Have you received any prior offers? Is the seller open to a 12% concession, seller financing, or rate buy-down credit?
- Can we see the unit-by-unit rent roll, current vacancy, and any below-market leases? What's the average tenancy length?
- What capital expenditures (roof, boiler, parking lot, exteriors) have been made in the last 5 years, and what's planned in the next 2?
- Built in 1942 — when were the roof, HVAC, electrical panel, plumbing, and water heater last replaced?
- Why hasn't it sold? Are there any deal-killer items the seller is aware of (foundation, flood, title, zoning, code violations)?
- Is there a deadline driving the sale (1031 exchange, divorce, estate, relocation)? That informs how much negotiation room exists.
- Crime grade is F in this area — have there been break-ins, vandalism, or insurance claims at this property in the last 3 years? What carrier currently insures it and at what premium?
- What's the average days-on-market for RENTAL listings here right now (not sales)? A rising rental-DOM trend means longer vacancies and softer asking-rent achievability than the comps imply.
- What's the recent tenant-quality profile in this submarket — average credit score on applications, eviction rate, late-payment / NSF rate, and stable-employment percentage? A property-management company in the area should have these aggregated.
- How much new apartment / multifamily construction is in the pipeline within 1–3 miles? Heavy new supply (>2% of stock underway) typically softens rents 12–24 months out; light construction supports rent growth.
Investment metrics
- 1% rule
- 1.18% ✓
- Cap rate
- 9.65%
- Cash-on-cash
- 11.98%
- DSCR
- 1.53
- GRM
- 7.1
CMA / ARV
- ARV (median comp)
- $269,258
- List price
- $214,000
- Delta
- -20.52%
- Verdict
- UNDERPRICED
- Comps
- 20 within 1.0 mi
Show comp detail 6 sales within ~0.75 mi
| Address | Dist | Beds/Ba | Sqft | Sold | Price | $/sf | Match |
|---|---|---|---|---|---|---|---|
| 1732-1734 E Whittier St | 0.09mi | 4/— | 1,568 (0%) | 1mo | $195,000 | $124 | 95 |
| 1701 E Whittier St #1703 | 0.04mi | 4/— | 1,624 (+4%) | 9mo | $245,000 | $151 | 84 |
| 1723-1725 E Whittier St | 0.08mi | 4/— | 1,624 (+4%) | 10mo | $193,315 | $119 | 82 |
| 1710-1712 E Whittier St | 0.06mi | 4/— | 1,624 (+4%) | 24mo | $300,000 | $185 | 72 |
| 736-738 Lilley Ave | 0.70mi | 4/— | 1,551 (-1%) | 6mo | $240,000 | $155 | 60 |
| 1437 Ellsworth Ave | 0.70mi | 4/— | 1,792 (+14%) | 3mo | $310,000 | $173 | 41 |
Match score weights: distance 35% · size 25% · config 20% · recency 20%. Top-matched comps best support the ARV.
Projected returns pro-forma
-3.0% appreciation · 3.51% rent growth · sell at horizon
- IRR
- 2.0%
- Equity multiple
- 1.08×
- Total profit
- $4,695
- Equity at exit
- $31,908
- IRR
- 12.1%
- Equity multiple
- 1.98×
- Total profit
- $58,468
- Equity at exit
- $18,503
Cash invested: $59,920 (down + closing). Projections, not guarantees.
Landlord ↔ Tenant lean methodology
- Overall (STATE)
- 73 Landlord-Friendly
- State Ohio
- 73 Landlord-Friendly · R+6
- County
- — inherits STATE
- City
- — inherits STATE
ZIP-level market 43206
- Rents YoY
- 3.5%
- Active inventory
- 193
- Price-to-rent
- 14.1×
Monthly cashflow live
- Estimated rent
- $2,523 high interval (Pro) →
- Mortgage (P&I)
- −$1,122
- Tax from tax record
- −$184 /mo · $2,206/yr
- Insurance
- −$89
- HOA
- −$0
- Vacancy / Maint / Mgmt
- −$530
- Net cashflow
- $598
Break-even live
2-unit breakdown (identical units grouped — click to expand)
| Units | Beds | Baths | Est. rent |
|---|---|---|---|
| 2× units | 2 | 1 | $2,522 |
| #1 | 2 | 1 | $1,261 |
| #2 | 2 | 1 | $1,261 |
| Total (2 units) | $2,523 | ||
UW: 25.0% down · 7.5% · 30yr · 1.5% tax · 5.0% vac · 8.0% maint · 8.0% mgmt
Financing live
Cash to close
- Down payment
- $53,500
- Closing costs
- $6,420
- Reserves months
- —
- Total cash needed
- —
Loan-product check · same deal, 3 products live
Conventional
25% down · 7.5% · 30yr
- Down + closing
- —
- Monthly P&I
- —
- Monthly cashflow
- —
- DSCR
- —
- Eligible?
- —
Personal DTI + credit; lowest rate.
DSCR
20% down · 8.5% · 30yr
- Down + closing
- —
- Monthly P&I
- —
- Monthly cashflow
- —
- DSCR
- —
- Eligible?
- —
No personal income docs; deal must DSCR.
Hard money
10% down · 12.0% · 12mo
- Down + closing
- —
- Monthly P&I
- —
- Monthly cashflow
- —
- DSCR
- —
- Eligible?
- —
Short-term bridge; refi at stabilization.
Rent comps 40 comps
| Address | Beds | Baths | Sqft | Rent | $/sqft | DOM | Units | Dist |
|---|---|---|---|---|---|---|---|---|
| 1050 Bulen Ave Columbus, OH | 3.0 | 2.0 | 1104 | $1,700 | $1.54 | 17d | 1 | 0.19mi |
| 910 Rhoads Ave Columbus, OH | 1.0–3.0 | 1.0–2.0 | 941 | $1,350 | $1.43 | 2d | 30 | 0.45mi |
| 864 Fairwood Ave Columbus, OH | 3.0 | 1.0 | 1176 | $1,300 | $1.11 | 44d | 1 | 0.45mi |
| 852-854 Fairwood Ave Columbus, OH | 3.0 | 1.0 | 1176 | $1,295 | $1.10 | 24d | 1 | 0.46mi |
| 852-854 Fairwood Ave Columbus, OH | 3.0 | 1.0 | 1176 | $1,295 | $1.10 | 15d | 1 | 0.46mi |
| 854 Fairwood Ave Columbus, OH | 3.0 | 1.0 | 1176 | $1,295 | $1.10 | 44d | 1 | 0.46mi |
| 1106 Ellsworth Ave Columbus, OH | 3.0 | 1.0 | 1150 | $1,495 | $1.30 | 8d | 1 | 0.48mi |
| 1026 Ellsworth Ave Columbus, OH | 3.0 | 1.0 | 1100 | $1,295 | $1.18 | 20d | 1 | 0.49mi |
| 908 Ellsworth Ave Columbus, OH | 3.0 | 1.0 | 1154 | $1,325 | $1.15 | 3d | 1 | 0.57mi |
| 1805 Kent St Columbus, OH | 4.0 | 1.5 | 1399 | $1,900 | $1.36 | 24d | 1 | 0.59mi |
| 773-775 Berkeley Rd Columbus, OH | 3.0 | 1.0 | 1280 | $1,400 | $1.09 | 21d | 1 | 0.61mi |
| 773-775 Berkeley Rd Columbus, OH | 3.0 | 1.0 | 1280 | $1,350 | $1.05 | 2d | 1 | 0.61mi |
| 736 Seymour Ave Columbus, OH | 3.0 | 1.0 | 1176 | $1,350 | $1.15 | 44d | 1 | 0.63mi |
| 1559 Frebis Ave Columbus, OH | 3.0 | 2.0 | 1744 | $2,100 | $1.20 | 44d | 1 | 0.64mi |
| 1165-1167 E Whittier St Columbus, OH | 3.0 | 1.5 | 1300 | $1,950 | $1.50 | 44d | 1 | 0.71mi |
| 1167 E Whittier St Columbus, OH | 3.0 | 1.5 | 1300 | $1,950 | $1.50 | 44d | 1 | 0.71mi |
| 904 Studer Ave Columbus, OH | 3.0 | 1.5 | 1364 | $1,780 | $1.30 | 24d | 1 | 0.73mi |
| 988 Linwood Ave Columbus, OH | 4.0 | 3.0 | 1800 | $2,750 | $1.53 | 17d | 1 | 0.76mi |
| 883 Studer Ave Columbus, OH | 4.0 | 2.5 | 2217 | $2,500 | $1.13 | 2d | 1 | 0.76mi |
| 932 Linwood Ave Columbus, OH | 4.0 | 1.5 | 1663 | $2,045 | $1.23 | 44d | 1 | 0.78mi |
| 1288 Linwood Ave Columbus, OH | 3.0 | 1.0 | 1344 | $1,900 | $1.41 | 44d | 1 | 0.80mi |
| 614-616 Lilley Ave Columbus, OH | 3.0 | 1.5 | 1232 | $1,700 | $1.38 | 44d | 1 | 0.82mi |
| 1776 Nason Ave Columbus, OH | 3.0 | 1.0 | 1300 | $1,500 | $1.15 | 3d | 1 | 0.87mi |
| 1776 Nason Ave Columbus, OH | 3.0 | 1.0 | 1300 | $1,500 | $1.15 | 8d | 1 | 0.87mi |
| 857 Wilson Ave #859 Columbus, OH | 3.0 | 2.5 | 1527 | $1,650 | $1.08 | 44d | 1 | 0.90mi |
| 558 Lilley Ave Columbus, OH | 3.0 | 1.0 | 1372 | $1,600 | $1.17 | 44d | 1 | 0.90mi |
| 815 Wilson Ave Columbus, OH | 3.0 | 1.5 | 1400 | $1,500 | $1.07 | 8d | 1 | 0.92mi |
| 813 Wilson Ave Unit 1 Columbus, OH | 3.0 | 1.5 | 1400 | $1,500 | $1.07 | 8d | 1 | 0.93mi |
| 997 Oakwood Ave Columbus, OH | 3.0 | 1.5 | 1260 | $1,800 | $1.43 | 12d | 1 | 0.94mi |
| 1683-1685 E Main St Columbus, OH | 3.0 | 2.0 | 1380 | $1,695 | $1.23 | 12d | 1 | 0.99mi |
| 730-732 Oakwood Ave Unit 732 Columbus, OH | 3.0 | 1.0 | 1232 | $1,425 | $1.16 | 44d | 1 | 1.02mi |
| 555 Kimball Pl Columbus, OH | 3.0 | 2.5 | 1252 | $1,785 | $1.43 | 44d | 1 | 1.03mi |
| 1227 S Champion Ave Unit 1227 Columbus, OH | 3.0 | 1.0 | 1110 | $1,195 | $1.08 | 3d | 1 | 1.04mi |
| 1225 S Champion Ave Unit 1225 Columbus, OH | 3.0 | 1.0 | 1110 | $1,095 | $0.99 | 3d | 1 | 1.04mi |
| 1239-1241 S Champion Ave Columbus, OH | 3.0 | 1.0 | 1134 | $1,275 | $1.12 | 16d | 1 | 1.04mi |
| 1118 S Ohio Ave Columbus, OH | 3.0 | 1.5 | 1232 | $1,750 | $1.42 | 44d | 1 | 1.05mi |
| 1833 Berkeley Rd Columbus, OH | 3.0 | 1.5 | 1092 | $1,800 | $1.65 | 44d | 1 | 1.07mi |
| 977 S Ohio Ave Columbus, OH | 3.0 | 2.5 | 1650 | $2,500 | $1.52 | 44d | 1 | 1.07mi |
| 814 S Ohio Ave Columbus, OH | 3.0 | 1.0 | 1380 | $1,600 | $1.16 | 44d | 1 | 1.09mi |
| 1686 Smith Rd Columbus, OH | 3.0 | 1.5 | 1200 | $1,400 | $1.17 | 44d | 1 | 1.09mi |
Listing history 50 events
-
2026-06-18days on market $214,000 Active 225 DOM
-
2026-06-17days on market $214,000 Active 224 DOM
-
2026-06-16days on market $214,000 Active 223 DOM
-
2026-06-15statusdays on market $214,000 Active 222 DOM
-
2026-06-13days on market $214,000 Contingent 220 DOM
-
2026-06-13days on market $214,000 Contingent 219 DOM
-
2026-06-09days on market $214,000 Contingent 216 DOM
-
2026-06-08statusdays on market $214,000 Contingent 215 DOM
-
2026-06-07days on market $214,000 Active 214 DOM
-
2026-06-05days on market $214,000 Active 211 DOM
-
2026-06-03days on market $214,000 Active 210 DOM
-
2026-06-02days on market $214,000 Active 209 DOM
-
2026-06-01days on market $214,000 Active 208 DOM
-
2026-05-31days on market $214,000 Active 207 DOM
-
2026-03-03status Active 639-char remark
Show marketing remark (639 chars)
This well-maintained, turn-key duplex in Driving Park sits just west of the desirable Bexley area and near Nationwide Hospital. Each unit features 2 bedrooms, 1 bathroom, and a spacious living area with beautiful hardwood floors throughout the main living spaces and bedrooms. Additional highlights include a large backyard and convenient off-street parking, making it an ideal choice for stable, long-term tenants. Both units are currently occupied and on a month-to-month lease for $900 per month. The tenants are responsible for all utilities. This property offers great cash flow potential. Inspection report is available upon request.
-
2026-02-25historical Contingent 639-char remark
Show marketing remark (639 chars)
This well-maintained, turn-key duplex in Driving Park sits just west of the desirable Bexley area and near Nationwide Hospital. Each unit features 2 bedrooms, 1 bathroom, and a spacious living area with beautiful hardwood floors throughout the main living spaces and bedrooms. Additional highlights include a large backyard and convenient off-street parking, making it an ideal choice for stable, long-term tenants. Both units are currently occupied and on a month-to-month lease for $900 per month. The tenants are responsible for all utilities. This property offers great cash flow potential. Inspection report is available upon request.
-
2025-12-08price $214,000 639-char remark
Show marketing remark (639 chars)
This well-maintained, turn-key duplex in Driving Park sits just west of the desirable Bexley area and near Nationwide Hospital. Each unit features 2 bedrooms, 1 bathroom, and a spacious living area with beautiful hardwood floors throughout the main living spaces and bedrooms. Additional highlights include a large backyard and convenient off-street parking, making it an ideal choice for stable, long-term tenants. Both units are currently occupied and on a month-to-month lease for $900 per month. The tenants are responsible for all utilities. This property offers great cash flow potential. Inspection report is available upon request.
-
2025-11-17status Active 639-char remark
Show marketing remark (639 chars)
This well-maintained, turn-key duplex in Driving Park sits just west of the desirable Bexley area and near Nationwide Hospital. Each unit features 2 bedrooms, 1 bathroom, and a spacious living area with beautiful hardwood floors throughout the main living spaces and bedrooms. Additional highlights include a large backyard and convenient off-street parking, making it an ideal choice for stable, long-term tenants. Both units are currently occupied and on a month-to-month lease for $900 per month. The tenants are responsible for all utilities. This property offers great cash flow potential. Inspection report is available upon request.
-
2025-11-05historical Contingent 639-char remark
Show marketing remark (639 chars)
This well-maintained, turn-key duplex in Driving Park sits just west of the desirable Bexley area and near Nationwide Hospital. Each unit features 2 bedrooms, 1 bathroom, and a spacious living area with beautiful hardwood floors throughout the main living spaces and bedrooms. Additional highlights include a large backyard and convenient off-street parking, making it an ideal choice for stable, long-term tenants. Both units are currently occupied and on a month-to-month lease for $900 per month. The tenants are responsible for all utilities. This property offers great cash flow potential. Inspection report is available upon request.
-
2025-11-05historical
Show marketing remark (639 chars)
This well-maintained, turn-key duplex in Driving Park sits just west of the desirable Bexley area and near Nationwide Hospital. Each unit features 2 bedrooms, 1 bathroom, and a spacious living area with beautiful hardwood floors throughout the main living spaces and bedrooms. Additional highlights include a large backyard and convenient off-street parking, making it an ideal choice for stable, long-term tenants. Both units are currently occupied and on a month-to-month lease for $900 per month. The tenants are responsible for all utilities. This property offers great cash flow potential. Inspection report is available upon request.
-
2025-10-30historical Contingent
-
2025-08-18price $220,000
-
2025-07-07$220,000 Active 639-char remark
Show marketing remark (639 chars)
This well-maintained, turn-key duplex in Driving Park sits just west of the desirable Bexley area and near Nationwide Hospital. Each unit features 2 bedrooms, 1 bathroom, and a spacious living area with beautiful hardwood floors throughout the main living spaces and bedrooms. Additional highlights include a large backyard and convenient off-street parking, making it an ideal choice for stable, long-term tenants. Both units are currently occupied and on a month-to-month lease for $900 per month. The tenants are responsible for all utilities. This property offers great cash flow potential. Inspection report is available upon request.
-
2025-05-27price $230,000
-
2025-02-04price $238,000
-
2025-01-17status Active
-
2025-01-13historical Contingent
-
2025-01-13status Active
-
2025-01-11historical Contingent
-
2025-01-06$240,000 Active
-
2023-09-28soldstatus $225,000
-
2020-01-09soldstatus $80,000
-
2020-01-06soldstatus $80,000 Closed
-
2019-12-21status Pending
-
2019-12-03$80,000 Active
-
2018-06-18historical
-
2018-06-18status Active
-
2018-06-12historical Contingent Finance and Inspection
-
2018-06-08$57,900 Active
-
2017-06-30historical
-
2017-06-30status Active
-
2017-06-26status Pending
-
2017-06-22$39,500 Active
-
2016-12-06$33,900 Active
-
2016-12-06historical
-
2016-12-01soldstatus $23,000
-
2016-11-28soldstatus $23,000 Closed
-
2016-11-17status Pending
-
2016-10-28$29,900 Active
-
2008-10-10soldstatus $18,000
ⓘ Source: listings_history table (triggers on properties + properties_extension) + one-shot
backfill from property_details.listing_events for pre-trigger history.
Tax reassessment forecast OH · Partial reset (capped growth)
- Current annual tax
- $2,206 · $184/mo
- Projected year-2 tax
- $2,772 · $231/mo
- Expected delta
- +$566/yr (+$47/mo · 25.7%)
ⓘ Screening estimate from a state-policy table — verify with the county assessor before closing.
Climate risk First Street
- Flood 1/10 Low FEMA zone X (unshaded) · 0% chance over 30 yrs
- Wildfire 1/10 Low
- Heat 4/10 Moderate 7 d/yr ≥100°F today · 18 d/yr by 30 yrs out
- Wind 2/10 Low 100% chance of damaging wind over 30 yrs
- Air quality 3/10 Moderate 2 unhealthy d/yr today · 3 by 30 yrs out
Nearby sold comps map
Loading sold comps map…
Walkable amenities ~0.75 mi
Loading nearby amenities…
Taxation est. · year 1
- Rental income
- $30,276
- − Mortgage interest
- −$11,987
- − Property taxes
- −$2,206
- − Insurance
- −$1,070
- − Repairs & maintenance
- −$2,422
- − Management
- −$2,422
- − Depreciation
- −$6,225
- Taxable income
- $3,943
- Est. tax owed @ 24.0%
- −$946
- After-tax cash flow
- $6,229/yr
For passive investors: Depreciation is non-cash, so a rental often shows a tax loss while cash-flowing — sheltering income. Rental losses are passive: they offset passive income freely, and up to $25,000/yr can offset ordinary (W-2) income if you actively participate and your MAGI is under $100k (phasing out to $0 by $150k); unused losses carry forward. On sale, claimed depreciation is recaptured at up to 25%, and gains may owe capital-gains tax (a 1031 exchange can defer both). Figures are a year-1 estimate at your 24.0% rate — not tax advice; consult a CPA.
Schools (NCES district)
- District
- Columbus City School District
- NCES district ID
- 3904380
- Math proficiency
- 15% ▼ -17.00%
- Reading proficiency
- 26% ▼ -12.00%
- Median HH income
- $38,483
- Composite
- 17.19/100
- National rank
- #9105
- State rank
- #626 of 656 in OH
Livability — Columbus
- Score
- 81/100
- State rank
- #97
- US rank
- #1491
Category grades
Schools grade is shown separately in the Schools card above.
Census & demographics
- Census place
- Columbus, OH
- County
- Franklin County · 1,351,780 people
- City population
- 612,189
- Metro
- Columbus, OH
- Population (ZIP)
- 21,996
- Household income
- $75,806
- Rent vs Own
- Severe rent burden
- 846.0
Population outlook (Franklin County) Hauer SSP2
- Today (2025)
- 1,456,139 people
- By 2030
- 1,556,890 · +6.9%
- By 2040
- 1,757,349 · +20.7%
- By 2050
- 1,950,539 · +34.0%
- By 2075
- 2,376,171 · +63.2%
- By 2100
- 2,636,796 · +81.1%
Race, ethnicity, and origin ACS 2023
- Neighborhood character
- Diverse neighborhood (Simpson 0.59)
- Race & ethnicity
- White 56% Black 31% Two or more races 9% Hispanic / Latino 4% Asian 1% Native American 1%
- Common ancestry
- Romanian 3% Slovak 2% Lithuanian 1%
- Foreign-born
- 4% · Canada
- Languages at home
- 96% English-only · Spanish 2% Other Indo-European 1%
Political lean MEDSL · Franklin
- 2024 margin
- Strong D (+28.4) · D 63.7% · R 35.3% · Other 1.0%
- 2008→2024 swing
- +7.7pp toward D · 2008: 20.7pp · 2024: 28.4pp
- All cycles
- 2024: D+28.4 2020: D+31.4 2016: D+25.9 2012: D+21.7 2008: D+20.7
Not yet ingested
- Civics
- —
Market trends
- HPI YoY
- ▼ -576.73%
- Current HPI
- 173.8569
- Rent YoY
- ▲ 3.51%
- Metro
- Columbus, OH
- State GDP YoY
- ▲ 1.98%
- F500 in state
- 48
Industry mix (Fortune 500 HQ in OH)
| Industry | F500 HQs | Revenue |
|---|---|---|
| Insurance | 3 | $145B |
|
||
| Industrial Machinery | 3 | $49B |
|
||
| Financial Services | 3 | $24B |
|
||
| Consumer Goods | 2 | $93B |
|
||
| Aerospace / Defense | 2 | $47B |
|
||
| Utilities | 2 | $33B |
|
||
Price history
+970.0% since first listed40 events — show timeline
- 2026-03-03 Relisted — CBRMLS
- 2026-02-25 Contingent — CBRMLS
- 2025-12-08 Price Changed $214,000 CBRMLS
- 2025-11-17 Relisted — CBRMLS
- 2025-11-05 Contingent — CBRMLS
- 2025-11-05 Listing Removed — CBRMLS
- 2025-10-30 Contingent — CBRMLS
- 2025-08-18 Price Changed $220,000 CBRMLS
- 2025-07-07 Listed $220,000 CBRMLS
- 2025-05-27 Price Changed $230,000 CBRMLS
- 2025-02-04 Price Changed $238,000 CBRMLS
- 2025-01-17 Relisted — CBRMLS
- 2025-01-13 Contingent — CBRMLS
- 2025-01-13 Relisted — CBRMLS
- 2025-01-11 Contingent — CBRMLS
- 2025-01-06 Listed $240,000 CBRMLS
- 2023-09-28 Sold (Public Records) $225,000 Public Records
- 2020-01-09 Sold (Public Records) $80,000 Public Records
- 2020-01-06 Sold (MLS) $80,000 CBRMLS
- 2019-12-21 Pending — CBRMLS
- 2019-12-03 Listed $80,000 CBRMLS
- 2018-06-18 Listing Removed — CBRMLS
- 2018-06-18 Relisted — CBRMLS
- 2018-06-12 Contingent — CBRMLS
- 2018-06-08 Listed $57,900 CBRMLS
- 2017-06-30 Listing Removed — CBRMLS
- 2017-06-30 Relisted — CBRMLS
- 2017-06-26 Pending — CBRMLS
- 2017-06-22 Listed $39,500 CBRMLS
- 2016-12-06 Listed $33,900 CBRMLS
- 2016-12-06 Listing Removed — CBRMLS
- 2016-12-01 Sold (Public Records) $23,000 Public Records
- 2016-11-28 Sold (MLS) $23,000 CBRMLS
- 2016-11-17 Pending — CBRMLS
- 2016-10-28 Listed $29,900 CBRMLS
- 2008-10-10 Sold (Public Records) $18,000 Public Records
- 2004-05-12 Sold (Public Records) $62,500 Public Records
- 2002-05-14 Listing Removed — CBRMLS
- 2001-07-30 Listed $49,900 CBRMLS
- 1997-09-15 Sold (Public Records) $20,000 Public Records
Property tax history
+7.9%/yrLatest (2024): $2,206 · +1.3% YoY. Source: county tax records.
Cash-flow waterfall
monthlySold comps — $/sqft
last 12 mo · ≤1 miLoading sold comps…