31 Briarwood Ln · Rosenhayn, NJ
Flood risk No data
- FEMA flood zone
- —
- Chance of flooding over 30 yrs
- —
- Est. flood insurance / yr
- —
Fire risk No data
- Est. fire insurance / yr
- —
Heat risk No data
- Hot days now (above threshold)
- —
- Hot days in 30 yrs
- —
Wind risk No data
- Chance of severe wind over 30 yrs
- —
Air-quality risk No data
- Unhealthy air days now
- —
- Unhealthy air days in 30 yrs
- —
Risk factors via First Street. Map © Google.
Why this score? — see what drove the D+ grade
The composite is a weighted blend of 9 inputs, each scored 0–100. Each bar is that input's sub-score; the figure is the points it added to the 100-point composite (weight × sub-score).
- Cash flow +22.5/30.0
- DSCR +7.2/10.0
- 1% rule +5.9/10.0
- Livability +3.2/5.0
- Schools +3.1/10.0
- Rent growth +2.5/5.0
- Condition / age +2.5/5.0
- ARV discount +0.0/15.0
- Appreciation +0.0/10.0
$124,900
🖨 Deal sheet 📄 Offer letter ✓ Due diligence
Listing remarks
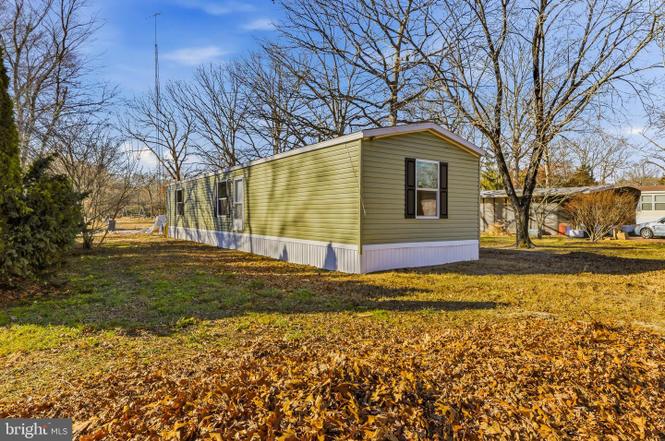
Brand-new construction home available now in Holly Tree Acres — move in immediately! This spacious 3-bedroom, 2-bath offers a modern open layout designed for comfortable everyday living. The private primary suite is set apart from the additional bedrooms and features its own full bathroom and closet for added privacy. The bright kitchen includes a stainless steel appliance package (with dishwasher) and flows seamlessly into a large living area, creating an open and welcoming space. This home includes a 1-year builder warranty for peace of mind and low-maintenance living from day one. Estimated purchase terms starting around $6,245 down and approx. $1,080/month (subject to credit appro
Key facts
- Private master suite
- Open layout
- Large living room
Tags
Property features AI
Finance
- Other: Property condition listed as excellent
- Financial info: Property is land lease / ground rent; Annual ground rent listed in income/expense notes
- HOA & community: Land lease of $865 per month; Ground rent exists (1 year remaining)
Exterior
- Parking: Driveway parking for 2 vehicles; Total 2 garage/parking spaces
- Utilities: Electric hot water; Natural gas heating fuel; Electric cooling; Community water; Community septic tank
- Home design: Manufactured single-wide home; Modular/manufactured construction; Shingle roof; Construction completed
- Construction: 16 ft. width (single wide)
- Exterior features: Located in Holly Tree Acres park; Community water; Community septic tank
Interior
- Kitchen: Kitchen open to dining area
- Bedrooms: 3 bedrooms on the main level
- Bathrooms: 2 full bathrooms (main level)
- Heating & cooling: Forced air heating (natural gas); Electric cooling
- Interior features: Walk-in shower; Tub with shower; Combination kitchen and dining area
- Laundry & utility: Main floor laundry with hookups
Neighborhood map
What this means for you Summary
Snapshot
- This is a 3-bed/2.0-bath single-family listed at $125k.
Deal economics
- At list price, monthly cash flow is $209 ($3k/yr) — positive.
- The deal already cash-flows at list — no discount required.
- Meets the 1% rule at list price ($1k rent vs $125k).
- Recommended offer: $110k (12.0% below list) — sets the bar for market timing.
Location & tenants
- Location reads 64/100 on livability (#401 in NJ) — a middle-class / working-renter tenant base. Strengths: crime A+, housing A+, employment A-; Watch: cost of living C-, schools F, amenities F.
- Pittsgrove Township School District (rural): math 18% / reading 48% proficiency, ranked #295 of 472 in NJ (top 62%) — families likely to look elsewhere, expect single-tenant / working-renter base with shorter leases.
- Market conditions: 79 active listings in the ZIP; 95 units permitted in Salem County in 2024 (0 in 5+ unit buildings).
Forward outlook
- Local home prices are declining (-3.0%/yr); year-one equity from $864 of loan paydown is wiped out by about $4k of value loss. Plan a longer hold.
- Salem County population projected at -23% by 2050 — secular population decline; favor cash flow + early exit over multi-decade hold.
Negotiation context
- It's been on market 144 days — a 12% lower offer ($110k) is reasonable based on typical stale-listing flexibility.
- 3 sale attempts; this cycle's ask has dropped $14k (10%) from the opening price — seller is motivated, your offer sets the floor, not the list.
Questions for the listing agent
- It's been on market 144 days. Have you received any prior offers? Is the seller open to a 12% concession, seller financing, or rate buy-down credit?
- Why hasn't it sold? Are there any deal-killer items the seller is aware of (foundation, flood, title, zoning, code violations)?
- Is there a deadline driving the sale (1031 exchange, divorce, estate, relocation)? That informs how much negotiation room exists.
- Schools are F-rated, which usually means shorter tenancies and higher turnover. Who's the typical renter profile here, and what's been the actual vacancy rate?
- The area grade is low — what's the realistic commute time and amenity access for the typical tenant pool here? Any planned neighborhood developments (good or bad) we should know about?
- What's the average days-on-market for RENTAL listings here right now (not sales)? A rising rental-DOM trend means longer vacancies and softer asking-rent achievability than the comps imply.
- What's the recent tenant-quality profile in this submarket — average credit score on applications, eviction rate, late-payment / NSF rate, and stable-employment percentage? A property-management company in the area should have these aggregated.
- How much new for-sale + rental construction is in the pipeline within 1–3 miles? Heavy new supply typically softens prices + rents 12–24 months out; constrained supply supports both.
Investment metrics
- 1% rule
- 1.09% ✓
- Cap rate
- 8.30%
- Cash-on-cash
- 7.18%
- DSCR
- 1.32
- GRM
- 7.7
CMA / ARV
- ARV (on-the-fly)
- $83,424
- Comps found
- 6
Show comp detail 6 sales within ~0.75 mi
| Address | Dist | Beds/Ba | Sqft | Sold | Price | $/sf | Match |
|---|---|---|---|---|---|---|---|
| 29 Applewood Ln | 0.08mi | 3/2.0 | 1,056 (0%) | 2mo | $123,500 | $117 | 95 |
| 119 Middle Dr Unit 23 DOGWOOD LANE | 0.17mi | 3/2.0 | 1,200 (+14%) | 5mo | $115,000 | $96 | 65 |
| 28 Dogwood Ln | 0.08mi | 3/1.0 | 980 (-7%) | 20mo | $65,000 | $66 | 64 |
| 5 Briarwood Ln | 0.15mi | 4/1.5 (+1) | 1,192 (+13%) | 2mo | $66,500 | $56 | 63 |
| 34 Briarwood Ln | 0.03mi | 2/1.0 (-1) | 900 (-15%) | 5mo | $71,500 | $79 | 61 |
| 21 Briarwood Ln | 0.05mi | 2/1.0 (-1) | 980 (-7%) | 22mo | $75,000 | $77 | 58 |
Match score weights: distance 35% · size 25% · config 20% · recency 20%. Top-matched comps best support the ARV.
Projected returns pro-forma
-3.0% appreciation · 3.0% rent growth · sell at horizon
- IRR
- -5.3%
- Equity multiple
- 0.80×
- Total profit
- $-6,884
- Equity at exit
- $18,623
- IRR
- 4.4%
- Equity multiple
- 1.32×
- Total profit
- $11,260
- Equity at exit
- $10,799
Cash invested: $34,972 (down + closing). Projections, not guarantees.
Landlord ↔ Tenant lean methodology
- Overall (STATE)
- 21 Tenant-Leaning
- State New Jersey
- 21 Tenant-Leaning · D+6
- County
- — inherits STATE
- City
- — inherits STATE
ZIP-level market 08318
- Home prices YoY
- -16.6%
- Active inventory
- 79
- Price-to-rent
- 7.7×
Monthly cashflow live
- Estimated rent
- $1,358 medium interval (Pro) →
- Mortgage (P&I)
- −$655
- Tax est. 1.5%
- −$156 /mo · $1,874/yr
- Insurance
- −$52
- HOA
- −$0
- Vacancy / Maint / Mgmt
- −$285
- Net cashflow
- $209
Break-even live
UW: 25.0% down · 7.5% · 30yr · 1.5% tax · 5.0% vac · 8.0% maint · 8.0% mgmt
Financing live
Cash to close
- Down payment
- $31,225
- Closing costs
- $3,747
- Reserves months
- —
- Total cash needed
- —
Loan-product check · same deal, 3 products live
Conventional
25% down · 7.5% · 30yr
- Down + closing
- —
- Monthly P&I
- —
- Monthly cashflow
- —
- DSCR
- —
- Eligible?
- —
Personal DTI + credit; lowest rate.
DSCR
20% down · 8.5% · 30yr
- Down + closing
- —
- Monthly P&I
- —
- Monthly cashflow
- —
- DSCR
- —
- Eligible?
- —
No personal income docs; deal must DSCR.
Hard money
10% down · 12.0% · 12mo
- Down + closing
- —
- Monthly P&I
- —
- Monthly cashflow
- —
- DSCR
- —
- Eligible?
- —
Short-term bridge; refi at stabilization.
Listing history 23 events
-
2026-06-19days on market $124,900 Active 144 DOM
-
2026-06-18days on market $124,900 Active 143 DOM
-
2026-06-17days on market $124,900 Active 142 DOM
-
2026-06-16days on market $124,900 Active 141 DOM
-
2026-06-15days on market $124,900 Active 140 DOM
-
2026-06-14days on market $124,900 Active 138 DOM
-
2026-06-13days on market $124,900 Active 137 DOM
-
2026-06-10days on market $124,900 Active 135 DOM
-
2026-06-09days on market $124,900 Active 134 DOM
-
2026-06-08days on market $124,900 Active 133 DOM
-
2026-06-07days on market $124,900 Active 132 DOM
-
2026-06-05days on market $124,900 Active 129 DOM
-
2026-06-02days on market $124,900 Active 127 DOM
-
2026-06-01days on market $124,900 Active 126 DOM
-
2026-05-31days on market $124,900 Active 125 DOM
-
2026-05-30days on market $124,900 Active 124 DOM
-
2026-04-14status Active
-
2026-03-31historical
-
2026-03-25price $124,900
-
2026-03-10status Active
-
2026-03-08historical
-
2026-02-22price $134,900
-
2026-01-10$139,000 Active
ⓘ Source: listings_history table (triggers on properties + properties_extension) + one-shot
backfill from property_details.listing_events for pre-trigger history.
Nearby sold comps map
Loading sold comps map…
Walkable amenities ~0.75 mi
Loading nearby amenities…
Taxation est. · year 1
- Rental income
- $16,292
- − Mortgage interest
- −$6,996
- − Property taxes
- −$1,874
- − Insurance
- −$624
- − Repairs & maintenance
- −$1,303
- − Management
- −$1,303
- − Depreciation
- −$3,633
- Taxable income
- $557
- Est. tax owed @ 24.0%
- −$134
- After-tax cash flow
- $2,379/yr
For passive investors: Depreciation is non-cash, so a rental often shows a tax loss while cash-flowing — sheltering income. Rental losses are passive: they offset passive income freely, and up to $25,000/yr can offset ordinary (W-2) income if you actively participate and your MAGI is under $100k (phasing out to $0 by $150k); unused losses carry forward. On sale, claimed depreciation is recaptured at up to 25%, and gains may owe capital-gains tax (a 1031 exchange can defer both). Figures are a year-1 estimate at your 24.0% rate — not tax advice; consult a CPA.
Schools (NCES district)
- District
- Pittsgrove Township School District
- NCES district ID
- 3413110
- Math proficiency
- 18% ▼ -22.00%
- Reading proficiency
- 48% ▼ -8.00%
- Median HH income
- $71,126
- Composite
- 30.59/100
- National rank
- #6201
- State rank
- #295 of 472 in NJ
Livability — Rosenhayn
- Score
- 64/100
- State rank
- #401
- US rank
- #13944
Category grades
Schools grade is shown separately in the Schools card above.
Census & demographics
- City population
- 224
- Population (ZIP)
- 12,149
Population outlook (Salem County) Hauer SSP2
- Today (2025)
- 59,905 people
- By 2030
- 57,351 · -4.3%
- By 2040
- 51,837 · -13.5%
- By 2050
- 46,356 · -22.6%
- By 2075
- 36,452 · -39.2%
- By 2100
- 28,907 · -51.7%
Race, ethnicity, and origin ACS 2023
- Neighborhood character
- Predominantly White (79%)
- Race & ethnicity
- White 79% Hispanic / Latino 9% Black 7% Two or more races 7%
- Hispanic origin (detail)
- Mexican 2% Puerto Rican 6%
- Common ancestry
- Lithuanian 3% Romanian 3% Serbian 1%
- Foreign-born
- 1%
- Languages at home
- 93% English-only · Spanish 5%
Political lean MEDSL · Salem
- 2024 margin
- R (+19.2) · D 39.6% · R 58.8% · Other 1.6%
- 2008→2024 swing
- -23.1pp toward R · 2008: 3.9pp · 2024: -19.2pp
- All cycles
- 2024: R+19.2 2020: R+12.8 2016: R+15.4 2012: D+0.8 2008: D+3.9
Not yet ingested
- Civics
- —
Market trends
- HPI YoY
- ▼ -56.68%
- Current HPI
- 284.9025
- Rent YoY
- —
- Metro
- —
- State GDP YoY
- ▲ 2.05%
- F500 in state
- 34
Industry mix (Fortune 500 HQ in NJ)
| Industry | F500 HQs | Revenue |
|---|---|---|
| Consumer Goods | 3 | $31B |
|
||
| Pharmaceuticals | 2 | $153B |
|
||
| Technology | 2 | $21B |
|
||
| Insurance | 2 | $20B |
|
||
| Healthcare | 2 | $19B |
|
||
| Financial Services | 1 | $70B |
|
||
Price history
-10.1% since first listed7 events — show timeline
- 2026-04-14 Relisted — BRIGHT MLS
- 2026-03-31 Listing Removed — BRIGHT MLS
- 2026-03-25 Price Changed $124,900 BRIGHT MLS
- 2026-03-10 Relisted — BRIGHT MLS
- 2026-03-08 Listing Removed — BRIGHT MLS
- 2026-02-22 Price Changed $134,900 BRIGHT MLS
- 2026-01-10 Listed $139,000 BRIGHT MLS
Cash-flow waterfall
monthlySold comps — $/sqft
last 12 mo · ≤1 miLoading sold comps…