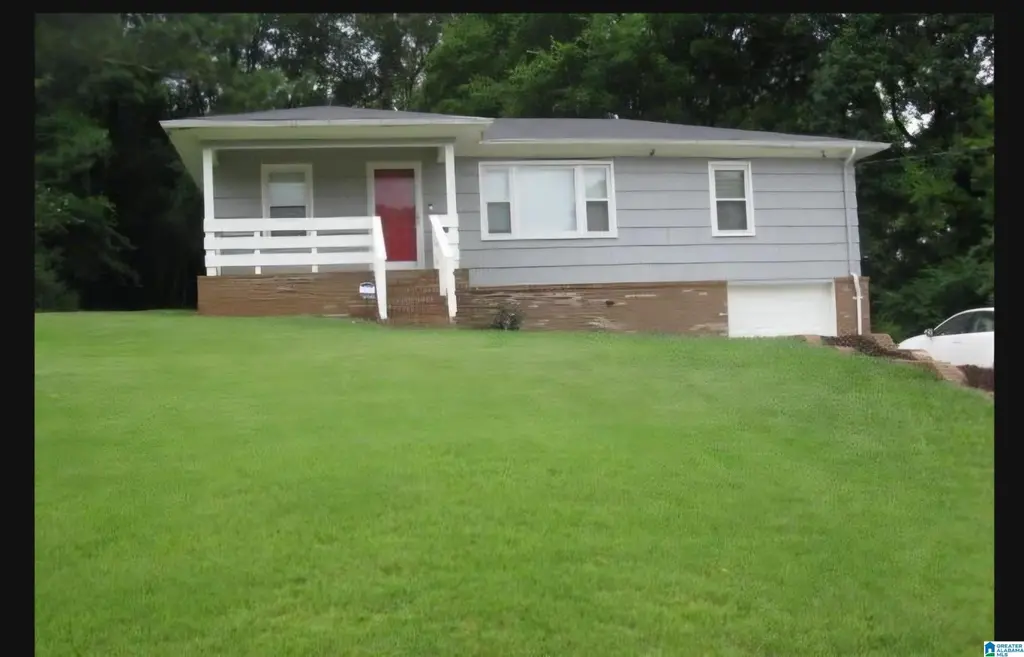
2232 5th St NE · Center Point, AL
Flood risk 1/10 · Minimal
- FEMA flood zone
- X (unshaded)
- Chance of flooding over 30 yrs
- 0.0%
- Est. flood insurance / yr
- $473 – $860
Fire risk 3/10 · Minor
- Est. fire insurance / yr
- $916 – $1,700
Heat risk 5/10 · Moderate
- Hot days now (above 105°F)
- 7 days/yr
- Hot days in 30 yrs
- 17 days/yr
Wind risk 6/10 · Moderate
- Chance of severe wind over 30 yrs
- 27.0%
Air-quality risk 5/10 · Moderate
- Unhealthy air days now
- 7 days/yr
- Unhealthy air days in 30 yrs
- 9 days/yr
Risk factors via First Street. Map © Google.
Why this score? — see what drove the B- grade
The composite is a weighted blend of 9 inputs, each scored 0–100. Each bar is that input's sub-score; the figure is the points it added to the 100-point composite (weight × sub-score).
- Cash flow +25.9/30.0
- ARV discount +15.0/15.0
- DSCR +8.7/10.0
- 1% rule +5.7/10.0
- Rent growth +3.3/5.0
- Livability +3.2/5.0
- Condition / age +2.5/5.0
- Schools +1.8/10.0
- Appreciation +0.0/10.0
$119,000
🖨 Deal sheet 📄 Offer letter ✓ Due diligence
Listing remarks MLS
This home is perfect for someone looking to downsize or an investor ready for their next opportunity. This 3-bedroom, 1-bathroom home offers a spacious living room, dining room, generous bedrooms, sizable kitchen, covered deck, and a large backyard. Whether you’re simplifying life or looking to expand your investment portfolio this home has the space, updates, and location to make it a win.
Key facts
- Sizable kitchen
- Covered deck
- Large backyard
Tags
Neighborhood map
What this means for you Summary
Snapshot
- This is a 3-bed/1.0-bath single-family listed at $119k.
Deal economics
- At list price, monthly cash flow is $292 ($4k/yr) — positive.
- The deal already cash-flows at list — no discount required.
- Meets the 1% rule at list price ($1k rent vs $119k).
- Recommended offer: $105k (12.0% below list) — sets the bar for market timing.
- Cap rate 9.2% vs local median 7.3% in Center Point — meaningfully above typical; check what's discounted (condition, days-on-market, listing class) to confirm the premium yield is real.
Location & tenants
- Location reads 63/100 on livability (#193 in AL) — a middle-class / working-renter tenant base. Strengths: cost of living A+, commute A, housing A; Watch: crime D, schools F, amenities F.
- Jefferson County (suburban): math 9% / reading 32% proficiency, ranked #104 of 129 in AL (top 81%) — low school quality limits family demand, transient renter base, plan for 1-2y turnover.
- Market conditions: Rents rising (+3.0%/yr); 334 active listings in the ZIP; 40 comparable units currently listed for rent nearby; rentals at typical pace (median 24d on market — plan ~3-4 weeks tenant-placement turnaround); 45% of comp listings sitting > 30 days — soft ceiling on asking rent; 2,114 units permitted in Jefferson County in 2024 (556 in 5+ unit buildings).
Forward outlook
- Local home prices are declining (-3.0%/yr); year-one equity from $823 of loan paydown is wiped out by about $4k of value loss. Plan a longer hold.
- Jefferson County population projected to shrink 4% by 2050 — rents likely to lag national; underwrite the cash flow, not the appreciation.
Negotiation context
- It's been on market 190 days — a 12% lower offer ($105k) is reasonable based on typical stale-listing flexibility.
- 3 sale attempts since 11y ago with the ask held roughly flat each time — persistent listings suggest the price (not the market) is what's stuck; bring a comps-based counter.
- Current owner paid $72k; list at $119k implies a 66% gain — meaningful room to come down on a strong offer.
Risks & watch-outs
- Watch-outs: built in 1957 — expect roof / HVAC / electrical / plumbing capex.
- Climate carrying-cost: major wind risk, 27% chance of damaging wind over 30y; extreme-heat days projected 7→17/yr by 2055 (HVAC capex compounding) — expect insurance premiums to compound above CPI over the hold.
Questions for the listing agent
- It's been on market 190 days. Have you received any prior offers? Is the seller open to a 12% concession, seller financing, or rate buy-down credit?
- Built in 1957 — when were the roof, HVAC, electrical panel, plumbing, and water heater last replaced?
- Why hasn't it sold? Are there any deal-killer items the seller is aware of (foundation, flood, title, zoning, code violations)?
- Is there a deadline driving the sale (1031 exchange, divorce, estate, relocation)? That informs how much negotiation room exists.
- Schools are F-rated, which usually means shorter tenancies and higher turnover. Who's the typical renter profile here, and what's been the actual vacancy rate?
- Crime grade is D in this area — have there been break-ins, vandalism, or insurance claims at this property in the last 3 years? What carrier currently insures it and at what premium?
- What's the average days-on-market for RENTAL listings here right now (not sales)? A rising rental-DOM trend means longer vacancies and softer asking-rent achievability than the comps imply.
- What's the recent tenant-quality profile in this submarket — average credit score on applications, eviction rate, late-payment / NSF rate, and stable-employment percentage? A property-management company in the area should have these aggregated.
- How much new for-sale + rental construction is in the pipeline within 1–3 miles? Heavy new supply typically softens prices + rents 12–24 months out; constrained supply supports both.
Investment metrics
- 1% rule
- 1.07% ✓
- Cap rate
- 9.24%
- Cash-on-cash
- 10.53%
- DSCR
- 1.47
- GRM
- 7.8
CMA / ARV
- ARV (median comp)
- $156,525
- List price
- $119,000
- Delta
- -23.97%
- Verdict
- UNDERPRICED
- Comps
- 20 within 1.0 mi
Show comp detail 12 sales within ~0.75 mi
| Address | Dist | Beds/Ba | Sqft | Sold | Price | $/sf | Match |
|---|---|---|---|---|---|---|---|
| 509 20th Ave NE | 0.34mi | 3/1.5 | 1,008 (-4%) | 7mo | $95,000 | $94 | 69 |
| 601 23rd Ave NE | 0.26mi | 3/1.0 | 1,186 (+13%) | 1mo | $79,500 | $67 | 66 |
| 405 20th Ct NE | 0.27mi | 3/1.5 | 1,112 (+6%) | 13mo | $102,615 | $92 | 65 |
| 2245 3rd St NE | 0.40mi | 3/1.0 | 1,150 (+10%) | 5mo | $88,000 | $77 | 62 |
| 2232 7th St NE | 0.18mi | 3/1.0 | 1,199 (+14%) | 15mo | $133,900 | $112 | 55 |
| 2352 3rd Way NE | 0.45mi | 3/1.5 | 1,167 (+11%) | 4mo | $103,000 | $88 | 55 |
| 408 Woodland Ct NE | 0.15mi | 3/2.0 | 1,193 (+14%) | 14mo | $108,000 | $91 | 55 |
| 2537 3rd St NE | 0.71mi | 3/1.0 | 1,040 (-1%) | 13mo | $85,000 | $82 | 54 |
| 2261 4th Place Cir | 0.10mi | 3/2.0 | 1,200 (+14%) | 18mo | $122,000 | $102 | 53 |
| 404 Woodland Ct NE | 0.16mi | 3/2.0 | 1,200 (+14%) | 16mo | $210,000 | $175 | 52 |
| 2617 NE 6th St | 0.71mi | 3/2.0 | 1,172 (+12%) | 3mo | $180,000 | $154 | 41 |
| 2701 8th St NE | 0.66mi | 3/1.0 | 1,170 (+11%) | 18mo | $100,000 | $85 | 36 |
Match score weights: distance 35% · size 25% · config 20% · recency 20%. Top-matched comps best support the ARV.
Projected returns pro-forma
-3.0% appreciation · 3.04% rent growth · sell at horizon
- IRR
- -0.5%
- Equity multiple
- 0.98×
- Total profit
- $-652
- Equity at exit
- $17,743
- IRR
- 9.2%
- Equity multiple
- 1.70×
- Total profit
- $23,436
- Equity at exit
- $10,289
Cash invested: $33,320 (down + closing). Projections, not guarantees.
Landlord ↔ Tenant lean methodology
- Overall (STATE)
- 90 Strongly Landlord-Friendly
- State Alabama
- 90 Strongly Landlord-Friendly · R+15
- County
- — inherits STATE
- City
- — inherits STATE
ZIP-level market 35215
- Home prices YoY
- -34.4%
- Rents YoY
- 3.0%
- Active inventory
- 334
- Price-to-rent
- 7.8×
Monthly cashflow live
- Estimated rent
- $1,273 high interval (Pro) →
- Mortgage (P&I)
- −$624
- Tax from tax record
- −$40 /mo · $478/yr
- Insurance
- −$50
- HOA
- −$0
- Vacancy / Maint / Mgmt
- −$267
- Net cashflow
- $292
Break-even live
UW: 25.0% down · 7.5% · 30yr · 1.5% tax · 5.0% vac · 8.0% maint · 8.0% mgmt
Financing live
Cash to close
- Down payment
- $29,750
- Closing costs
- $3,570
- Reserves months
- —
- Total cash needed
- —
Loan-product check · same deal, 3 products live
Conventional
25% down · 7.5% · 30yr
- Down + closing
- —
- Monthly P&I
- —
- Monthly cashflow
- —
- DSCR
- —
- Eligible?
- —
Personal DTI + credit; lowest rate.
DSCR
20% down · 8.5% · 30yr
- Down + closing
- —
- Monthly P&I
- —
- Monthly cashflow
- —
- DSCR
- —
- Eligible?
- —
No personal income docs; deal must DSCR.
Hard money
10% down · 12.0% · 12mo
- Down + closing
- —
- Monthly P&I
- —
- Monthly cashflow
- —
- DSCR
- —
- Eligible?
- —
Short-term bridge; refi at stabilization.
Rent comps 40 comps
| Address | Beds | Baths | Sqft | Rent | $/sqft | DOM | Units | Dist |
|---|---|---|---|---|---|---|---|---|
| 2249 4th Place Cir NE Center Point, AL | 3.0 | 1.5 | 1400 | $1,400 | $1.00 | 43d | 1 | 0.06mi |
| 332 23rd Ave NE Center Point, AL | 3.0 | 1.0 | 1100 | $1,350 | $1.23 | 2d | 1 | 0.25mi |
| 401 22nd Ave NE Center Point, AL | 2.0 | 1.5 | 850 | $745 | $0.88 | 15d | 1 | 0.33mi |
| 2109 Whetstone Ct Center Point, AL | 2.0 | 1.5 | 800 | $675 | $0.84 | 2d | 1 | 0.33mi |
| 509 20th Ave NE Center Point, AL | 3.0 | 1.5 | 1008 | $1,200 | $1.19 | 23d | 1 | 0.36mi |
| 2245 3rd St NE Center Point, AL | 3.0 | 1.0 | 1150 | $1,100 | $0.96 | 23d | 1 | 0.41mi |
| 2229 3rd St NE Center Point, AL | 3.0 | 1.0 | 1215 | $1,125 | $0.93 | 23d | 1 | 0.41mi |
| 856 Parkbrook Trl Birmingham, AL | 1.0–3.0 | 1.0–2.0 | 925 | $1,180 | $1.28 | 1d | 10 | 0.44mi |
| 2324 3rd St NE Center Point, AL | 3.0 | 2.0 | 1329 | $1,300 | $0.98 | 23d | 1 | 0.47mi |
| 2708 7th St NE Center Point, AL | 3.0 | 1.0 | 1451 | $1,150 | $0.79 | 43d | 1 | 0.62mi |
| 124 21st Ave NE Unit 202 Center Point, AL | 2.0 | 1.0 | 830 | $750 | $0.90 | 15d | 1 | 0.65mi |
| 123 21st Ave NE Center Point, AL | 2.0 | 1.0 | 850 | $800 | $0.94 | 43d | 1 | 0.68mi |
| 2537 3rd St NE Center Point, AL | 3.0 | 2.0 | 1040 | $1,350 | $1.30 | 23d | 1 | 0.69mi |
| 2415 Ormond Dr Center Point, AL | 3.0 | 1.5 | 1194 | $1,295 | $1.08 | 43d | 1 | 0.71mi |
| 1935 Springlake Ct Unit 1 Birmingham, AL | 2.0 | 1.5 | 1152 | $1,095 | $0.95 | 43d | 1 | 0.77mi |
| 1845 Stonehenge Dr Birmingham, AL | 3.0 | 2.0 | 1358 | $1,323 | $0.97 | 14d | 1 | 0.80mi |
| 2629 Wood Dr NE Center Point, AL | 3.0 | 1.0 | 1203 | $1,250 | $1.04 | 43d | 1 | 0.81mi |
| 2318 Raintree Ct Center Point, AL | 2.0 | 1.0 | 975 | $1,100 | $1.13 | 2d | 2 | 0.89mi |
| 109 24th Ave NW Center Point, AL | 3.0 | 1.5 | 1023 | $1,215 | $1.19 | 43d | 1 | 0.92mi |
| 1814 Valley Run Cir Birmingham, AL | 3.0 | 1.0 | 1025 | $1,350 | $1.32 | 43d | 1 | 1.00mi |
| 1720 2nd St NE Center Point, AL | 3.0 | 2.0 | 1100 | $1,400 | $1.27 | 43d | 1 | 1.03mi |
| 107 Sterling Ct NW Center Point, AL | 2.0 | 1.5–2.0 | 1026 | $1,062 | $1.04 | 2d | 4 | 1.05mi |
| 127 Fox Hill Ct Center Point, AL | 3.0 | 2.0 | 1418 | $1,545 | $1.09 | 43d | 1 | 1.09mi |
| 1817 Lyle Dr Birmingham, AL | 4.0 | 2.0 | 1361 | $1,605 | $1.18 | 23d | 1 | 1.10mi |
| 113 19th Ave NW Center Point, AL | 3.0 | 2.0 | 1407 | $1,250 | $0.89 | 11d | 1 | 1.12mi |
| 1905 2nd St NW Center Point, AL | 3.0 | 1.0 | 1258 | $1,395 | $1.11 | 43d | 1 | 1.14mi |
| 3309 Chase Ln Unit 3309 Birmingham, AL | 2.0 | 2.0 | 1068 | $1,000 | $0.94 | 43d | 1 | 1.17mi |
| 2245 3rd St NW Center Point, AL | 3.0 | 1.0 | 1156 | $1,100 | $0.95 | 23d | 1 | 1.18mi |
| 319 23rd Ave NW Center Point, AL | 3.0 | 2.0 | 1284 | $1,395 | $1.09 | 43d | 1 | 1.25mi |
| 2025 Brewster Rd Birmingham, AL | 3.0 | 2.0 | 1369 | $1,450 | $1.06 | 23d | 1 | 1.26mi |
| 1628 1st St NE Center Point, AL | 3.0 | 1.0 | 1027 | $1,165 | $1.13 | 43d | 1 | 1.28mi |
| 305 18th Ct NW Center Point, AL | 3.0 | 1.5 | 1270 | $1,100 | $0.87 | 43d | 1 | 1.29mi |
| 1830 Christian St Birmingham, AL | 3.0 | 2.0 | 1468 | $1,375 | $0.94 | 2d | 1 | 1.32mi |
| 1629 1st St NW Center Point, AL | 3.0 | 1.0 | 900 | $1,025 | $1.14 | 23d | 1 | 1.32mi |
| 341 Argonne Dr NE Center Point, AL | 3.0 | 1.0 | 1040 | $1,300 | $1.25 | 2d | 1 | 1.33mi |
| 213 Meadwood Dr NE Center Point, AL | 3.0 | 1.0 | 1194 | $995 | $0.83 | 43d | 1 | 1.34mi |
| 3073 Panorama E Birmingham, AL | 1.0–3.0 | 1.0–2.0 | 975 | $1,275 | $1.31 | 1d | 20 | 1.34mi |
| 1628 1st St NW Center Point, AL | 3.0 | 1.0 | 1124 | $1,150 | $1.02 | 43d | 1 | 1.34mi |
| 2323 4th St NW Center Point, AL | 3.0 | 1.0 | 1038 | $1,305 | $1.26 | 2d | 1 | 1.35mi |
| 424 Tupelo Way Center Point, AL | 4.0 | 2.0 | 1233 | $1,300 | $1.05 | 43d | 1 | 1.38mi |
Listing history 15 events
-
2026-06-03days on market $119,000 Active 190 DOM
-
2026-06-02days on market $119,000 Active 189 DOM
-
2026-06-01days on market $119,000 Active 188 DOM
-
2026-05-31days on market $119,000 Active 187 DOM
-
2025-11-25$119,000 Active 399-char remark
Show marketing remark (399 chars)
This home is perfect for someone looking to downsize or an investor ready for their next opportunity. This 3-bedroom, 1-bathroom home offers a spacious living room, dining room, generous bedrooms, sizable kitchen, covered deck, and a large backyard. Whether you’re simplifying life or looking to expand your investment portfolio this home has the space, updates, and location to make it a win.
-
2018-10-31soldstatus $71,704
-
2018-10-22soldstatus $71,500 Sold 220-char remark
Show marketing remark (220 chars)
This is a super nice home in a quiet neighborhood that is convenient to everything and near all major roads. The home is very clean and move in ready. If you are looking for a home with lots of character look no further.
-
2018-08-24historical 220-char remark
Show marketing remark (220 chars)
This is a super nice home in a quiet neighborhood that is convenient to everything and near all major roads. The home is very clean and move in ready. If you are looking for a home with lots of character look no further.
-
2018-08-09$73,500 Active 220-char remark
Show marketing remark (220 chars)
This is a super nice home in a quiet neighborhood that is convenient to everything and near all major roads. The home is very clean and move in ready. If you are looking for a home with lots of character look no further.
-
2015-08-24soldstatus $35,500
-
2015-07-27historical
-
2015-07-03$38,000
-
2011-06-30soldstatus $60,000
-
2001-09-07soldstatus $71,000
-
1995-03-27soldstatus $59,000
ⓘ Source: listings_history table (triggers on properties + properties_extension) + one-shot
backfill from property_details.listing_events for pre-trigger history.
Tax reassessment forecast AL · Resets to sale price
- Current annual tax
- $478 · $40/mo
- Projected year-2 tax
- $488 · $41/mo
- Expected delta
- +$10/yr (+$1/mo · 2.0%)
ⓘ Screening estimate from a state-policy table — verify with the county assessor before closing.
Climate risk First Street
- Flood 1/10 Low FEMA zone X (unshaded) · 0% chance over 30 yrs
- Wildfire 3/10 Moderate
- Heat 5/10 Major 7 d/yr ≥105°F today · 17 d/yr by 30 yrs out
- Wind 6/10 Major 27% chance of damaging wind over 30 yrs
- Air quality 5/10 Major 7 unhealthy d/yr today · 9 by 30 yrs out
Nearby sold comps map
Loading sold comps map…
Walkable amenities ~0.75 mi
Loading nearby amenities…
Taxation est. · year 1
- Rental income
- $15,280
- − Mortgage interest
- −$6,666
- − Property taxes
- −$478
- − Insurance
- −$595
- − Repairs & maintenance
- −$1,222
- − Management
- −$1,222
- − Depreciation
- −$3,462
- Taxable income
- $1,635
- Est. tax owed @ 24.0%
- −$392
- After-tax cash flow
- $3,117/yr
For passive investors: Depreciation is non-cash, so a rental often shows a tax loss while cash-flowing — sheltering income. Rental losses are passive: they offset passive income freely, and up to $25,000/yr can offset ordinary (W-2) income if you actively participate and your MAGI is under $100k (phasing out to $0 by $150k); unused losses carry forward. On sale, claimed depreciation is recaptured at up to 25%, and gains may owe capital-gains tax (a 1031 exchange can defer both). Figures are a year-1 estimate at your 24.0% rate — not tax advice; consult a CPA.
Schools (NCES district)
- District
- Jefferson County
- NCES district ID
- 0101920
- Math proficiency
- 9% ▼ -24.00%
- Reading proficiency
- 32% ▼ -5.00%
- Median HH income
- $51,712
- Composite
- 18.4/100
- National rank
- #8937
- State rank
- #104 of 129 in AL
Livability — Center Point
- Score
- 63/100
- State rank
- #193
- US rank
- #15671
Category grades
Schools grade is shown separately in the Schools card above.
Census & demographics
- Census place
- Center Point, AL
- County
- Jefferson County · 527,445 people
- City population
- 43,903
- Metro
- Birmingham-Hoover, AL
- Population (ZIP)
- 43,903
- Household income
- $52,793
- Rent vs Own
- Severe rent burden
- 1729.0
Population outlook (Jefferson County) Hauer SSP2
- Today (2025)
- 669,185 people
- By 2030
- 669,694 · +0.1%
- By 2040
- 661,388 · -1.2%
- By 2050
- 643,086 · -3.9%
- By 2075
- 577,267 · -13.7%
- By 2100
- 474,758 · -29.1%
Race, ethnicity, and origin ACS 2023
- Neighborhood character
- Predominantly Black (75%)
- Race & ethnicity
- Black 75% White 15% Hispanic / Latino 7% Two or more races 3%
- Hispanic origin (detail)
- Mexican 4%
- Common ancestry
- Lithuanian 1% Italian 1% Slovak 1%
- Foreign-born
- 4% · Canada
- Languages at home
- 92% English-only · Spanish 7%
Political lean MEDSL · Jefferson
- 2024 margin
- D (+10.4) · D 54.6% · R 44.2% · Other 1.2%
- 2008→2024 swing
- +5.4pp toward D · 2008: 5.1pp · 2024: 10.4pp
- All cycles
- 2024: D+10.4 2020: D+13.2 2016: D+7.2 2012: D+6.0 2008: D+5.1
Not yet ingested
- Civics
- —
Market trends
- HPI YoY
- ▼ -112.97%
- Current HPI
- 215.0607
- Rent YoY
- ▲ 3.04%
- Metro
- Birmingham-Hoover, AL
- State GDP YoY
- ▲ 2.94%
- F500 in state
- 4
Industry mix (Fortune 500 HQ in AL)
| Industry | F500 HQs | Revenue |
|---|---|---|
| Financial Services | 1 | $8B |
|
||
| Healthcare | 1 | $5B |
|
||
Price history
+101.7% since first listed11 events — show timeline
- 2025-11-25 Listed $119,000 Greater Alabama MLS
- 2018-10-31 Sold (Public Records) $71,704 Public Records
- 2018-10-22 Sold (MLS) $71,500 Greater Alabama MLS
- 2018-08-24 Delisted — Greater Alabama MLS
- 2018-08-09 Listed $73,500 Greater Alabama MLS
- 2015-08-24 Sold (MLS) $35,500 Greater Alabama MLS
- 2015-07-27 Delisted — Greater Alabama MLS
- 2015-07-03 Listed $38,000 Greater Alabama MLS
- 2011-06-30 Sold (Public Records) $60,000 Public Records
- 2001-09-07 Sold (Public Records) $71,000 Public Records
- 1995-03-27 Sold (Public Records) $59,000 Public Records
Property tax history
+5.3%/yrLatest (2025): $478 · +7.7% YoY. Source: county tax records.
Cash-flow waterfall
monthlySold comps — $/sqft
last 12 mo · ≤1 miLoading sold comps…