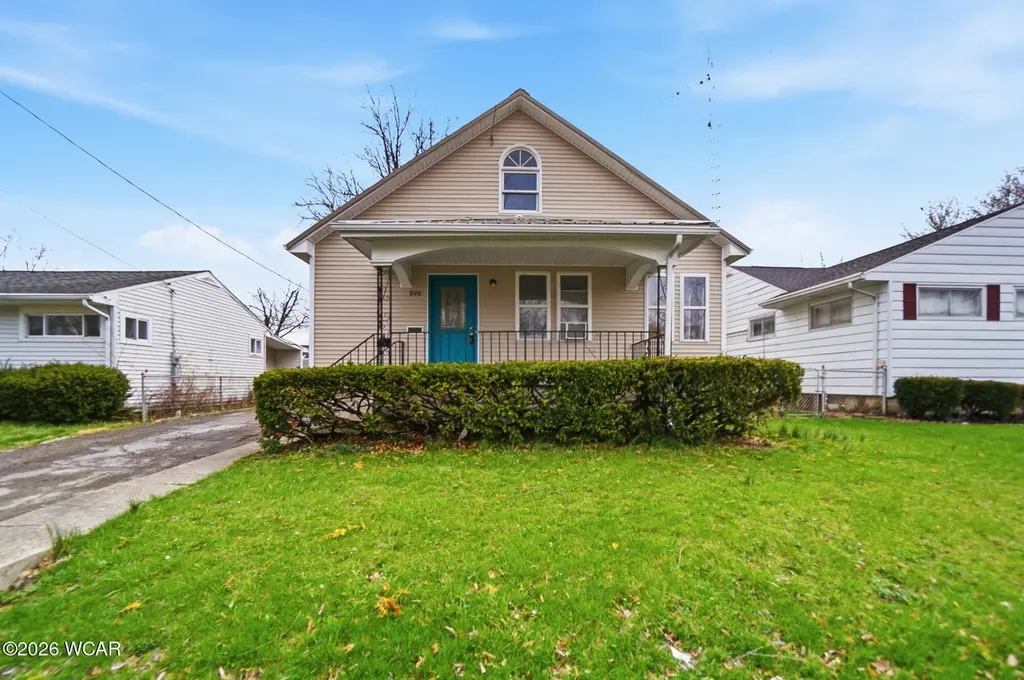
928 Burch Ave · Lima, OH
Flood risk 1/10 · Minimal
- FEMA flood zone
- X (unshaded)
- Chance of flooding over 30 yrs
- 0.0%
- Est. flood insurance / yr
- $473 – $860
Fire risk 1/10 · Minimal
- Est. fire insurance / yr
- $713 – $1,323
Heat risk 3/10 · Minor
- Hot days now (above 100°F)
- 7 days/yr
- Hot days in 30 yrs
- 18 days/yr
Wind risk 2/10 · Minimal
- Chance of severe wind over 30 yrs
- —
Air-quality risk 2/10 · Minimal
- Unhealthy air days now
- 1 days/yr
- Unhealthy air days in 30 yrs
- 2 days/yr
Risk factors via First Street. Map © Google.
Why this score? — see what drove the D+ grade
The composite is a weighted blend of 9 inputs, each scored 0–100. Each bar is that input's sub-score; the figure is the points it added to the 100-point composite (weight × sub-score).
- Cash flow +19.8/30.0
- ARV discount +7.4/15.0
- DSCR +6.3/10.0
- 1% rule +4.2/10.0
- Livability +3.2/5.0
- Schools +2.6/10.0
- Rent growth +2.5/5.0
- Condition / age +2.5/5.0
- Appreciation +0.0/10.0
$162,000
🖨 Deal sheet 📄 Offer letter ✓ Due diligence
Listing remarks MLS
hud case#413-282642, fha insured financing available, home is sold as-is, hud will not make any repairs, electronic bidding via phone or internet only.....MCB makes no warranty as to the existence ofmold in this property, and is not liable for the potentially harmful effects thereof.
Key facts
- New metal roof
- Fresh paint
- 2 bedrooms added
Tags
Property features AI
Finance
- Other: Property type: Residential; Lot: 0.2 acres (residential zoning)
Exterior
- Parking: Garage with 1 parking space
- Utilities: Public water; Public sewer; Electricity connected; Cable available; Water connected
- Home design: Single-family residence; Two levels; Updated/remodeled
- Construction: Vinyl siding; Block foundation; Built with block foundation
- Exterior features: Covered patio/porch; Fenced yard; Detached garage structure
Interior
- Flooring: Hardwood; Laminate
- Bathrooms: 1 full bathroom
- Heating & cooling: Baseboard heating; Window air conditioning
- Interior features: Hardwood and laminate flooring; Living room fireplace; Unfinished block basement
Neighborhood map
What this means for you Summary
Snapshot
- This is a 2-bed/1.0-bath single-family listed at $162k.
Deal economics
- At list price, monthly cash flow is $194 ($2k/yr) — positive.
- The deal already cash-flows at list — no discount required.
- To meet the 1% rule (rent ≥ 1% of price), the offer needs to be $150k (7.6% below list).
- Recommended offer: $150k (7.6% below list) — sets the bar for 1% rule.
Location & tenants
- Location reads 64/100 on livability (#787 in OH) — a middle-class / working-renter tenant base. Strengths: cost of living A+, housing A+, health & safety A-; Watch: crime F, amenities F, commute F.
- Lima City (urban): math 29% / reading 36% proficiency, ranked #575 of 656 in OH (top 88%) — families likely to look elsewhere, expect single-tenant / working-renter base with shorter leases; 83% free/reduced lunch — lower-income household profile, screen leases tightly.
- Market conditions: 74 active listings in the ZIP; 7 comparable units currently listed for rent nearby; rentals lingering (median 44d on market — plan ~5-8 weeks vacancy on turnover, expect pricing pressure); 100% of comp listings sitting > 30 days — soft ceiling on asking rent; 88 units permitted in Allen County in 2024 (0 in 5+ unit buildings).
- This rent runs 35% of the median local income ($52k/yr) — at the standard rent-burdened threshold; future hikes will face affordability resistance.
Forward outlook
- Local home prices are declining (-3.0%/yr); year-one equity from $1k of loan paydown is wiped out by about $5k of value loss. Plan a longer hold.
- Allen County population projected at -14% by 2050 — secular population decline; favor cash flow + early exit over multi-decade hold.
Negotiation context
- It's been on market 86 days — a 6% lower offer ($152k) is reasonable based on typical stale-listing flexibility.
- 3 sale attempts since 24y ago with the ask held roughly flat each time — persistent listings suggest the price (not the market) is what's stuck; bring a comps-based counter.
- Current owner paid $30k; list at $162k implies a 434% gain — meaningful room to come down on a strong offer.
Risks & watch-outs
- Watch-outs: built in 1913 — expect roof / HVAC / electrical / plumbing capex.
Questions for the listing agent
- It's been on market 86 days. Have you received any prior offers? Is the seller open to a 8% concession, seller financing, or rate buy-down credit?
- Built in 1913 — when were the roof, HVAC, electrical panel, plumbing, and water heater last replaced?
- Why hasn't it sold? Are there any deal-killer items the seller is aware of (foundation, flood, title, zoning, code violations)?
- Is there a deadline driving the sale (1031 exchange, divorce, estate, relocation)? That informs how much negotiation room exists.
- Crime grade is F in this area — have there been break-ins, vandalism, or insurance claims at this property in the last 3 years? What carrier currently insures it and at what premium?
- The area grade is low — what's the realistic commute time and amenity access for the typical tenant pool here? Any planned neighborhood developments (good or bad) we should know about?
- What's the average days-on-market for RENTAL listings here right now (not sales)? A rising rental-DOM trend means longer vacancies and softer asking-rent achievability than the comps imply.
- What's the recent tenant-quality profile in this submarket — average credit score on applications, eviction rate, late-payment / NSF rate, and stable-employment percentage? A property-management company in the area should have these aggregated.
- How much new for-sale + rental construction is in the pipeline within 1–3 miles? Heavy new supply typically softens prices + rents 12–24 months out; constrained supply supports both.
Investment metrics
- 1% rule
- 0.92% ✗
- Cap rate
- 7.73%
- Cash-on-cash
- 5.14%
- DSCR
- 1.23
- GRM
- 9.0
CMA / ARV
- ARV (on-the-fly)
- $161,820
- Comps found
- 12
Show comp detail 12 sales within ~0.75 mi
| Address | Dist | Beds/Ba | Sqft | Sold | Price | $/sf | Match |
|---|---|---|---|---|---|---|---|
| 1041 N Elizabeth St | 0.32mi | 3/2.0 (+1) | 1,752 (+1%) | 5mo | $100,000 | $57 | 71 |
| 716 Ruth Ave | 0.55mi | 3/1.5 (+1) | 1,714 (-2%) | 0mo | $190,000 | $111 | 65 |
| 735 N Main St | 0.47mi | 3/1.0 (+1) | 1,638 (-6%) | 6mo | $161,000 | $98 | 58 |
| 720 N West St | 0.23mi | 3/2.0 (+1) | 1,496 (-14%) | 0mo | $90,000 | $60 | 57 |
| 635 W Ashton Ave | 0.21mi | 3/2.0 (+1) | 1,485 (-15%) | 2mo | $188,000 | $127 | 55 |
| 735 Brice Ave | 0.64mi | 3/2.0 (+1) | 1,795 (+3%) | 3mo | $155,000 | $86 | 54 |
| 416 Hazel Ave | 0.30mi | 3/2.0 (+1) | 1,494 (-14%) | 1mo | $158,000 | $106 | 52 |
| 458 W Mckibben St | 0.49mi | 3/2.0 (+1) | 1,816 (+4%) | 10mo | $150,000 | $83 | 52 |
| 608 W Grand Ave | 0.34mi | 3/1.0 (+1) | 1,548 (-11%) | 10mo | $62,000 | $40 | 52 |
| 517 Marian Ave | 0.30mi | 3/1.5 (+1) | 1,552 (-11%) | 11mo | $160,000 | $103 | 52 |
| 623 N Metcalf St | 0.45mi | 3/1.5 (+1) | 1,520 (-13%) | 11mo | $141,000 | $93 | 42 |
| 1000 Rice Ave | 0.75mi | 3/1.0 (+1) | 1,485 (-15%) | 12mo | $43,670 | $29 | 26 |
Match score weights: distance 35% · size 25% · config 20% · recency 20%. Top-matched comps best support the ARV.
Projected returns pro-forma
-3.0% appreciation · 3.0% rent growth · sell at horizon
- IRR
- -8.4%
- Equity multiple
- 0.69×
- Total profit
- $-13,943
- Equity at exit
- $24,155
- IRR
- 1.1%
- Equity multiple
- 1.08×
- Total profit
- $3,548
- Equity at exit
- $14,007
Cash invested: $45,360 (down + closing). Projections, not guarantees.
Landlord ↔ Tenant lean methodology
- Overall (STATE)
- 73 Landlord-Friendly
- State Ohio
- 73 Landlord-Friendly · R+6
- County
- — inherits STATE
- City
- — inherits STATE
ZIP-level market 45801
- Active inventory
- 74
- Price-to-rent
- 9.0×
Monthly cashflow live
- Estimated rent
- $1,498 high interval (Pro) →
- Mortgage (P&I)
- −$850
- Tax from tax record
- −$72 /mo · $864/yr
- Insurance
- −$68
- HOA
- −$0
- Vacancy / Maint / Mgmt
- −$315
- Net cashflow
- $194
Break-even live
UW: 25.0% down · 7.5% · 30yr · 1.5% tax · 5.0% vac · 8.0% maint · 8.0% mgmt
Financing live
Cash to close
- Down payment
- $40,500
- Closing costs
- $4,860
- Reserves months
- —
- Total cash needed
- —
Loan-product check · same deal, 3 products live
Conventional
25% down · 7.5% · 30yr
- Down + closing
- —
- Monthly P&I
- —
- Monthly cashflow
- —
- DSCR
- —
- Eligible?
- —
Personal DTI + credit; lowest rate.
DSCR
20% down · 8.5% · 30yr
- Down + closing
- —
- Monthly P&I
- —
- Monthly cashflow
- —
- DSCR
- —
- Eligible?
- —
No personal income docs; deal must DSCR.
Hard money
10% down · 12.0% · 12mo
- Down + closing
- —
- Monthly P&I
- —
- Monthly cashflow
- —
- DSCR
- —
- Eligible?
- —
Short-term bridge; refi at stabilization.
Rent comps 7 comps
| Address | Beds | Baths | Sqft | Rent | $/sqft | DOM | Units | Dist |
|---|---|---|---|---|---|---|---|---|
| 330 W Ashton Ave Lima, OH | 3.0 | 1.0 | 1288 | $2,000 | $1.55 | 43d | 1 | 0.18mi |
| 555 Haller St Lima, OH | 3.0 | 2.0 | 1953 | $1,700 | $0.87 | 43d | 1 | 0.48mi |
| 420 N Baxter St Lima, OH | 3.0 | 2.0 | 1386 | $1,200 | $0.87 | 43d | 1 | 0.69mi |
| 43 Town Sq Lima, OH | 2.0–3.0 | 1.0–2.0 | 1100 | $956 | $0.87 | 43d | 9 | 1.01mi |
| 405 N Kenilworth Ave Lima, OH | 3.0 | 1.0 | 1352 | $1,795 | $1.33 | 43d | 1 | 1.15mi |
| 1436 W High St Lima, OH | 2.0 | 1.0 | 1205 | $895 | $0.74 | 43d | 1 | 1.37mi |
| 138 Harrison Ave Lima, OH | 3.0 | 1.0 | 1152 | $975 | $0.85 | 43d | 1 | 1.43mi |
Listing history 25 events
-
2026-06-19days on market $162,000 Active 86 DOM
-
2026-06-18days on market $162,000 Active 85 DOM
-
2026-06-17days on market $162,000 Active 84 DOM
-
2026-06-16days on market $162,000 Active 83 DOM
-
2026-06-15days on market $162,000 Active 82 DOM
-
2026-06-14days on market $162,000 Active 80 DOM
-
2026-06-12days on market $162,000 Active 79 DOM
-
2026-06-09days on market $162,000 Active 76 DOM
-
2026-06-08days on market $162,000 Active 75 DOM
-
2026-06-07days on market $162,000 Active 74 DOM
-
2026-06-07days on market $162,000 Active 73 DOM
-
2026-06-04days on market $162,000 Active 70 DOM
-
2026-06-02days on market $162,000 Active 69 DOM
-
2026-06-01days on market $162,000 Active 68 DOM
-
2026-05-31days on market $162,000 Active 67 DOM
-
2026-05-31days on market $162,000 Active 66 DOM
-
2026-04-27historical Active Under Contract
-
2026-03-24$167,000 Active
-
2025-10-09price $30,345 284-char remark
Show marketing remark (284 chars)
hud case#413-282642, fha insured financing available, home is sold as-is, hud will not make any repairs, electronic bidding via phone or internet only.....MCB makes no warranty as to the existence ofmold in this property, and is not liable for the potentially harmful effects thereof.
-
2003-03-19soldstatus $30,345 284-char remark
Show marketing remark (284 chars)
hud case#413-282642, fha insured financing available, home is sold as-is, hud will not make any repairs, electronic bidding via phone or internet only.....MCB makes no warranty as to the existence ofmold in this property, and is not liable for the potentially harmful effects thereof.
-
2003-02-06price $31,950 284-char remark
Show marketing remark (284 chars)
hud case#413-282642, fha insured financing available, home is sold as-is, hud will not make any repairs, electronic bidding via phone or internet only.....MCB makes no warranty as to the existence ofmold in this property, and is not liable for the potentially harmful effects thereof.
-
2003-02-01$31,950 284-char remark
Show marketing remark (284 chars)
hud case#413-282642, fha insured financing available, home is sold as-is, hud will not make any repairs, electronic bidding via phone or internet only.....MCB makes no warranty as to the existence ofmold in this property, and is not liable for the potentially harmful effects thereof.
-
2003-02-01historical
Show marketing remark (284 chars)
hud case#413-282642, fha insured financing available, home is sold as-is, hud will not make any repairs, electronic bidding via phone or internet only.....MCB makes no warranty as to the existence ofmold in this property, and is not liable for the potentially harmful effects thereof.
-
2002-11-15$31,950
-
1994-07-29soldstatus $39,000
ⓘ Source: listings_history table (triggers on properties + properties_extension) + one-shot
backfill from property_details.listing_events for pre-trigger history.
Tax reassessment forecast OH · Partial reset (capped growth)
- Current annual tax
- $864 · $72/mo
- Projected year-2 tax
- $1,695 · $141/mo
- Expected delta
- +$832/yr (+$69/mo · 96.3%)
ⓘ Screening estimate from a state-policy table — verify with the county assessor before closing.
Climate risk First Street
- Flood 1/10 Low FEMA zone X (unshaded) · 0% chance over 30 yrs
- Wildfire 1/10 Low
- Heat 3/10 Moderate 7 d/yr ≥100°F today · 18 d/yr by 30 yrs out
- Wind 2/10 Low
- Air quality 2/10 Low 1 unhealthy d/yr today · 2 by 30 yrs out
Nearby sold comps map
Loading sold comps map…
Walkable amenities ~0.75 mi
Loading nearby amenities…
Taxation est. · year 1
- Rental income
- $17,972
- − Mortgage interest
- −$9,075
- − Property taxes
- −$864
- − Insurance
- −$810
- − Repairs & maintenance
- −$1,438
- − Management
- −$1,438
- − Depreciation
- −$4,713
- Taxable loss
- −$364
- Est. tax savings @ 24.0%
- +$87
- After-tax cash flow
- $2,417/yr
For passive investors: Depreciation is non-cash, so a rental often shows a tax loss while cash-flowing — sheltering income. Rental losses are passive: they offset passive income freely, and up to $25,000/yr can offset ordinary (W-2) income if you actively participate and your MAGI is under $100k (phasing out to $0 by $150k); unused losses carry forward. On sale, claimed depreciation is recaptured at up to 25%, and gains may owe capital-gains tax (a 1031 exchange can defer both). Figures are a year-1 estimate at your 24.0% rate — not tax advice; consult a CPA.
Schools (NCES district)
- District
- Lima City
- NCES district ID
- 3904422
- Math proficiency
- 29% ▼ -13.00%
- Reading proficiency
- 36% ▼ -6.00%
- Median HH income
- $29,685
- Composite
- 26.31/100
- National rank
- #7243
- State rank
- #575 of 656 in OH
Livability — Lima
- Score
- 64/100
- State rank
- #787
- US rank
- #14288
Category grades
Schools grade is shown separately in the Schools card above.
Census & demographics
- Census place
- Lima, OH
- County
- Allen County · 21,739 people
- City population
- 21,739
- Metro
- Lima, OH
- Population (ZIP)
- 21,739
- Household income
- $51,731
- Rent vs Own
- Severe rent burden
- 1141.0
Population outlook (Allen County) Hauer SSP2
- Today (2025)
- 100,321 people
- By 2030
- 97,693 · -2.6%
- By 2040
- 91,802 · -8.5%
- By 2050
- 86,152 · -14.1%
- By 2075
- 73,659 · -26.6%
- By 2100
- 58,716 · -41.5%
Race, ethnicity, and origin ACS 2023
- Neighborhood character
- Predominantly White (71%)
- Race & ethnicity
- White 71% Black 14% Two or more races 8% Hispanic / Latino 6% Asian 1%
- Hispanic origin (detail)
- Mexican 5%
- Common ancestry
- Lithuanian 2% Italian 1% Iranian 1%
- Foreign-born
- 2% · Canada, China
- Languages at home
- 96% English-only · Spanish 2%
Political lean MEDSL · Allen
- 2024 margin
- Solid R (+44.1) · D 27.5% · R 71.6%
- 2008→2024 swing
- -23.4pp toward R · 2008: -20.7pp · 2024: -44.1pp
- All cycles
- 2024: R+44.1 2020: R+39.5 2016: R+38.2 2012: R+25.7 2008: R+20.7
Not yet ingested
- Civics
- —
Market trends
- HPI YoY
- ▼ -164.79%
- Current HPI
- 219.5329
- Rent YoY
- —
- Metro
- Lima, OH
- State GDP YoY
- ▲ 1.98%
- F500 in state
- 48
Industry mix (Fortune 500 HQ in OH)
| Industry | F500 HQs | Revenue |
|---|---|---|
| Insurance | 3 | $145B |
|
||
| Industrial Machinery | 3 | $49B |
|
||
| Financial Services | 3 | $24B |
|
||
| Consumer Goods | 2 | $93B |
|
||
| Aerospace / Defense | 2 | $47B |
|
||
| Utilities | 2 | $33B |
|
||
Price history
+328.2% since first listed9 events — show timeline
- 2026-04-27 Contingent — WCARE
- 2026-03-24 Listed $167,000 WCARE
- 2025-10-09 Price Changed $30,345 NORIS
- 2003-03-19 Sold (MLS) $30,345 NORIS
- 2003-02-06 Price Changed $31,950 NORIS
- 2003-02-01 Listing Removed — NORIS
- 2003-02-01 Listed $31,950 NORIS
- 2002-11-15 Listed $31,950 NORIS
- 1994-07-29 Sold (Public Records) $39,000 Public Records
Property tax history
+0.7%/yrLatest (2025): $864 · -5.4% YoY. Source: county tax records.
Cash-flow waterfall
monthlySold comps — $/sqft
last 12 mo · ≤1 miLoading sold comps…