509 NW 36th Ave · Cape Coral, FL
Flood risk 9/10 · Severe
- FEMA flood zone
- AE
- Chance of flooding over 30 yrs
- 0.99%
- Est. flood insurance / yr
- $1,737 – $8,500
Fire risk 2/10 · Minimal
- Est. fire insurance / yr
- $947 – $1,759
Heat risk 10/10 · Severe
- Hot days now (above 107°F)
- 7 days/yr
- Hot days in 30 yrs
- 31 days/yr
Wind risk 10/10 · Severe
- Chance of severe wind over 30 yrs
- 99.0%
Air-quality risk 2/10 · Minimal
- Unhealthy air days now
- 1 days/yr
- Unhealthy air days in 30 yrs
- 1 days/yr
Risk factors via First Street. Map © Google.
Why this score? — see what drove the B grade
The composite is a weighted blend of 9 inputs, each scored 0–100. Each bar is that input's sub-score; the figure is the points it added to the 100-point composite (weight × sub-score).
- Cash flow +29.8/30.0
- ARV discount +15.0/15.0
- DSCR +10.0/10.0
- 1% rule +8.5/10.0
- Schools +4.1/10.0
- Livability +3.9/5.0
- Condition / age +2.5/5.0
- Rent growth +1.1/5.0
- Appreciation +0.0/10.0
$250,000
🖨 Deal sheet 📄 Offer letter ✓ Due diligence
Listing remarks MLS
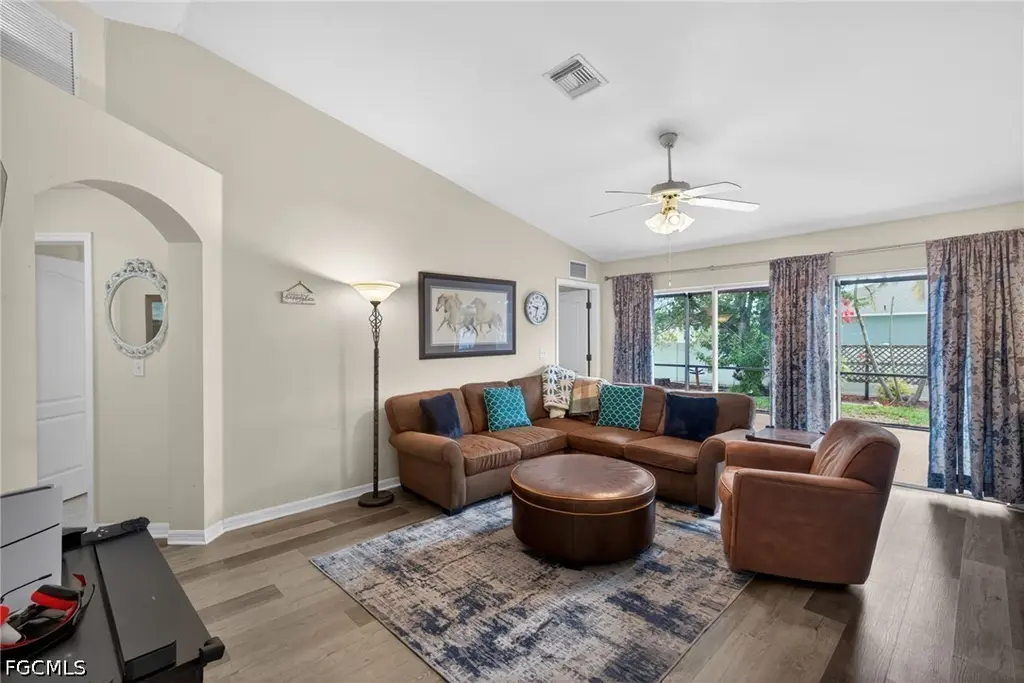
Excellent 3 bedroom, 2 bath, 2 car garage with a den and privacy fenced back yard built by First Home Builders. Interior offers an open floor plan with split bedrooms. Kitchen faces onto living area. Sliding glass doors lead onto large screened patio area. Walk out of screened area an onto large open patio. Plenty of room for pool. Water equipment has been updated. Mature tropical landscaping. All plant beds have concrete curbing. Conveniently located close to Tropicana Parkway and Burnt Store Rd. Home is in great condition and ready for new owners.
Key facts
- 0.23 acre lot
- 2 garage spots
- Built 2004
Property features AI
Finance
- Financial info: Pets allowed
- HOA & community: Non-gated community; No association fee listed
Exterior
- Parking: Attached garage with 2 covered spaces; Driveway; Paved parking; Garage door opener
- Utilities: Well water; Septic tank; Cable available; High-speed internet available
- Home design: Single-story home; Resale property; Faces west; R1 zoning
- Construction: Block, concrete and stucco construction; Shingle roof
- Exterior features: Fenced yard; Patio; Lanai; Screened porch; Porch; Exterior shutters (manual); Across-the-road water frontage; East exposure; Publicly maintained road
Interior
- Kitchen: Range; Microwave; Dishwasher
- Bedrooms: Den (can be used as bedroom/office); Office; Screened porch
- Flooring: Carpet; Laminate
- Bathrooms: 2 full bathrooms
- Heating & cooling: Central heating (electric); Central air conditioning (electric); Ceiling fans
- Interior features: Vaulted ceilings; Breakfast bar; French doors / atrium doors; Tub with shower; Home office; Split bedroom layout; Single-hung windows; Unfurnished
- Laundry & utility: Washer and dryer (inside laundry)
Neighborhood map
What this means for you Summary
Snapshot
- This is a 3-bed/2.0-bath single-family listed at $250k.
Deal economics
- At list price, monthly cash flow is $488 ($6k/yr) — positive.
- The deal already cash-flows at list — no discount required.
- Meets the 1% rule at list price ($3k rent vs $250k).
- Cap rate 10.7% vs local median 3.1% in Cape Coral — top-decile yield for the area; either an underpriced asset or a hidden risk that comps aren't pricing in. Stress-test before assuming the spread holds.
Location & tenants
- Location reads 77/100 on livability (#208 in FL, #3,098 nationally) — a middle-class / working-renter tenant base. Strengths: housing A+, health & safety A+, amenities B+; Watch: commute F.
- Lee (suburban): math 47% / reading 50% proficiency, ranked #42 of 73 in FL (top 58%) — families likely to look elsewhere, expect single-tenant / working-renter base with shorter leases.
- Market conditions: Rents falling (-5.5%/yr); 2652 active listings in the ZIP; 17 comparable units currently listed for rent nearby; rentals at typical pace (median 24d on market — plan ~3-4 weeks tenant-placement turnaround); solid renter incomes; 15,411 units permitted in Lee County in 2024 (4,686 in 5+ unit buildings).
- This rent runs 45% of the median local income ($91k/yr) — at the standard rent-burdened threshold; future hikes will face affordability resistance.
Forward outlook
- Local home prices are declining (-3.0%/yr); year-one equity from $2k of loan paydown is wiped out by about $8k of value loss. Plan a longer hold.
- Lee County population projected at +44% by 2050 — long-run rental-demand tailwind backs the buy-and-hold thesis.
Negotiation context
- Only 7 days on market — expect competitive offers; lowballing is unlikely to land.
- 2 sale attempts since 8y ago with the ask held roughly flat each time — persistent listings suggest the price (not the market) is what's stuck; bring a comps-based counter.
- Current owner paid $190k; 32% above their basis — modest negotiation headroom, anchor on the comps not their cost.
Risks & watch-outs
- Watch-outs: flood insurance adds $427/mo.
- Climate carrying-cost: in FEMA flood zone AE (mandatory federal flood insurance); severe wind risk, 99% chance of damaging wind over 30y; extreme-heat days projected 7→31/yr by 2055 (HVAC capex compounding) — expect insurance premiums to compound above CPI over the hold.
Questions for the listing agent
- What's the actual annual flood-insurance premium (NFIP or private), and is the property in a SFHA with mandatory coverage?
- Is there a deadline driving the sale (1031 exchange, divorce, estate, relocation)? That informs how much negotiation room exists.
- Schools are B-rated — typically a magnet for longer-tenancy family renters. What's the average tenant stay here, and is there a school-zone premium baked into asking?
- What's the average days-on-market for RENTAL listings here right now (not sales)? A rising rental-DOM trend means longer vacancies and softer asking-rent achievability than the comps imply.
- What's the recent tenant-quality profile in this submarket — average credit score on applications, eviction rate, late-payment / NSF rate, and stable-employment percentage? A property-management company in the area should have these aggregated.
- How much new for-sale + rental construction is in the pipeline within 1–3 miles? Heavy new supply typically softens prices + rents 12–24 months out; constrained supply supports both.
Investment metrics
- 1% rule
- 1.35% ✓
- Cap rate
- 10.69%
- Cash-on-cash
- 15.69%
- DSCR
- 1.70
- GRM
- 6.2
CMA / ARV
- ARV (on-the-fly)
- $345,268
- Comps found
- 3
Show comp detail 3 sales within ~0.75 mi
| Address | Dist | Beds/Ba | Sqft | Sold | Price | $/sf | Match |
|---|---|---|---|---|---|---|---|
| 509 NW 36th Ave | 0.00mi | 3/2.0 | 1,463 (0%) | 1mo | $255,000 | $174 | 100 |
| 3323 NW 1st Ter | 0.53mi | 3/2.0 | 1,402 (-4%) | 13mo | $335,000 | $239 | 58 |
| 3408 Tropicana Pkwy W | 0.38mi | 3/2.0 | 1,272 (-13%) | 14mo | $299,900 | $236 | 49 |
Match score weights: distance 35% · size 25% · config 20% · recency 20%. Top-matched comps best support the ARV.
Projected returns pro-forma
-3.0% appreciation · 0.0% rent growth · sell at horizon
- IRR
- -7.6%
- Equity multiple
- 0.73×
- Total profit
- $-18,979
- Equity at exit
- $37,276
- IRR
- -3.4%
- Equity multiple
- 0.81×
- Total profit
- $-13,422
- Equity at exit
- $21,615
Cash invested: $70,000 (down + closing). Projections, not guarantees.
Landlord ↔ Tenant lean methodology
- Overall (STATE)
- 87 Strongly Landlord-Friendly
- State Florida
- 87 Strongly Landlord-Friendly · R+3
- County
- — inherits STATE
- City
- — inherits STATE
ZIP-level market 33993
- Home prices YoY
- -14.1%
- Rents YoY
- -5.5%
- Active inventory
- 2652
- Price-to-rent
- 6.2×
Monthly cashflow live
- Estimated rent
- $3,382 high interval (Pro) →
- Mortgage (P&I)
- −$1,311
- Tax from tax record
- −$341 /mo · $4,097/yr
- Insurance
- −$104
- Flood insurance flood zone
- −$427 /mo · $5,118/yr
- HOA
- −$0
- Vacancy / Maint / Mgmt
- −$710
- Net cashflow
- $488
Break-even live
UW: 25.0% down · 7.5% · 30yr · 1.5% tax · 5.0% vac · 8.0% maint · 8.0% mgmt
Financing live
Cash to close
- Down payment
- $62,500
- Closing costs
- $7,500
- Reserves months
- —
- Total cash needed
- —
Loan-product check · same deal, 3 products live
Conventional
25% down · 7.5% · 30yr
- Down + closing
- —
- Monthly P&I
- —
- Monthly cashflow
- —
- DSCR
- —
- Eligible?
- —
Personal DTI + credit; lowest rate.
DSCR
20% down · 8.5% · 30yr
- Down + closing
- —
- Monthly P&I
- —
- Monthly cashflow
- —
- DSCR
- —
- Eligible?
- —
No personal income docs; deal must DSCR.
Hard money
10% down · 12.0% · 12mo
- Down + closing
- —
- Monthly P&I
- —
- Monthly cashflow
- —
- DSCR
- —
- Eligible?
- —
Short-term bridge; refi at stabilization.
Rent comps 17 comps
| Address | Beds | Baths | Sqft | Rent | $/sqft | DOM | Units | Dist |
|---|---|---|---|---|---|---|---|---|
| 3322 NW 5th Ter Cape Coral, FL | 3.0 | 2.0 | 1666 | $5,000 | $3.00 | 23d | 1 | 0.19mi |
| 426 NW 37th Pl Cape Coral, FL | 3.0 | 2.0 | 1739 | $5,250 | $3.02 | 23d | 1 | 0.27mi |
| 222 NW 28th Ct Cape Coral, FL | 3.0 | 2.0 | 1116 | $1,526 | $1.37 | 10d | 1 | 0.78mi |
| 2837 NW 3rd St Cape Coral, FL | 3.0 | 3.0 | 1700 | $3,500 | $2.06 | 21d | 1 | 0.84mi |
| 2837 NW 3rd St Cape Coral, FL | 3.0 | 3.0 | 1700 | $3,500 | $2.06 | 23d | 1 | 0.84mi |
| 1220 NW 36th Pl Cape Coral, FL | 3.0 | 2.0 | 1468 | $1,995 | $1.36 | 14d | 1 | 0.97mi |
| 2835 NW Embers Ter Cape Coral, FL | 3.0 | 2.0 | 1667 | $2,250 | $1.35 | 14d | 1 | 1.01mi |
| 2710 NW 5th Ter Cape Coral, FL | 4.0 | 2.0 | 1830 | $1,925 | $1.05 | 16d | 1 | 1.04mi |
| 2716 NW Embers Ter Cape Coral, FL | 4.0 | 3.0 | 1765 | $3,000 | $1.70 | 23d | 1 | 1.17mi |
| 231 NW 26th Ave Cape Coral, FL | 3.0 | 2.0 | 1479 | $2,300 | $1.56 | 23d | 1 | 1.26mi |
| 512 NW 25th Ave Cape Coral, FL | 3.0 | 2.0 | 1702 | $2,100 | $1.23 | 11d | 1 | 1.31mi |
| 2453 NW 8th Ter Cape Coral, FL | 3.0 | 2.0 | 1574 | $2,200 | $1.40 | 23d | 1 | 1.31mi |
| 128 NW 25th Pl Cape Coral, FL | 3.0 | 2.0 | 1409 | $2,850 | $2.02 | 23d | 1 | 1.32mi |
| 2701 NW 11th St Cape Coral, FL | 3.0 | 2.0 | 1627 | $3,000 | $1.84 | 23d | 1 | 1.34mi |
| 2619 NW 11th St Cape Coral, FL | 3.0 | 2.0 | 1272 | $2,110 | $1.66 | 23d | 1 | 1.37mi |
| 2507 Embers Pkwy W Cape Coral, FL | 3.0 | 2.0 | 1777 | $2,450 | $1.38 | 23d | 1 | 1.45mi |
| 313 El Dorado Blvd N Cape Coral, FL | 3.0 | 2.0 | 1500 | $2,300 | $1.53 | 23d | 1 | 1.49mi |
Listing history 11 events
-
2026-04-17status Pending
-
2026-04-10$250,000 Active
-
2018-05-31soldstatus $189,900
-
2018-05-25soldstatus $189,900 Sold 555-char remark
Show marketing remark (555 chars)
Excellent 3 bedroom, 2 bath, 2 car garage with a den and privacy fenced back yard built by First Home Builders. Interior offers an open floor plan with split bedrooms. Kitchen faces onto living area. Sliding glass doors lead onto large screened patio area. Walk out of screened area an onto large open patio. Plenty of room for pool. Water equipment has been updated. Mature tropical landscaping. All plant beds have concrete curbing. Conveniently located close to Tropicana Parkway and Burnt Store Rd. Home is in great condition and ready for new owners.
-
2018-05-08status Pending With Contingencies 555-char remark
Show marketing remark (555 chars)
Excellent 3 bedroom, 2 bath, 2 car garage with a den and privacy fenced back yard built by First Home Builders. Interior offers an open floor plan with split bedrooms. Kitchen faces onto living area. Sliding glass doors lead onto large screened patio area. Walk out of screened area an onto large open patio. Plenty of room for pool. Water equipment has been updated. Mature tropical landscaping. All plant beds have concrete curbing. Conveniently located close to Tropicana Parkway and Burnt Store Rd. Home is in great condition and ready for new owners.
-
2018-04-27$189,900 Active 555-char remark
Show marketing remark (555 chars)
Excellent 3 bedroom, 2 bath, 2 car garage with a den and privacy fenced back yard built by First Home Builders. Interior offers an open floor plan with split bedrooms. Kitchen faces onto living area. Sliding glass doors lead onto large screened patio area. Walk out of screened area an onto large open patio. Plenty of room for pool. Water equipment has been updated. Mature tropical landscaping. All plant beds have concrete curbing. Conveniently located close to Tropicana Parkway and Burnt Store Rd. Home is in great condition and ready for new owners.
-
2011-04-08soldstatus $76,000
-
2011-03-24soldstatus $76,000 239-char remark
Show marketing remark (239 chars)
Beautiful NW Cape Coral Home near Tropicana and Burnt Store Rd. 3BR-DEN-2BA-2CG. Interior just painted and new carpet just installed. Kitchen appliances convey with home. Auto garage door opener. Fenced back yard with wooden privacy fence.
-
2011-03-09price $79,900 239-char remark
Show marketing remark (239 chars)
Beautiful NW Cape Coral Home near Tropicana and Burnt Store Rd. 3BR-DEN-2BA-2CG. Interior just painted and new carpet just installed. Kitchen appliances convey with home. Auto garage door opener. Fenced back yard with wooden privacy fence.
-
2010-08-12soldstatus $65,000
-
2010-07-15price $69,900
ⓘ Source: listings_history table (triggers on properties + properties_extension) + one-shot
backfill from property_details.listing_events for pre-trigger history.
Tax reassessment forecast FL · Resets to sale price
- Current annual tax
- $4,097 · $341/mo
- Projected year-2 tax
- $4,097 · $341/mo
- Expected delta
- $0/yr ($0/mo · 0.0%)
ⓘ Screening estimate from a state-policy table — verify with the county assessor before closing.
Climate risk First Street
- Flood 9/10 Extreme FEMA zone AE · 99% chance over 30 yrs
- Wildfire 2/10 Low
- Heat 10/10 Extreme 7 d/yr ≥107°F today · 31 d/yr by 30 yrs out
- Wind 10/10 Extreme 99% chance of damaging wind over 30 yrs
- Air quality 2/10 Low 1 unhealthy d/yr today · 1 by 30 yrs out
Nearby sold comps map
Loading sold comps map…
Walkable amenities ~0.75 mi
Loading nearby amenities…
Taxation est. · year 1
- Rental income
- $40,581
- − Mortgage interest
- −$14,004
- − Property taxes
- −$4,097
- − Insurance
- −$6,368
- − Repairs & maintenance
- −$3,246
- − Management
- −$3,246
- − Depreciation
- −$7,273
- Taxable income
- $2,347
- Est. tax owed @ 24.0%
- −$563
- After-tax cash flow
- $5,299/yr
For passive investors: Depreciation is non-cash, so a rental often shows a tax loss while cash-flowing — sheltering income. Rental losses are passive: they offset passive income freely, and up to $25,000/yr can offset ordinary (W-2) income if you actively participate and your MAGI is under $100k (phasing out to $0 by $150k); unused losses carry forward. On sale, claimed depreciation is recaptured at up to 25%, and gains may owe capital-gains tax (a 1031 exchange can defer both). Figures are a year-1 estimate at your 24.0% rate — not tax advice; consult a CPA.
Schools (NCES district)
- District
- Lee
- NCES district ID
- 1201080
- Math proficiency
- 47% ▼ -11.00%
- Reading proficiency
- 50% ▼ -4.00%
- Median HH income
- $49,518
- Composite
- 41.49/100
- National rank
- #3458
- State rank
- #42 of 73 in FL
Livability — Cape Coral
- Score
- 77/100
- State rank
- #208
- US rank
- #3098
Category grades
Schools grade is shown separately in the Schools card above.
Census & demographics
- Census place
- Cape Coral, FL
- County
- Lee County · 788,662 people
- City population
- 217,388
- Metro
- Cape Coral-Fort Myers, FL
- Population (ZIP)
- 35,580
- Household income
- $90,577
- Rent vs Own
- Severe rent burden
- 286.0
Population outlook (Lee County) Hauer SSP2
- Today (2025)
- 871,946 people
- By 2030
- 955,468 · +9.6%
- By 2040
- 1,113,587 · +27.7%
- By 2050
- 1,256,891 · +44.1%
- By 2075
- 1,560,270 · +78.9%
- By 2100
- 1,726,848 · +98.0%
Race, ethnicity, and origin ACS 2023
- Neighborhood character
- Diverse neighborhood (Simpson 0.58)
- Race & ethnicity
- White 57% Hispanic / Latino 30% Two or more races 21% Black 7% Asian 2%
- Hispanic origin (detail)
- Mexican 2% Puerto Rican 6% Cuban 17% Dominican 1%
- Common ancestry
- Romanian 2% Hispanic 2% Lithuanian 2%
- Foreign-born
- 21% · Canada, Jamaica, China
- Languages at home
- 73% English-only · Spanish 24% French/Haitian/Cajun 1% Russian/Polish/Slavic 1%
Political lean MEDSL · Lee
- 2024 margin
- Strong R (+28.4) · D 35.5% · R 63.9%
- 2008→2024 swing
- -18.0pp toward R · 2008: -10.4pp · 2024: -28.4pp
- All cycles
- 2024: R+28.4 2020: R+19.2 2016: R+20.4 2012: R+16.6 2008: R+10.4
Not yet ingested
- Civics
- —
Market trends
- HPI YoY
- ▼ -55.34%
- Current HPI
- 337.0575
- Rent YoY
- ▼ -5.51%
- Metro
- Cape Coral-Fort Myers, FL
- State GDP YoY
- ▲ 3.28%
- F500 in state
- 36
Industry mix (Fortune 500 HQ in FL)
| Industry | F500 HQs | Revenue |
|---|---|---|
| Industrial Technology | 2 | $29B |
|
||
| Insurance | 2 | $17B |
|
||
| Retail | 1 | $60B |
|
||
| Technology Distribution | 1 | $58B |
|
||
| Homebuilding | 1 | $35B |
|
||
| Technology Manufacturing | 1 | $35B |
|
||
Price history
+257.7% since first listed11 events — show timeline
- 2026-04-17 Pending — FORTMLS
- 2026-04-10 Listed $250,000 FORTMLS
- 2018-05-31 Sold (Public Records) $189,900 Public Records
- 2018-05-25 Sold (MLS) $189,900 FORTMLS
- 2018-05-08 Pending — FORTMLS
- 2018-04-27 Listed $189,900 FORTMLS
- 2011-04-08 Sold (Public Records) $76,000 Public Records
- 2011-03-24 Sold (MLS) $76,000 FORTMLS
- 2011-03-09 Price Changed $79,900 FORTMLS
- 2010-08-12 Sold (MLS) $65,000 FORTMLS
- 2010-07-15 Price Changed $69,900 FORTMLS
Property tax history
+5.4%/yrLatest (2025): $4,097 · +49.1% YoY. Source: county tax records.
Cash-flow waterfall
monthlySold comps — $/sqft
last 12 mo · ≤1 miLoading sold comps…