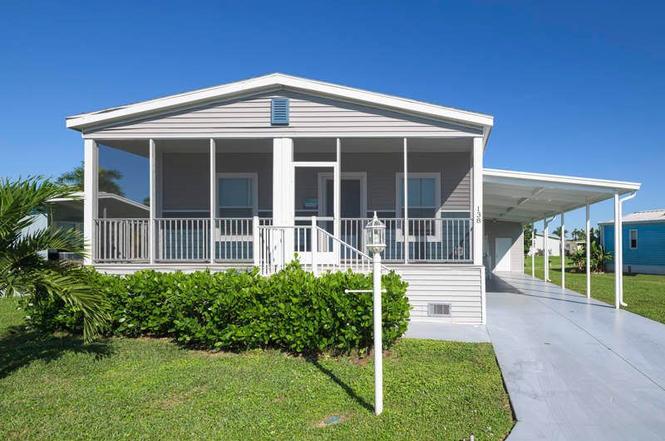
138 Cabbage Palm Ln · Winding Cypress, FL
Flood risk 8/10 · Major
- FEMA flood zone
- AE
- Chance of flooding over 30 yrs
- 0.99%
- Est. flood insurance / yr
- $1,737 – $8,500
Fire risk 4/10 · Minor
- Est. fire insurance / yr
- $947 – $1,759
Heat risk 10/10 · Severe
- Hot days now (above 108°F)
- 8 days/yr
- Hot days in 30 yrs
- 32 days/yr
Wind risk 10/10 · Severe
- Chance of severe wind over 30 yrs
- 99.0%
Air-quality risk 3/10 · Minor
- Unhealthy air days now
- 3 days/yr
- Unhealthy air days in 30 yrs
- 3 days/yr
Risk factors via First Street. Map © Google.
Why this score? — see what drove the B+ grade
The composite is a weighted blend of 9 inputs, each scored 0–100. Each bar is that input's sub-score; the figure is the points it added to the 100-point composite (weight × sub-score).
- Cash flow +30.0/30.0
- 1% rule +10.0/10.0
- DSCR +10.0/10.0
- ARV discount +7.5/15.0
- Schools +5.0/10.0
- Appreciation +4.3/10.0
- Rent growth +3.3/5.0
- Livability +2.5/5.0
- Condition / age +2.5/5.0
$175,900
🖨 Deal sheet (PDF) 📄 Offer letter ✓ Due diligence
Listing remarks
This brand-new home in sunny Naples, Florida, offers the perfect blend of comfort, style, and convenience. With 2 spacious bedrooms, 2 well-appointed bathrooms, and an additional den/office space, it's designed to meet the needs of modern living. The master bedroom is thoughtfully situated at the rear of the home, offering privacy and tranquility, and features a stunning master bath complete with a luxurious freestanding soaker tub, ideal for relaxing after a long day. The heart of the home is the gorgeous kitchen, featuring a large island that's perfect for cooking, entertaining, or casual dining. Located in the amenity-rich community of Marco Shores, this home places you just minutes away
Key facts
- Master bath
- Island in kitchen
- Den office
Tags
Property features AI
Finance
- Other: Listing status: Active; Listing provided by Zillow
- Financial info: List price $175,900
Exterior
- Home design: Single-family property (spec new construction); Plan name: 138 Cabbage Palm Lane; Address: 138 Cabbage Palm Ln, Naples FL 34114
Interior
- Bedrooms: 2 bedrooms
- Bathrooms: 2 full bathrooms
- Interior features: Living area of 1554 (listed under property information)
Neighborhood map
What this means for you Summary
Snapshot
- This is a 2-bed/2.0-bath manufactured listed at $176k.
Deal economics
- At list price, monthly cash flow is $2k ($20k/yr) — positive.
- The deal already cash-flows at list — no discount required.
- Meets the 1% rule at list price ($4k rent vs $176k).
- Recommended offer: $155k (12.0% below list) — sets the bar for market timing.
Location & tenants
- Location reads: area grade B — affects rentability + tenant quality, not the cash-flow math above.
- Collier (suburban): math 60% / reading 56% proficiency, ranked #16 of 73 in FL (top 22%) — acceptable for families but not a draw, mixed tenant base, ~2y average lease.
- Zoned schools: Manatee Elementary School (math 58% / reading 51%, grade C, #892 of 2,144 statewide, top 44%, 584 students, 73% FRL); Manatee Middle School (math 61% / reading 43%, grade C+, #217 of 571 statewide, top 40%, 749 students, 64% FRL); Lely High School (math 40% / reading 39%, grade F, #304 of 667 statewide, top 47%, 1,504 students, 54% FRL).
- Market conditions: Rents rising (+3.2%/yr); 905 active listings in the ZIP; 40 comparable units currently listed for rent nearby; rentals at typical pace (median 25d on market — plan ~3-4 weeks tenant-placement turnaround); solid renter incomes; 3,520 units permitted in Collier County in 2024 (959 in 5+ unit buildings).
- At $4,235/mo this rent would consume 57% of the median local household income ($89k/yr) (locally 550% of renters already pay >50% of income on rent) — very limited rent-growth headroom before tenants either downsize or default.
Forward outlook
- Local home prices are declining (-1.5%/yr); year-one equity from $1k of loan paydown is wiped out by about $3k of value loss. Plan a longer hold.
- Collier County population projected at +30% by 2050 — long-run rental-demand tailwind backs the buy-and-hold thesis.
- At projected returns (-1.5% appreciation + 3.2% rent growth), your $49k cash investment doubles in ~3 years — after that, you're playing with house money.
Negotiation context
- It's been on market 370 days — a 12% lower offer ($155k) is reasonable based on typical stale-listing flexibility.
Risks & watch-outs
- Watch-outs: flood insurance adds $427/mo.
- Climate carrying-cost: in FEMA flood zone AE (mandatory federal flood insurance); severe wind risk, 99% chance of damaging wind over 30y; extreme-heat days projected 8→32/yr by 2055 (HVAC capex compounding) — expect insurance premiums to compound above CPI over the hold.
Questions for the listing agent
- It's been on market 370 days. Have you received any prior offers? Is the seller open to a 12% concession, seller financing, or rate buy-down credit?
- What's the actual annual flood-insurance premium (NFIP or private), and is the property in a SFHA with mandatory coverage?
- Why hasn't it sold? Are there any deal-killer items the seller is aware of (foundation, flood, title, zoning, code violations)?
- Is there a deadline driving the sale (1031 exchange, divorce, estate, relocation)? That informs how much negotiation room exists.
- What's the average days-on-market for RENTAL listings here right now (not sales)? A rising rental-DOM trend means longer vacancies and softer asking-rent achievability than the comps imply.
- What's the recent tenant-quality profile in this submarket — average credit score on applications, eviction rate, late-payment / NSF rate, and stable-employment percentage? A property-management company in the area should have these aggregated.
- How much new for-sale + rental construction is in the pipeline within 1–3 miles? Heavy new supply typically softens prices + rents 12–24 months out; constrained supply supports both.
Investment metrics
- 1% rule
- 2.41% ✓
- Cap rate
- 20.82%
- Cash-on-cash
- 51.90%
- DSCR
- 3.31
- GRM
- 3.5
CMA / ARV
No comps found within radius.
Projected returns pro-forma
-1.48% appreciation · 3.21% rent growth · sell at horizon
- IRR
- 40.8%
- Equity multiple
- 2.88×
- Total profit
- $92,694
- Equity at exit
- $38,436
- IRR
- 45.5%
- Equity multiple
- 5.79×
- Total profit
- $235,958
- Equity at exit
- $37,025
Cash invested: $49,252 (down + closing). Projections, not guarantees.
Landlord ↔ Tenant lean methodology
- Overall (STATE)
- 87 Strongly Landlord-Friendly
- State Florida
- 87 Strongly Landlord-Friendly · R+3
- County
- — inherits STATE
- City
- — inherits STATE
ZIP-level market 34114
- Home prices YoY
- -0.6%
- Rents YoY
- 3.2%
- Active inventory
- 905
- Price-to-rent
- 3.5×
Monthly cashflow live
- Estimated rent
- $4,235 high interval (Pro) →
- Mortgage (P&I)
- −$922
- Tax est. 1.5%
- −$220 /mo · $2,638/yr
- Insurance
- −$73
- Flood insurance flood zone
- −$427 /mo · $5,118/yr
- HOA
- −$0
- Vacancy / Maint / Mgmt
- −$889
- Net cashflow
- $1,704
Break-even live
Sensitivity live
| Price | -10% $1,825 | -5% $1,764 | +0% $1,704 | +5% $1,643 | +10% $1,582 |
|---|---|---|---|---|---|
| Rent | -10% $1,369 | -5% $1,536 | +0% $1,704 | +5% $1,871 | +10% $2,038 |
| Rate | -1.0pp $1,792 | -0.5pp $1,748 | base $1,704 | +0.5pp $1,658 | +1.0pp $1,612 |
UW: 25.0% down · 7.5% · 30yr · 1.5% tax · 5.0% vac · 8.0% maint · 8.0% mgmt
Financing live
Cash to close
- Down payment
- $43,975
- Closing costs
- $5,277
- Reserves months
- —
- Total cash needed
- —
Loan-product check · same deal, 3 products live
Conventional
25% down · 7.5% · 30yr
- Down + closing
- —
- Monthly P&I
- —
- Monthly cashflow
- —
- DSCR
- —
- Eligible?
- —
Personal DTI + credit; lowest rate.
DSCR
20% down · 8.5% · 30yr
- Down + closing
- —
- Monthly P&I
- —
- Monthly cashflow
- —
- DSCR
- —
- Eligible?
- —
No personal income docs; deal must DSCR.
Hard money
10% down · 12.0% · 12mo
- Down + closing
- —
- Monthly P&I
- —
- Monthly cashflow
- —
- DSCR
- —
- Eligible?
- —
Short-term bridge; refi at stabilization.
Rent comps 40 comps
| Address | Beds | Baths | Sqft | Rent | $/sqft | DOM | Units | Dist |
|---|---|---|---|---|---|---|---|---|
| 2057 Yellowfin Cir Naples, FL | 3.0 | 3.0 | 2080 | $7,800 | $3.75 | 25d | 1 | 0.32mi |
| 1276 Enbrook Loop Naples, FL | 2.0 | 2.0 | 1503 | $5,000 | $3.33 | 25d | 1 | 0.38mi |
| 1212 Enbrook Loop Naples, FL | 2.0 | 2.0 | 1496 | $2,850 | $1.91 | 25d | 1 | 0.39mi |
| 1157 Enbrook Loop Naples, FL | 2.0 | 2.0 | 1503 | $3,000 | $2.00 | 25d | 1 | 0.44mi |
| 1171 Tranquil Brook Dr Naples, FL | 2.0 | 2.0 | 1503 | $4,500 | $2.99 | 15d | 1 | 0.45mi |
| 1937 Yellowfin Cir Naples, FL | 3.0 | 2.0 | 2214 | $3,830 | $1.73 | 22d | 1 | 0.46mi |
| 2235 Yellowfin Cir Naples, FL | 2.0 | 2.0 | 1500 | $2,795 | $1.86 | 25d | 1 | 0.48mi |
| 842 Enbrook Loop Naples, FL | 2.0 | 2.0 | 1503 | $2,800 | $1.86 | 25d | 1 | 0.48mi |
| 274 Riverwood Rd Unit 1546056P Naples, FL | 2.0 | 2.0 | 1496 | $4,451 | $2.98 | 15d | 1 | 0.49mi |
| 847 Enbrook Loop Naples, FL | 2.0 | 2.0 | 1503 | $2,950 | $1.96 | 25d | 1 | 0.50mi |
| 2244 Yellowfin Cir Naples, FL | 3.0 | 2.0 | 1655 | $3,300 | $1.99 | 15d | 1 | 0.51mi |
| 1078 Rolling Brook Ln Naples, FL | 2.0 | 2.0 | 1503 | $2,750 | $1.83 | 22d | 1 | 0.52mi |
| 1747 Beverly Dr Naples, FL | 2.0 | 2.0 | 1080 | $2,300 | $2.13 | 25d | 1 | 0.59mi |
| 2000 Rookery Bay Dr Naples, FL | 1.0–3.0 | 1.0–2.0 | 929 | $1,772 | $1.91 | 25d | 9 | 0.64mi |
| 6767 Pennyroyal Dr Naples, FL | 3.0 | 2.0 | 2185 | $10,500 | $4.81 | 25d | 1 | 0.77mi |
| 158 Rookery Rd Naples, FL | 3.0 | 2.0 | 1456 | $2,450 | $1.68 | 25d | 1 | 0.77mi |
| 9243 Tesoro Ln Unit 2 Naples, FL | 3.0 | 3.0 | 2100 | $6,500 | $3.10 | 15d | 1 | 0.80mi |
| 9255 Museo #103 Naples, FL | 3.0 | 3.0 | 2100 | $9,000 | $4.29 | 25d | 1 | 0.81mi |
| 9242 Tesoro Ln Unit 1-102 Naples, FL | 3.0 | 3.0 | 2237 | $3,000 | $1.34 | 25d | 1 | 0.83mi |
| 9267 Museo Cir Unit 204 Naples, FL | 3.0 | 3.5 | 2100 | $5,200 | $2.48 | 25d | 1 | 0.86mi |
| 9259 Museo Cir #102 Naples, FL | 3.0 | 3.0 | 2100 | $4,150 | $1.98 | 25d | 1 | 0.91mi |
| 3955 Deer Crossing Ct #103 Naples, FL | 3.0 | 2.0 | 1812 | $7,500 | $4.14 | 25d | 1 | 0.99mi |
| 3975 Deer Crossing Ct #201 Naples, FL | 3.0 | 2.0 | 2101 | $7,500 | $3.57 | 25d | 1 | 0.99mi |
| 3985 Deer Crossing Ct #201 Naples, FL | 3.0 | 2.0 | 1981 | $5,795 | $2.93 | 25d | 1 | 1.00mi |
| 9571 Mussorie Ct Naples, FL | 3.0 | 3.5 | 2117 | $12,500 | $5.90 | 25d | 1 | 1.03mi |
| 3940 Deer Crossing Ct Unit 4-203 Naples, FL | 3.0 | 2.0 | 2166 | $7,500 | $3.46 | 25d | 1 | 1.04mi |
| 14214 Manchester Dr Naples, FL | 3.0 | 2.0 | 1560 | $2,700 | $1.73 | 22d | 1 | 1.04mi |
| 14214 Manchester Dr Naples, FL | 3.0 | 2.0 | 1560 | $2,800 | $1.79 | 25d | 1 | 1.04mi |
| 3930 Deer Crossing Ct #103 Naples, FL | 3.0 | 2.0 | 1950 | $2,530 | $1.30 | 15d | 1 | 1.05mi |
| 6680 Beach Resort Dr Unit 1214 Naples, FL | 2.0 | 2.0 | 1351 | $4,500 | $3.33 | 15d | 1 | 1.06mi |
| 6750 Beach Resort Dr Naples, FL | 2.0 | 2.0 | 1351 | $3,200 | $2.37 | 15d | 2 | 1.09mi |
| 6750 Beach Resort Dr #7 Naples, FL | 2.0 | 2.0 | 1351 | $3,900 | $2.89 | 25d | 1 | 1.09mi |
| 4685 Hawks Nest Way #103 Naples, FL | 2.0 | 2.0 | 1440 | $6,500 | $4.51 | 15d | 1 | 1.09mi |
| 4529 Cardinal Cove Ln #7 Naples, FL | 2.0 | 2.0 | 1539 | $6,500 | $4.22 | 25d | 1 | 1.10mi |
| 4680 Hawks Nest Way Unit D-103 Naples, FL | 2.0 | 2.0 | 1414 | $3,000 | $2.12 | 15d | 1 | 1.15mi |
| 6650 Beach Resort Dr Unit 908 Naples, FL | 2.0 | 2.0 | 1351 | $4,600 | $3.40 | 15d | 1 | 1.19mi |
| 4650 Hawks Nest Way Unit M202 Naples, FL | 3.0 | 2.0 | 1840 | $9,600 | $5.22 | 15d | 1 | 1.20mi |
| 14678 Fern Lake Ct Unit 1049694P Naples, FL | 3.0 | 2.0 | 2142 | $6,065 | $2.83 | 15d | 1 | 1.27mi |
| 14796 Canton Ct Naples, FL | 3.0 | 2.0 | 1677 | $7,000 | $4.17 | 25d | 1 | 1.28mi |
| 14103 Nautica Ct Naples, FL | 3.0 | 2.5 | 1850 | $3,650 | $1.97 | 25d | 1 | 1.33mi |
Listing history 12 events
-
2026-06-18days on market $175,900 Active 370 DOM
-
2026-06-17days on market $175,900 Active 369 DOM
-
2026-06-16days on market $175,900 Active 368 DOM
-
2026-06-15days on market $175,900 Active 367 DOM
-
2026-06-10days on market $175,900 Active 362 DOM
-
2026-06-09days on market $175,900 Active 361 DOM
-
2026-06-08days on market $175,900 Active 360 DOM
-
2026-06-07days on market $175,900 Active 359 DOM
-
2026-06-02days on market $175,900 Active 354 DOM
-
2026-06-01days on market $175,900 Active 353 DOM
-
2026-05-31days on market $175,900 Active 352 DOM
-
2026-05-30days on market $175,900 Active 351 DOM
ⓘ Source: listings_history table (triggers on properties + properties_extension) + one-shot
backfill from property_details.listing_events for pre-trigger history.
Climate risk First Street
- Flood 8/10 Severe FEMA zone AE · 99% chance over 30 yrs
- Wildfire 4/10 Moderate
- Heat 10/10 Extreme 8 d/yr ≥108°F today · 32 d/yr by 30 yrs out
- Wind 10/10 Extreme 99% chance of damaging wind over 30 yrs
- Air quality 3/10 Moderate 3 unhealthy d/yr today · 3 by 30 yrs out
Nearby sold comps map
Loading sold comps map…
Walkable amenities ~0.75 mi
Loading nearby amenities…
Taxation est. · year 1
- Rental income
- $50,820
- − Mortgage interest
- −$9,853
- − Property taxes
- −$2,638
- − Insurance
- −$5,998
- − Repairs & maintenance
- −$4,066
- − Management
- −$4,066
- − Depreciation
- −$5,117
- Taxable income
- $19,082
- Est. tax owed @ 24.0%
- −$4,580
- After-tax cash flow
- $15,862/yr
For passive investors: Depreciation is non-cash, so a rental often shows a tax loss while cash-flowing — sheltering income. Rental losses are passive: they offset passive income freely, and up to $25,000/yr can offset ordinary (W-2) income if you actively participate and your MAGI is under $100k (phasing out to $0 by $150k); unused losses carry forward. On sale, claimed depreciation is recaptured at up to 25%, and gains may owe capital-gains tax (a 1031 exchange can defer both). Figures are a year-1 estimate at your 24.0% rate — not tax advice; consult a CPA.
Schools (NCES district)
- District
- Collier
- NCES district ID
- 1200330
- Math proficiency
- 60% ▼ -4.00%
- Reading proficiency
- 56% ▼ -2.00%
- Median HH income
- $58,275
- Composite
- 50.23/100
- National rank
- #1892
- State rank
- #16 of 73 in FL
Livability — Winding Cypress
No livability data for this city. (Only ~50 U.S. cities are tracked.)
Census & demographics
- County
- Collier County · 396,295 people
- Metro
- Naples-Marco Island, FL
- Population (ZIP)
- 23,559
- Household income
- $89,334
- Rent vs Own
- Severe rent burden
- 550.0
Population outlook (Collier County) Hauer SSP2
- Today (2025)
- 420,858 people
- By 2030
- 450,054 · +6.9%
- By 2040
- 502,232 · +19.3%
- By 2050
- 544,932 · +29.5%
- By 2075
- 627,203 · +49.0%
- By 2100
- 659,015 · +56.6%
Race, ethnicity, and origin ACS 2023
- Neighborhood character
- Predominantly White (72%)
- Race & ethnicity
- White 72% Hispanic / Latino 17% Two or more races 13% Black 7%
- Hispanic origin (detail)
- Mexican 7% Puerto Rican 1% Cuban 3%
- Common ancestry
- Hispanic 5% Romanian 4% Lithuanian 1%
- Foreign-born
- 21% · Canada, Jamaica
- Languages at home
- 75% English-only · Spanish 15% French/Haitian/Cajun 5% Other Indo-European 4%
Political lean MEDSL · Collier
- 2024 margin
- Solid R (+33.1) · D 33.1% · R 66.2%
- 2008→2024 swing
- -10.6pp toward R · 2008: -22.5pp · 2024: -33.1pp
- All cycles
- 2024: R+33.1 2020: R+24.7 2016: R+26.0 2012: R+30.1 2008: R+22.5
Not yet ingested
- Civics
- —
Market trends
- HPI YoY
- ▼ -1.48%
- Current HPI
- 266.5545
- Rent YoY
- ▲ 3.21%
- Metro
- Naples-Marco Island, FL
- State GDP YoY
- ▲ 3.28%
- F500 in state
- 36
Industry mix (Fortune 500 HQ in FL)
| Industry | F500 HQs | Revenue |
|---|---|---|
| Industrial Technology | 2 | $29B |
|
||
| Insurance | 2 | $17B |
|
||
| Retail | 1 | $60B |
|
||
| Technology Distribution | 1 | $58B |
|
||
| Homebuilding | 1 | $35B |
|
||
| Technology Manufacturing | 1 | $35B |
|
||
Cash-flow waterfall
monthlySold comps — $/sqft
last 12 mo · ≤1 miLoading sold comps…