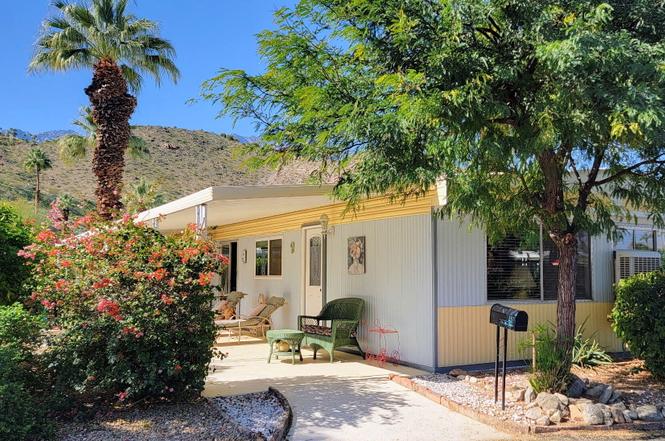
257 Del Mar · Palm Springs, CA
Flood risk 1/10 · Minimal
- FEMA flood zone
- X (unshaded)
- Chance of flooding over 30 yrs
- 0.0%
- Est. flood insurance / yr
- $507 – $1,088
Fire risk 4/10 · Minor
- Est. fire insurance / yr
- $659 – $1,223
Heat risk 9/10 · Severe
- Hot days now (above 112°F)
- 8 days/yr
- Hot days in 30 yrs
- 24 days/yr
Wind risk 1/10 · Minimal
- Chance of severe wind over 30 yrs
- —
Air-quality risk 5/10 · Moderate
- Unhealthy air days now
- 6 days/yr
- Unhealthy air days in 30 yrs
- 8 days/yr
Risk factors via First Street. Map © Google.
Why this score? — see what drove the B grade
The composite is a weighted blend of 9 inputs, each scored 0–100. Each bar is that input's sub-score; the figure is the points it added to the 100-point composite (weight × sub-score).
- Cash flow +30.0/30.0
- 1% rule +10.0/10.0
- DSCR +10.0/10.0
- ARV discount +8.2/15.0
- Condition / age +3.8/5.0
- Livability +3.3/5.0
- Schools +2.7/10.0
- Rent growth +2.4/5.0
- Appreciation +0.0/10.0
$129,900
🖨 Deal sheet (PDF) 📄 Offer letter ✓ Due diligence
Listing remarks
Lots of charm 2BD/2BA home located on a desirable corner lot in Safari Mobile Park, a gated 55+ community in Palm Springs. Built in 1968, this home features a spacious side porch with scenic neighborhood and hillside views. 2 Car carport. In suite bathroom in primary. Enjoy a prime location with sight-lines toward iconic Palm Springs landmarks, including the area of Bob Hope's former estate and the Elrod House, featured in the 1971 James Bond film Diamonds Are Forever. Conveniently located near shopping, dining, and downtown Palm Springs. Recreational Facilities: Features a heated community pool, spa, and a clubhouse that includes a library, game room, and billiard tables. Outdoor Activitie
Key facts
- Gated community
- Spacious side porch
- Prime location
Tags
Property features AI
Finance
- Other: Furniture negotiable; Park manager: Christina Sanders, phone 760-328-1108; Park type: Senior; 2 spaces in the park assigned to unit; Mobile home length: 60 ft
- Financial info: Land is leasehold with annual land lease (listed amount available); Land lease expiration year 2038; Sale terms: Cash; Short-term rentals not allowed; Will not consider lease
- HOA & community: No monthly association fee; Senior community (Safari Park, park manager approval required)
Exterior
- Parking: Attached carport; 2 covered/assigned spaces; 2 carport spaces; 6 total parking spaces
- Security: Community security
- Utilities: Sewer: Unknown
- Home design: Detached double-wide mobile home; Single story (ground level, no unit above); Entry at ground level
- Construction: Manufactured home (built 1968, Casa Loma model, manufactured by Vegas); Double wide
- Exterior features: Corner lot; Mountain view; Community security
Interior
- Kitchen: Refrigerator; Microwave; Gas oven; Gas cooktop; Dishwasher
- Flooring: Laminate flooring
- Bathrooms: 2 full bathrooms
- Heating & cooling: Baseboard heating; Air conditioning
- Interior features: Unfurnished; Dining area; Living room; Breakfast room
- Laundry & utility: Washer; Dryer
Neighborhood map
What this means for you Summary
Snapshot
- This is a 2-bed/2.0-bath manufactured listed at $130k. Condition is rated good.
Deal economics
- At list price, monthly cash flow is $1k ($15k/yr) — positive.
- The deal already cash-flows at list — no discount required.
- Meets the 1% rule at list price ($3k rent vs $130k).
- Recommended offer: $118k (9.0% below list) — sets the bar for market timing.
- Cap rate 17.9% vs local median 2.7% in Palm Springs — top-decile yield for the area; either an underpriced asset or a hidden risk that comps aren't pricing in. Stress-test before assuming the spread holds.
Location & tenants
- Location reads 66/100 on livability (#348 in CA) — a middle-class / working-renter tenant base. Strengths: amenities A+, commute A+; Watch: crime F, cost of living F, health & safety F.
- Palm Springs Unified (suburban): math 21% / reading 42% proficiency, ranked #328 of 517 in CA (top 63%) — families likely to look elsewhere, expect single-tenant / working-renter base with shorter leases; 73% free/reduced lunch — lower-income household profile, screen leases tightly.
- Zoned schools: Cahuilla Elementary (421 students, 93% FRL); Raymond Cree Middle (708 students, 98% FRL); Palm Springs High (math 30% / reading 51%, grade F, #508 of 1,170 statewide, top 44%, 1,584 students, 97% FRL) — zoned schools average 96% FRL vs 73% district-wide (22 pts higher); higher-poverty schools than district average — tighter screening recommended.
- Market conditions: Rents soft (-0.4%/yr); 498 active listings in the ZIP; 25 comparable units currently listed for rent nearby; rentals at typical pace (median 26d on market — plan ~3-4 weeks tenant-placement turnaround); 40% of comp listings sitting > 30 days — soft ceiling on asking rent; solid renter incomes; 9,195 units permitted in Riverside County in 2024 (1,512 in 5+ unit buildings).
- This rent runs 42% of the median local income ($78k/yr) — at the standard rent-burdened threshold; future hikes will face affordability resistance.
Forward outlook
- Local home prices are declining (-3.0%/yr); year-one equity from $898 of loan paydown is wiped out by about $4k of value loss. Plan a longer hold.
- Riverside County population projected at +22% by 2050 — long-run rental-demand tailwind backs the buy-and-hold thesis.
- At projected returns (-3.0% appreciation + 0.0% rent growth), your $36k cash investment doubles in ~3 years — after that, you're playing with house money.
Negotiation context
- It's been on market 105 days — a 9% lower offer ($118k) is reasonable based on typical stale-listing flexibility.
Risks & watch-outs
- Climate carrying-cost: extreme-heat days projected 8→24/yr by 2055 (HVAC capex compounding) — expect insurance premiums to compound above CPI over the hold.
Questions for the listing agent
- It's been on market 105 days. Have you received any prior offers? Is the seller open to a 9% concession, seller financing, or rate buy-down credit?
- Built in 1968 — when were the roof, HVAC, electrical panel, plumbing, and water heater last replaced?
- Why hasn't it sold? Are there any deal-killer items the seller is aware of (foundation, flood, title, zoning, code violations)?
- Is there a deadline driving the sale (1031 exchange, divorce, estate, relocation)? That informs how much negotiation room exists.
- Crime grade is F in this area — have there been break-ins, vandalism, or insurance claims at this property in the last 3 years? What carrier currently insures it and at what premium?
- What's the average days-on-market for RENTAL listings here right now (not sales)? A rising rental-DOM trend means longer vacancies and softer asking-rent achievability than the comps imply.
- What's the recent tenant-quality profile in this submarket — average credit score on applications, eviction rate, late-payment / NSF rate, and stable-employment percentage? A property-management company in the area should have these aggregated.
- How much new for-sale + rental construction is in the pipeline within 1–3 miles? Heavy new supply typically softens prices + rents 12–24 months out; constrained supply supports both.
Investment metrics
- 1% rule
- 2.10% ✓
- Cap rate
- 17.92%
- Cash-on-cash
- 41.54%
- DSCR
- 2.85
- GRM
- 4.0
CMA / ARV
- ARV (on-the-fly)
- $132,000
- Comps found
- 10
Show comp detail 10 sales within ~0.75 mi
| Address | Dist | Beds/Ba | Sqft | Sold | Price | $/sf | Match |
|---|---|---|---|---|---|---|---|
| 257 Del Mar | 0.00mi | 2/2.0 | 1,200 (0%) | 1mo | $125,000 | $104 | 99 |
| 226 Newport Dr | 0.06mi | 2/2.0 | 1,200 (0%) | 18mo | $111,000 | $93 | 82 |
| 41 Santa Ana St | 0.14mi | 2/2.0 | 1,248 (+4%) | 9mo | $130,000 | $104 | 80 |
| 147 Camarillo St | 0.13mi | 2/2.0 | 1,100 (-8%) | 2mo | $58,000 | $53 | 79 |
| 235 Newport | 0.02mi | 2/2.0 | 1,080 (-10%) | 13mo | $125,000 | $116 | 71 |
| 7 Carmel | 0.15mi | 2/2.0 | 1,120 (-7%) | 15mo | $143,000 | $128 | 69 |
| 144 Jupiter St | 0.27mi | 2/2.0 | 1,152 (-4%) | 20mo | $225,000 | $195 | 64 |
| 179 Balboa | 0.08mi | 2/2.0 | 1,060 (-12%) | 16mo | $215,000 | $203 | 64 |
| 86 Santa Monica St | 0.10mi | 2/2.0 | 1,070 (-11%) | 22mo | $118,000 | $110 | 59 |
| 186 Vega | 0.22mi | 2/3.0 | 1,320 (+10%) | 19mo | $80,000 | $61 | 54 |
Match score weights: distance 35% · size 25% · config 20% · recency 20%. Top-matched comps best support the ARV.
Projected returns pro-forma
-3.0% appreciation · 0.0% rent growth · sell at horizon
- IRR
- 34.7%
- Equity multiple
- 2.41×
- Total profit
- $51,180
- Equity at exit
- $19,369
- IRR
- 39.9%
- Equity multiple
- 4.22×
- Total profit
- $117,070
- Equity at exit
- $11,231
Cash invested: $36,372 (down + closing). Projections, not guarantees.
Landlord ↔ Tenant lean methodology
- Overall (STATE)
- 18 Strongly Tenant-Friendly
- State California
- 18 Strongly Tenant-Friendly · D+13
- County
- — inherits STATE
- City
- — inherits STATE
ZIP-level market 92264
- Rents YoY
- -0.4%
- Active inventory
- 498
- Price-to-rent
- 4.0×
Monthly cashflow live
- Estimated rent
- $2,730 high interval (Pro) →
- Mortgage (P&I)
- −$681
- Tax est. 1.5%
- −$162 /mo · $1,948/yr
- Insurance
- −$54
- HOA
- −$0
- Vacancy / Maint / Mgmt
- −$573
- Net cashflow
- $1,259
Break-even live
Sensitivity live
| Price | -10% $1,349 | -5% $1,304 | +0% $1,259 | +5% $1,214 | +10% $1,169 |
|---|---|---|---|---|---|
| Rent | -10% $1,043 | -5% $1,151 | +0% $1,259 | +5% $1,367 | +10% $1,475 |
| Rate | -1.0pp $1,324 | -0.5pp $1,292 | base $1,259 | +0.5pp $1,225 | +1.0pp $1,191 |
UW: 25.0% down · 7.5% · 30yr · 1.5% tax · 5.0% vac · 8.0% maint · 8.0% mgmt
Financing live
Cash to close
- Down payment
- $32,475
- Closing costs
- $3,897
- Reserves months
- —
- Total cash needed
- —
Loan-product check · same deal, 3 products live
Conventional
25% down · 7.5% · 30yr
- Down + closing
- —
- Monthly P&I
- —
- Monthly cashflow
- —
- DSCR
- —
- Eligible?
- —
Personal DTI + credit; lowest rate.
DSCR
20% down · 8.5% · 30yr
- Down + closing
- —
- Monthly P&I
- —
- Monthly cashflow
- —
- DSCR
- —
- Eligible?
- —
No personal income docs; deal must DSCR.
Hard money
10% down · 12.0% · 12mo
- Down + closing
- —
- Monthly P&I
- —
- Monthly cashflow
- —
- DSCR
- —
- Eligible?
- —
Short-term bridge; refi at stabilization.
Rent comps 25 comps
| Address | Beds | Baths | Sqft | Rent | $/sqft | DOM | Units | Dist |
|---|---|---|---|---|---|---|---|---|
| 2391 Mira Monte Cir W Palm Springs, CA | 2.0 | 2.0 | 1180 | $2,850 | $2.42 | 45d | 1 | 0.40mi |
| 2350 Miramonte Cir E Unit E Palm Springs, CA | 2.0 | 2.0 | 1241 | $4,500 | $3.63 | 45d | 1 | 0.44mi |
| 2350 Miramonte Cir E Unit A Palm Springs, CA | 2.0 | 2.0 | 1264 | $3,000 | $2.37 | 26d | 1 | 0.44mi |
| 2550 Miramonte Cir E Unit C Palm Springs, CA | 3.0 | 2.5 | 1397 | $2,730 | $1.95 | 26d | 1 | 0.48mi |
| 2601 S Broadmoor Dr Palm Springs, CA | 2.0 | 2.0 | 1178 | $2,050 | $1.74 | 45d | 2 | 0.63mi |
| 2441 S Birdie Way Unit E Palm Springs, CA | 2.0 | 2.0 | 1438 | $3,250 | $2.26 | 26d | 1 | 0.67mi |
| 4850 N Winners Cir Unit A Palm Springs, CA | 2.0 | 2.0 | 1275 | $2,700 | $2.12 | 18d | 1 | 0.70mi |
| 1700 S Araby Dr Palm Springs, CA | 1.0–2.0 | 1.0–2.0 | 871 | $2,682 | $3.08 | 0d | 5 | 0.72mi |
| 2104 S Birdie Way Palm Springs, CA | 3.0 | 2.0 | 1456 | $3,600 | $2.47 | 45d | 1 | 0.77mi |
| 5225 E Waverly Dr #66 Palm Springs, CA | 1.0 | 2.0 | 887 | $3,600 | $4.06 | 45d | 1 | 0.79mi |
| 5300 E Waverly Dr Unit C4 Palm Springs, CA | 2.0 | 1.5 | 768 | $1,900 | $2.47 | 4d | 1 | 0.87mi |
| 5301 E Waverly Dr #120 Palm Springs, CA | 1.0 | 2.0 | 887 | $2,800 | $3.16 | 45d | 1 | 0.91mi |
| 5301 E Waverly Dr #192 Palm Springs, CA | 2.0 | 2.0 | 979 | $2,300 | $2.35 | 26d | 1 | 0.91mi |
| 5300 E Waverly Dr Palm Springs, CA | 1.0–2.0 | 1.5–2.0 | 768 | $1,900 | $2.47 | 26d | 2 | 0.95mi |
| 5301 E Waverly Dr Palm Springs, CA | 1.0–2.0 | 2.0 | 933 | $2,300 | $2.47 | 16d | 2 | 0.99mi |
| 5301 E Waverly Dr Palm Springs, CA | 1.0–2.0 | 2.0 | 933 | $2,300 | $2.47 | 20d | 2 | 0.99mi |
| 2800 Lawrence Crossley Rd Palm Springs, CA | 2.0 | 2.0 | 905 | $2,022 | $2.23 | 45d | 1 | 1.08mi |
| 2700 Lawrence Crossley Rd #18 Palm Springs, CA | 2.0 | 2.0 | 885 | $2,050 | $2.32 | 20d | 1 | 1.10mi |
| 2700 Lawrence Crossley Rd Unit B15 Palm Springs, CA | 2.0 | 2.0 | 885 | $1,950 | $2.20 | 45d | 1 | 1.10mi |
| 26 Pueblo Vista Dr Palm Springs, CA | 3.0 | 2.0 | 1487 | $3,200 | $2.15 | 45d | 1 | 1.31mi |
| 2701 E Mesquite Ave Palm Springs, CA | 2.0 | 2.0 | 1175 | $2,982 | $2.54 | 26d | 5 | 1.32mi |
| 2701 E Mesquite Ave Palm Springs, CA | 2.0 | 2.0 | 1175 | $3,435 | $2.92 | 22d | 4 | 1.32mi |
| 2701 E Mesquite Ave Palm Springs, CA | 2.0 | 2.0 | 1175 | $2,898 | $2.47 | 16d | 4 | 1.32mi |
| 2700 E Mesquite Ave Palm Springs, CA | 2.0 | 2.0 | 1175 | $3,025 | $2.57 | 45d | 2 | 1.35mi |
| 2010 Lawrence Crossley Rd Unit 8 Palm Springs, CA | 2.0 | 1.5 | 993 | $1,895 | $1.91 | 15d | 1 | 1.40mi |
Listing history 3 events
-
2026-05-19status Pending
-
2026-04-01historical Active Under Contract
-
2026-02-03$129,900 Active
ⓘ Source: listings_history table (triggers on properties + properties_extension) + one-shot
backfill from property_details.listing_events for pre-trigger history.
Climate risk First Street
- Flood 1/10 Low FEMA zone X (unshaded) · 0% chance over 30 yrs
- Wildfire 4/10 Moderate
- Heat 9/10 Extreme 8 d/yr ≥112°F today · 24 d/yr by 30 yrs out
- Wind 1/10 Low
- Air quality 5/10 Major 6 unhealthy d/yr today · 8 by 30 yrs out
Nearby sold comps map
Loading sold comps map…
Walkable amenities ~0.75 mi
Loading nearby amenities…
Taxation est. · year 1
- Rental income
- $32,761
- − Mortgage interest
- −$7,276
- − Property taxes
- −$1,948
- − Insurance
- −$650
- − Repairs & maintenance
- −$2,621
- − Management
- −$2,621
- − Depreciation
- −$3,779
- Taxable income
- $13,866
- Est. tax owed @ 24.0%
- −$3,328
- After-tax cash flow
- $11,781/yr
For passive investors: Depreciation is non-cash, so a rental often shows a tax loss while cash-flowing — sheltering income. Rental losses are passive: they offset passive income freely, and up to $25,000/yr can offset ordinary (W-2) income if you actively participate and your MAGI is under $100k (phasing out to $0 by $150k); unused losses carry forward. On sale, claimed depreciation is recaptured at up to 25%, and gains may owe capital-gains tax (a 1031 exchange can defer both). Figures are a year-1 estimate at your 24.0% rate — not tax advice; consult a CPA.
Condition & rehab AI · 13 photos
This 2BR/2BA home in Palm Springs is in good condition with a good curb appeal and well-maintained interior. A fresh coat of paint and some landscaping enhancements would significantly boost its resale and rental value.
Repairs flagged
- Minor Paint Touch-Up — The kitchen cabinets and walls could benefit from a fresh coat of paint.
Value-add opportunities
- Resale Paint the kitchen cabinets and walls — Fresh paint can make the kitchen appear more modern and appealing to potential buyers.
- Both Landscaping enhancement — Enhancing the landscaping can improve curb appeal and add value to the property.
Renovation cost estimate screening
| Repair item | Severity | Est. cost |
|---|---|---|
| Paint Touch-Up · The kitchen cabinets and walls could benefit from a fresh coat of paint. | Minor | $500–3,000 |
| Total estimated repair cost · 1 items | $500–3,000 |
Value-add ROI direction
- Resale Paint the kitchen cabinets and walls — Fresh paint can make the kitchen appear more modern and appealing to potential buyers. ↑
- Both Landscaping enhancement — Enhancing the landscaping can improve curb appeal and add value to the property. ↑
ⓘ Cost ranges are severity-bucket heuristics (US national rule-of-thumb). Get contractor quotes + a written scope before underwriting a rehab budget.
Schools (NCES district)
- District
- Palm Springs Unified
- NCES district ID
- 0629550
- Math proficiency
- 21% ▼ -7.00%
- Reading proficiency
- 42% ▬ 0.00%
- Median HH income
- $43,638
- Composite
- 26.76/100
- National rank
- #7131
- State rank
- #328 of 517 in CA
Livability — Palm Springs
- Score
- 66/100
- State rank
- #348
- US rank
- #11850
Category grades
Schools grade is shown separately in the Schools card above.
Census & demographics
- Census place
- Palm Springs, CA
- County
- Riverside County · 2,287,001 people
- City population
- 46,786
- Metro
- Riverside-San Bernardino-Ontario, CA
- Population (ZIP)
- 19,899
- Household income
- $77,688
- Rent vs Own
- Severe rent burden
- 1215.0
Population outlook (Riverside County) Hauer SSP2
- Today (2025)
- 2,664,475 people
- By 2030
- 2,802,692 · +5.2%
- By 2040
- 3,050,904 · +14.5%
- By 2050
- 3,256,783 · +22.2%
- By 2075
- 3,655,058 · +37.2%
- By 2100
- 3,766,594 · +41.4%
Race, ethnicity, and origin ACS 2023
- Neighborhood character
- Predominantly White (68%)
- Race & ethnicity
- White 68% Hispanic / Latino 20% Two or more races 12% Asian 6% Black 2% Native American 1%
- Hispanic origin (detail)
- Mexican 16%
- Common ancestry
- Lithuanian 4% Romanian 3% Slovak 3%
- Foreign-born
- 16% · Canada, China, South Korea
- Languages at home
- 81% English-only · Spanish 13% Tagalog/Filipino 2% Other Asian/Pacific 1%
Political lean MEDSL · Riverside
- 2024 margin
- Toss-up / Even · D 48.0% · R 49.3% · Other 2.6%
- 2008→2024 swing
- -3.6pp toward R · 2008: 2.3pp · 2024: -1.3pp
- All cycles
- 2024: R+1.3 2020: D+8.0 2016: D+4.3 2012: R+0.4 2008: D+2.3
Not yet ingested
- Civics
- —
Market trends
- HPI YoY
- ▼ -489.04%
- Current HPI
- 357.0969
- Rent YoY
- ▼ -0.43%
- Metro
- Riverside-San Bernardino-Ontario, CA
- State GDP YoY
- ▲ 3.21%
- F500 in state
- 116
Industry mix (Fortune 500 HQ in CA)
| Industry | F500 HQs | Revenue |
|---|---|---|
| Technology | 27 | $1,492B |
|
||
| Financial Services | 3 | $174B |
|
||
| Retail | 3 | $44B |
|
||
| Insurance | 3 | $26B |
|
||
| Media / Entertainment | 2 | $115B |
|
||
| Pharmaceuticals / Biotech | 2 | $62B |
|
||
Price history
3 events — show timeline
- 2026-05-19 Pending — GPSMLS
- 2026-04-01 Contingent — GPSMLS
- 2026-02-03 Listed $129,900 GPSMLS
Cash-flow waterfall
monthlySold comps — $/sqft
last 12 mo · ≤1 miLoading sold comps…