827 W Valley Hwy #27 · Kent, WA
Flood risk 5/10 · Moderate
- FEMA flood zone
- X (unshaded)
- Chance of flooding over 30 yrs
- 0.27%
- Est. flood insurance / yr
- $507 – $1,088
Fire risk 1/10 · Minimal
- Est. fire insurance / yr
- $604 – $1,122
Heat risk 3/10 · Minor
- Hot days now (above 88°F)
- 7 days/yr
- Hot days in 30 yrs
- 14 days/yr
Wind risk 1/10 · Minimal
- Chance of severe wind over 30 yrs
- —
Air-quality risk 8/10 · Major
- Unhealthy air days now
- 12 days/yr
- Unhealthy air days in 30 yrs
- 12 days/yr
Risk factors via First Street. Map © Google.
Why this score? — see what drove the B+ grade
The composite is a weighted blend of 9 inputs, each scored 0–100. Each bar is that input's sub-score; the figure is the points it added to the 100-point composite (weight × sub-score).
- Cash flow +30.0/30.0
- ARV discount +13.1/15.0
- 1% rule +10.0/10.0
- DSCR +10.0/10.0
- Schools +4.8/10.0
- Livability +4.0/5.0
- Condition / age +3.8/5.0
- Rent growth +2.3/5.0
- Appreciation +0.0/10.0
$69,999
🖨 Deal sheet (PDF) 📄 Offer letter ✓ Due diligence
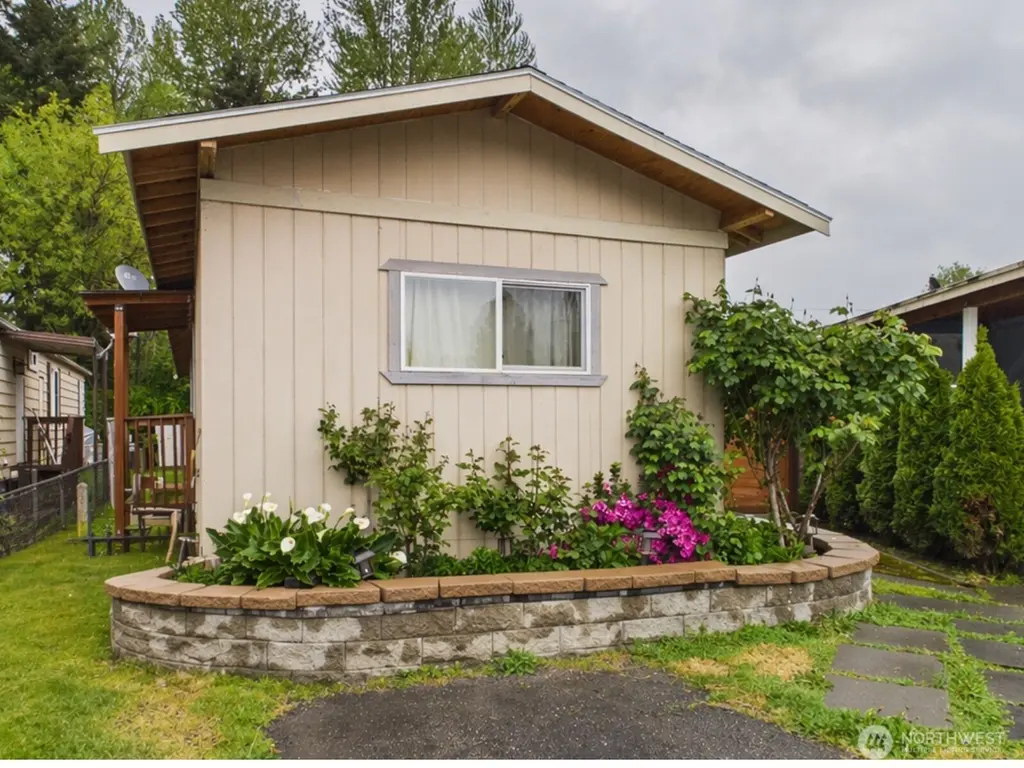
Listing remarks
Charming and thoughtfully updated single-wide manufactured home offering comfort, value, and peace of mind! This 2-bedroom home features 1 full bath and an additional 3/4 bath, with durable laminate flooring throughout for easy living and low maintenance. Enjoy the benefits of major recent updates, including a brand new roof, new water heater, new furnace, and new siding, providing confidence for years to come. The kitchen is equipped with a new gas stove, perfect for everyday cooking and gathering. Step outside to a newer deck, an ideal space to relax, enjoy your morning coffee. Located in a well-maintained community, this home offers an affordable opportunity with many big-ticket items al
Key facts
- New furnace
- New siding
- New water heater
Tags
Property features AI
Finance
- Other: Buyer to verify school information
- Financial info: Listing terms: Cash, Conventional
- HOA & community: Located in Circle K MHP (manufactured home park approved for sale); Land lease: $1,244
Exterior
- Parking: Open/uncovered parking; 1 open parking space
- Utilities: Electric and natural gas service; Community water; Electric water heater
- Home design: Manufactured single-wide home; One story; Good condition; Tie-down foundation
- Construction: Metal/vinyl construction materials; Composition roof; Manufactured house (VILAW make)
- Exterior features: Metal/vinyl exterior; Located on a cul-de-sac; Paved access
Interior
- Kitchen: Kitchen with eating space; Dishwasher; Stove/Range; Refrigerator
- Bedrooms: 2 bedrooms
- Flooring: Laminate
- Bathrooms: 1 full bath; 1 three-quarter bath
- Heating & cooling: Forced air heating; No central cooling
- Interior features: Water heater; Bath off primary; Double-pane windows
- Laundry & utility: Washer; Dryer; Storage on back side (1 storage)
Neighborhood map
What this means for you Summary
Snapshot
- This is a 2-bed/2.0-bath manufactured listed at $70k. Condition is rated good.
Deal economics
- At list price, monthly cash flow is $1k ($14k/yr) — positive.
- The deal already cash-flows at list — no discount required.
- Meets the 1% rule at list price ($2k rent vs $70k).
- Recommended offer: $68k (3.0% below list) — sets the bar for market timing.
- Cap rate 25.8% vs local median 2.6% in Kent — top-decile yield for the area; either an underpriced asset or a hidden risk that comps aren't pricing in. Stress-test before assuming the spread holds.
Location & tenants
- Location reads 79/100 on livability (#109 in WA, #2,154 nationally) — a middle-class / working-renter tenant base. Strengths: amenities A+, commute A+, housing A+; Watch: crime F, cost of living F.
- Kent School District (urban): math 47% / reading 57% proficiency, ranked #109 of 291 in WA (top 38%) — acceptable for families but not a draw, mixed tenant base, ~2y average lease.
- Zoned schools: Neely O Brien Elementary School (538 students, 76% FRL); Mill Creek Middle School (794 students, 83% FRL); Kent-Meridian High School (2,128 students, 77% FRL) — zoned schools average 78% FRL vs 41% district-wide (38 pts higher); higher-poverty schools than district average — tighter screening recommended.
- Market conditions: Rents soft (-0.7%/yr); 127 active listings in the ZIP; 40 comparable units currently listed for rent nearby; rentals leasing fast (median 6d on market — plan ~1-2 weeks tenant-placement turnaround); solid renter incomes; 10,555 units permitted in King County in 2024 (7,119 in 5+ unit buildings).
Forward outlook
- Local home prices are declining (-3.0%/yr); year-one equity from $484 of loan paydown is wiped out by about $2k of value loss. Plan a longer hold.
- King County population projected at +44% by 2050 — long-run rental-demand tailwind backs the buy-and-hold thesis.
- At projected returns (-3.0% appreciation + 0.0% rent growth), your $20k cash investment doubles in ~2 years — after that, you're playing with house money.
Negotiation context
- It's been on market 58 days — a 3% lower offer ($68k) is reasonable based on typical stale-listing flexibility.
Risks & watch-outs
- Climate carrying-cost: moderate flood risk — expect insurance premiums to compound above CPI over the hold.
Questions for the listing agent
- It's been on market 58 days. Have you received any prior offers? Is the seller open to a 3% concession, seller financing, or rate buy-down credit?
- Built in 1973 — when were the roof, HVAC, electrical panel, plumbing, and water heater last replaced?
- Is there a deadline driving the sale (1031 exchange, divorce, estate, relocation)? That informs how much negotiation room exists.
- Crime grade is F in this area — have there been break-ins, vandalism, or insurance claims at this property in the last 3 years? What carrier currently insures it and at what premium?
- What's the average days-on-market for RENTAL listings here right now (not sales)? A rising rental-DOM trend means longer vacancies and softer asking-rent achievability than the comps imply.
- What's the recent tenant-quality profile in this submarket — average credit score on applications, eviction rate, late-payment / NSF rate, and stable-employment percentage? A property-management company in the area should have these aggregated.
- How much new for-sale + rental construction is in the pipeline within 1–3 miles? Heavy new supply typically softens prices + rents 12–24 months out; constrained supply supports both.
Investment metrics
- 1% rule
- 2.93% ✓
- Cap rate
- 25.78%
- Cash-on-cash
- 69.59%
- DSCR
- 4.10
- GRM
- 2.8
CMA / ARV
- ARV (on-the-fly)
- $79,968
- Comps found
- 1
Show comp detail 1 sale within ~0.75 mi
| Address | Dist | Beds/Ba | Sqft | Sold | Price | $/sf | Match |
|---|---|---|---|---|---|---|---|
| 827 W Valley Hwy #43 | 0.08mi | 2/2.0 | 880 (+12%) | 22mo | $90,000 | $102 | 57 |
Match score weights: distance 35% · size 25% · config 20% · recency 20%. Top-matched comps best support the ARV.
Projected returns pro-forma
-3.0% appreciation · 0.0% rent growth · sell at horizon
- IRR
- 65.7%
- Equity multiple
- 3.81×
- Total profit
- $55,069
- Equity at exit
- $10,437
- IRR
- 69.0%
- Equity multiple
- 7.02×
- Total profit
- $118,065
- Equity at exit
- $6,052
Cash invested: $19,600 (down + closing). Projections, not guarantees.
Landlord ↔ Tenant lean methodology
- Overall (STATE)
- 28 Tenant-Leaning
- State Washington
- 28 Tenant-Leaning · D+8
- County
- — inherits STATE
- City
- — inherits STATE
ZIP-level market 98032
- Rents YoY
- -0.7%
- Active inventory
- 127
- Price-to-rent
- 2.8×
Monthly cashflow live
- Estimated rent
- $2,051 high interval (Pro) →
- Mortgage (P&I)
- −$367
- Tax est. 1.5%
- −$87 /mo · $1,050/yr
- Insurance
- −$29
- HOA
- −$0
- Vacancy / Maint / Mgmt
- −$431
- Net cashflow
- $1,137
Break-even live
Sensitivity live
| Price | -10% $1,185 | -5% $1,161 | +0% $1,137 | +5% $1,112 | +10% $1,088 |
|---|---|---|---|---|---|
| Rent | -10% $975 | -5% $1,056 | +0% $1,137 | +5% $1,218 | +10% $1,299 |
| Rate | -1.0pp $1,172 | -0.5pp $1,154 | base $1,137 | +0.5pp $1,118 | +1.0pp $1,100 |
UW: 25.0% down · 7.5% · 30yr · 1.5% tax · 5.0% vac · 8.0% maint · 8.0% mgmt
Financing live
Cash to close
- Down payment
- $17,500
- Closing costs
- $2,100
- Reserves months
- —
- Total cash needed
- —
Loan-product check · same deal, 3 products live
Conventional
25% down · 7.5% · 30yr
- Down + closing
- —
- Monthly P&I
- —
- Monthly cashflow
- —
- DSCR
- —
- Eligible?
- —
Personal DTI + credit; lowest rate.
DSCR
20% down · 8.5% · 30yr
- Down + closing
- —
- Monthly P&I
- —
- Monthly cashflow
- —
- DSCR
- —
- Eligible?
- —
No personal income docs; deal must DSCR.
Hard money
10% down · 12.0% · 12mo
- Down + closing
- —
- Monthly P&I
- —
- Monthly cashflow
- —
- DSCR
- —
- Eligible?
- —
Short-term bridge; refi at stabilization.
Rent comps 40 comps
| Address | Beds | Baths | Sqft | Rent | $/sqft | DOM | Units | Dist |
|---|---|---|---|---|---|---|---|---|
| 1610 W James Pl Kent, WA | 2.0 | 1.0 | 682 | $1,816 | $2.66 | 0d | 21 | 0.26mi |
| 6305 S 238th Pl Kent, WA | 1.0–3.0 | 1.0–2.0 | 816 | $2,072 | $2.54 | 0d | 23 | 0.27mi |
| 23605 62nd Ave S Kent, WA | 1.0–3.0 | 1.0–2.0 | 833 | $2,196 | $2.64 | 0d | 9 | 0.28mi |
| 23529 60th Ave S Kent, WA | 1.0–3.0 | 1.0–2.0 | 1016 | $2,363 | $2.33 | 0d | 17 | 0.40mi |
| 6248 S 242nd Pl Kent, WA | 1.0–3.0 | 1.0–2.0 | 849 | $1,999 | $2.35 | 0d | 19 | 0.41mi |
| 24615 64th Ave S Kent, WA | 2.0 | 1.0–2.0 | 846 | $2,665 | $3.15 | 3d | 36 | 0.68mi |
| 24615 64th Ave S Kent, WA | 2.0 | 1.0–2.0 | 738 | $2,320 | $3.14 | 26d | 23 | 0.68mi |
| 102 Madison Ave N Kent, WA | 2.0 | 1.0–2.0 | 774 | $2,925 | $3.78 | 0d | 23 | 0.72mi |
| 23315 54th Ave S Unit 3-2 Kent, WA | 2.0 | 2.5 | 1063 | $2,800 | $2.63 | 6d | 1 | 0.73mi |
| 25102 62nd Ave S Kent, WA | 1.0–3.0 | 1.0–2.5 | 1000 | $2,207 | $2.21 | 0d | 21 | 0.81mi |
| 625 W Meeker St Kent, WA | 1.0–2.0 | 1.0 | 633 | $1,787 | $2.82 | 3d | 15 | 0.81mi |
| 443 Ramsay Way Kent, WA | 1.0–2.0 | 1.0–2.0 | 726 | $2,299 | $3.17 | 0d | 14 | 0.82mi |
| 850 2nd Ave N Kent, WA | 2.0 | 1.0 | 825 | $1,950 | $2.36 | 45d | 1 | 0.82mi |
| 839 1st Ave N Kent, WA | 1.0 | 1.0 | 810 | $1,650 | $2.04 | 22d | 1 | 0.86mi |
| 1001 1st Ave N Kent, WA | 1.0–2.0 | 1.0 | 683 | $1,599 | $2.34 | 6d | 20 | 0.86mi |
| 749 1st Ave N Kent, WA | 2.0 | 0.5 | 700 | $2,200 | $3.14 | 45d | 1 | 0.87mi |
| 2030 W Meeker St Kent, WA | 2.0 | 1.0–2.0 | 737 | $2,900 | $3.93 | 0d | 1 | 0.89mi |
| 420 W Smith St Kent, WA | 2.0 | 1.0–2.0 | 704 | $2,321 | $3.30 | 0d | 6 | 0.89mi |
| 412 E Novak Ln Kent, WA | 1.0–3.0 | 1.0–2.0 | 879 | $1,634 | $1.86 | 14d | 1 | 1.00mi |
| 220 W Meeker St Apt 7 Kent, WA | 1.0 | 1.0 | 700 | $1,395 | $1.99 | 45d | 1 | 1.01mi |
| 220 W Meeker St Apt 9 Kent, WA | 1.0 | 1.0 | 700 | $1,280 | $1.83 | 6d | 1 | 1.01mi |
| 525 Central Ave N Kent, WA | 2.0 | 1.0 | 780 | $2,500 | $3.21 | 45d | 1 | 1.02mi |
| 717 State Ave N Unit 4 Kent, WA | 2.0 | 1.0 | 787 | $1,500 | $1.91 | 45d | 1 | 1.04mi |
| 705 State Ave N #4 Kent, WA | 2.0 | 1.0 | 787 | $1,500 | $1.91 | 6d | 1 | 1.05mi |
| 401 3rd Ave S Unit Up L Kent, WA | 2.0 | 1.0 | 700 | $1,700 | $2.43 | 45d | 1 | 1.08mi |
| 419 Novak Ln Kent, WA | 1.0–2.0 | 1.0–2.0 | 912 | $3,014 | $3.30 | 0d | 21 | 1.09mi |
| 703 Woodford Ave N Apt 2 Kent, WA | 2.0 | 1.5 | 928 | $1,885 | $2.03 | 6d | 1 | 1.10mi |
| 703 Woodford Ave N Unit 2A Kent, WA | 2.0 | 1.5 | 928 | $1,885 | $2.03 | 6d | 1 | 1.10mi |
| 2200 W Meeker St Kent, WA | 3.0 | 1.0–2.0 | 837 | $2,711 | $3.24 | 0d | 18 | 1.10mi |
| 1020 Central Ave N Kent, WA | 1.0–3.0 | 1.0–2.0 | 1035 | $2,285 | $2.21 | 0d | 20 | 1.12mi |
| 622 6th Ave S Kent, WA | 3.0 | 2.0 | 1114 | $2,999 | $2.69 | 45d | 1 | 1.13mi |
| 707 6th Ave S Unit F103 Kent, WA | 2.0 | 1.5 | 979 | $1,700 | $1.74 | 45d | 1 | 1.19mi |
| 518 2nd Ave S Kent, WA | 2.0 | 1.0 | 630 | $1,550 | $2.46 | 26d | 1 | 1.19mi |
| 702 5th Ave S Unit T06 Kent, WA | 2.0 | 1.5 | 975 | $2,200 | $2.26 | 0d | 1 | 1.22mi |
| 702 5th Ave S Kent, WA | 2.0–3.0 | 1.5 | 1150 | $2,200 | $1.91 | 6d | 3 | 1.22mi |
| 1024 Central Ave N Kent, WA | 1.0–3.0 | 1.0–2.0 | 755 | $2,053 | $2.72 | 0d | 53 | 1.28mi |
| 724 2nd Ave S Kent, WA | 2.0 | 1.0 | 875 | $1,699 | $1.94 | 45d | 1 | 1.36mi |
| 4821 S Kent Des Moines Rd Kent, WA | 1.0 | 1.0 | 650 | $1,515 | $2.33 | 14d | 17 | 1.40mi |
| 106 Kensington Ave S Unit 104 Kent, WA | 3.0 | 1.0 | 881 | $1,650 | $1.87 | 0d | 1 | 1.41mi |
| 106 Kensington Ave S #102 Kent, WA | 3.0 | 1.0 | 881 | $1,650 | $1.87 | 26d | 1 | 1.41mi |
Listing history 15 events
-
2026-06-21days on market $69,999 Active 58 DOM
-
2026-06-18days on market $69,999 Active 55 DOM
-
2026-06-17days on market $69,999 Active 54 DOM
-
2026-06-16days on market $69,999 Active 53 DOM
-
2026-06-15days on market $69,999 Active 52 DOM
-
2026-06-13days on market $69,999 Active 50 DOM
-
2026-06-09days on market $69,999 Active 46 DOM
-
2026-06-08days on market $69,999 Active 45 DOM
-
2026-06-07days on market $69,999 Active 44 DOM
-
2026-06-04days on market $69,999 Active 41 DOM
-
2026-06-03days on market $69,999 Active 40 DOM
-
2026-06-02days on market $69,999 Active 39 DOM
-
2026-06-01days on market $69,999 Active 38 DOM
-
2026-05-31days on market $69,999 Active 37 DOM
-
2026-04-24$79,999 Active
ⓘ Source: listings_history table (triggers on properties + properties_extension) + one-shot
backfill from property_details.listing_events for pre-trigger history.
Climate risk First Street
- Flood 5/10 Major FEMA zone X (unshaded) · 27% chance over 30 yrs
- Wildfire 1/10 Low
- Heat 3/10 Moderate 7 d/yr ≥88°F today · 14 d/yr by 30 yrs out
- Wind 1/10 Low
- Air quality 8/10 Severe 12 unhealthy d/yr today · 12 by 30 yrs out
Nearby sold comps map
Loading sold comps map…
Walkable amenities ~0.75 mi
Loading nearby amenities…
Taxation est. · year 1
- Rental income
- $24,613
- − Mortgage interest
- −$3,921
- − Property taxes
- −$1,050
- − Insurance
- −$350
- − Repairs & maintenance
- −$1,969
- − Management
- −$1,969
- − Depreciation
- −$2,036
- Taxable income
- $13,318
- Est. tax owed @ 24.0%
- −$3,196
- After-tax cash flow
- $10,443/yr
For passive investors: Depreciation is non-cash, so a rental often shows a tax loss while cash-flowing — sheltering income. Rental losses are passive: they offset passive income freely, and up to $25,000/yr can offset ordinary (W-2) income if you actively participate and your MAGI is under $100k (phasing out to $0 by $150k); unused losses carry forward. On sale, claimed depreciation is recaptured at up to 25%, and gains may owe capital-gains tax (a 1031 exchange can defer both). Figures are a year-1 estimate at your 24.0% rate — not tax advice; consult a CPA.
Condition & rehab AI · 12 photos
This charming single-wide manufactured home is in good condition with recent updates, including a new roof, siding, and HVAC. The kitchen and bathrooms are well-maintained, and the property offers a newer deck and landscaping. A fresh coat of paint and updated countertops would significantly enhance its resale and rental value.
Value-add opportunities
- Both Paint exterior — Enhances curb appeal and value
- Both Replace curtains — Freshens look and improves privacy
- Both Replace countertops — Modernizes kitchen and increases value
Renovation cost estimate screening
Value-add ROI direction
- Both Paint exterior — Enhances curb appeal and value ↑
- Both Replace curtains — Freshens look and improves privacy ↑
- Both Replace countertops — Modernizes kitchen and increases value ↑
ⓘ Cost ranges are severity-bucket heuristics (US national rule-of-thumb). Get contractor quotes + a written scope before underwriting a rehab budget.
Schools (NCES district)
- District
- Kent School District
- NCES district ID
- 5303960
- Math proficiency
- 47% ▼ -1.00%
- Reading proficiency
- 57% ▼ -1.00%
- Median HH income
- $69,823
- Composite
- 48.25/100
- National rank
- #4714
- State rank
- #109 of 291 in WA
Livability — Kent
- Score
- 79/100
- State rank
- #109
- US rank
- #2154
Category grades
Schools grade is shown separately in the Schools card above.
Census & demographics
- Census place
- Kent, WA
- County
- King County · 2,251,916 people
- City population
- 119,479
- Metro
- Seattle-Tacoma-Bellevue, WA
- Population (ZIP)
- 40,862
- Household income
- $82,636
- Rent vs Own
- Severe rent burden
- 2581.0
Population outlook (King County) Hauer SSP2
- Today (2025)
- 2,576,485 people
- By 2030
- 2,803,316 · +8.8%
- By 2040
- 3,255,921 · +26.4%
- By 2050
- 3,706,444 · +43.9%
- By 2075
- 4,746,063 · +84.2%
- By 2100
- 5,407,730 · +109.9%
Race, ethnicity, and origin ACS 2023
- Neighborhood character
- Highly diverse neighborhood (Simpson 0.79)
- Race & ethnicity
- White 32% Hispanic / Latino 24% Asian 17% Black 16% Two or more races 12% Pacific Islander 4%
- Hispanic origin (detail)
- Mexican 18%
- Common ancestry
- Portuguese 4% Italian 4% Lithuanian 2%
- Foreign-born
- 33% · Canada, Vietnam, China
- Languages at home
- 57% English-only · Spanish 19% Other Indo-European 6% Other Asian/Pacific 4%
Political lean MEDSL · King
- 2024 margin
- Solid D (+51.7) · D 74.2% · R 22.5% · Other 3.4%
- 2008→2024 swing
- +9.6pp toward D · 2008: 42.1pp · 2024: 51.7pp
- All cycles
- 2024: D+51.7 2020: D+52.7 2016: D+50.4 2012: D+39.9 2008: D+42.1
Not yet ingested
- Civics
- —
Market trends
- HPI YoY
- ▼ -527.12%
- Current HPI
- 299.2499
- Rent YoY
- ▼ -0.68%
- Metro
- Seattle-Tacoma-Bellevue, WA
- State GDP YoY
- ▲ 4.65%
- F500 in state
- 22
Industry mix (Fortune 500 HQ in WA)
| Industry | F500 HQs | Revenue |
|---|---|---|
| Retail | 2 | $269B |
|
||
| Technology / Retail | 1 | $638B |
|
||
| Technology | 1 | $245B |
|
||
| Telecommunications | 1 | $38B |
|
||
| Food / Beverage | 1 | $36B |
|
||
| Automotive / Trucks | 1 | $34B |
|
||
Price history
-12.5% since first listed2 events — show timeline
- 2026-05-29 Price Changed $69,999 NWMLS as Distributed by MLS Grid
- 2026-04-24 Listed $79,999 NWMLS as Distributed by MLS Grid
Cash-flow waterfall
monthlySold comps — $/sqft
last 12 mo · ≤1 miLoading sold comps…