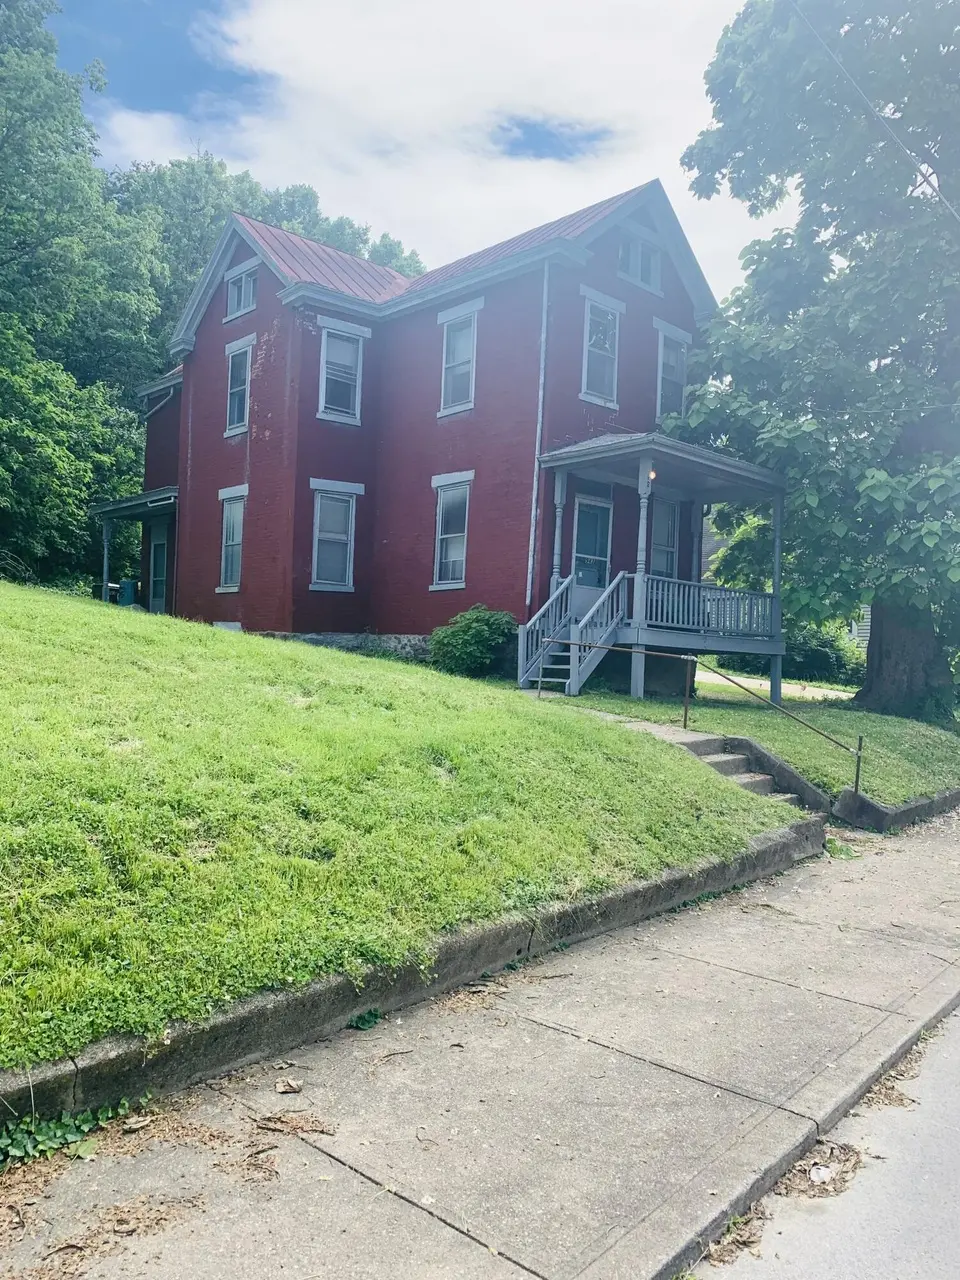
943 John St · Covington, KY
Flood risk 1/10 · Minimal
- FEMA flood zone
- X (unshaded)
- Chance of flooding over 30 yrs
- 0.0%
- Est. flood insurance / yr
- $507 – $1,088
Fire risk 1/10 · Minimal
- Est. fire insurance / yr
- $839 – $1,559
Heat risk 4/10 · Minor
- Hot days now (above 103°F)
- 7 days/yr
- Hot days in 30 yrs
- 19 days/yr
Wind risk 2/10 · Minimal
- Chance of severe wind over 30 yrs
- 1.0%
Air-quality risk 3/10 · Minor
- Unhealthy air days now
- 2 days/yr
- Unhealthy air days in 30 yrs
- 3 days/yr
Risk factors via First Street. Map © Google.
Why this score? — see what drove the B- grade
The composite is a weighted blend of 9 inputs, each scored 0–100. Each bar is that input's sub-score; the figure is the points it added to the 100-point composite (weight × sub-score).
- Cash flow +30.0/30.0
- 1% rule +10.0/10.0
- DSCR +10.0/10.0
- ARV discount +7.5/15.0
- Livability +4.3/5.0
- Rent growth +2.5/5.0
- Condition / age +2.5/5.0
- Schools +1.5/10.0
- Appreciation +0.0/10.0
$109,900
🖨 Deal sheet 📄 Offer letter ✓ Due diligence
Listing remarks
Investor special with endless potential! This duplex sits on a double lot and offers multiple opportunities for investors or developers alike. Each unit features 1 bedroom and 1 bathroom. While the property does need renovations, it presents a great chance to add value and build sweat equity. Strong rental demand in the area makes this a solid addition to an investment portfolio, or take advantage of the oversized double lot and nearby development activity to start fresh with new construction. Don't miss the opportunity to unlock the potential of this income-producing property in a rapidly growing area. Selling as-is where-is.
Key facts
- Strong rental demand
- Double lot
- 7,432 sq ft lot
Tags
Property features AI
Exterior
- Parking: Off-street parking
- Utilities: Public water; Public sewer; Cable available; Natural gas available
- Home design: Duplex; Two levels; Multi-family property; Existing structure
- Construction: Brick construction; Stone foundation; Built with metal roof
- Exterior features: Aluminum window frames; Metal roof; Lot approx. 0.17 acre (111 x 66)
Interior
- Bathrooms: 2 full bathrooms
- Heating & cooling: Central air conditioning; Forced air heating
- Interior features: Refrigerator; Full basement
Neighborhood map
What this means for you Summary
Snapshot
- This is a 4-bed/1.0-bath single-family listed at $110k.
Deal economics
- At list price, monthly cash flow is $1k ($16k/yr) — positive.
- The deal already cash-flows at list — no discount required.
- Meets the 1% rule at list price ($3k rent vs $110k).
- Recommended offer: $108k (1.5% below list) — sets the bar for market timing.
- Cap rate 21.2% vs local median 5.3% in Covington — top-decile yield for the area; either an underpriced asset or a hidden risk that comps aren't pricing in. Stress-test before assuming the spread holds.
Location & tenants
- Location reads 86/100 on livability (#40 in KY, #376 nationally) — a professional / high-income tenant draw. Strengths: amenities A+, commute A+, cost of living A+; Watch: employment D+.
- Covington Independent (suburban): math 10% / reading 27% proficiency, ranked #162 of 165 in KY (top 98%) — low school quality limits family demand, transient renter base, plan for 1-2y turnover; 78% free/reduced lunch — lower-income household profile, screen leases tightly.
- Zoned schools: John G Carlisle Elementary (math 2% / reading 27%, grade F, #620 of 676 statewide, top 93%, 304 students, 81% FRL); Holmes Middle School (math 8% / reading 26%, grade F, #211 of 217 statewide, top 97%, 656 students, 84% FRL); Holmes High School (math 12% / reading 17%, grade F, #227 of 254 statewide, top 89%, 878 students, 80% FRL) — zoned schools at 82% FRL track the district average.
- Market conditions: 92 active listings in the ZIP; 6 comparable units currently listed for rent nearby; rentals at typical pace (median 15d on market — plan ~3-4 weeks tenant-placement turnaround); 699 units permitted in Kenton County in 2024 (287 in 5+ unit buildings).
- This rent runs 45% of the median local income ($71k/yr) — at the standard rent-burdened threshold; future hikes will face affordability resistance.
Forward outlook
- Local home prices are declining (-3.0%/yr); year-one equity from $760 of loan paydown is wiped out by about $3k of value loss. Plan a longer hold.
- Kenton County population projected at +5% by 2050 — modest demand growth; plan on rents tracking national, not racing it.
- At projected returns (-3.0% appreciation + 3.0% rent growth), your $31k cash investment doubles in ~3 years — after that, you're playing with house money.
Negotiation context
- It's been on market 17 days — a 2% lower offer ($108k) is reasonable based on typical stale-listing flexibility.
- Current owner paid $75k; 47% above their basis — modest negotiation headroom, anchor on the comps not their cost.
Questions for the listing agent
- Is there a deadline driving the sale (1031 exchange, divorce, estate, relocation)? That informs how much negotiation room exists.
- What's the average days-on-market for RENTAL listings here right now (not sales)? A rising rental-DOM trend means longer vacancies and softer asking-rent achievability than the comps imply.
- What's the recent tenant-quality profile in this submarket — average credit score on applications, eviction rate, late-payment / NSF rate, and stable-employment percentage? A property-management company in the area should have these aggregated.
- How much new for-sale + rental construction is in the pipeline within 1–3 miles? Heavy new supply typically softens prices + rents 12–24 months out; constrained supply supports both.
Investment metrics
- 1% rule
- 2.42% ✓
- Cap rate
- 21.15%
- Cash-on-cash
- 53.06%
- DSCR
- 3.36
- GRM
- 3.5
CMA / ARV
- ARV (on-the-fly)
- $232,552
- Comps found
- 12
Show comp detail 12 sales within ~0.75 mi
| Address | Dist | Beds/Ba | Sqft | Sold | Price | $/sf | Match |
|---|---|---|---|---|---|---|---|
| 923 Highway Ave | 0.10mi | 3/1.5 (-1) | 1,560 (+10%) | 1mo | $325,000 | $208 | 71 |
| 1216 High St | 0.30mi | 3/1.0 (-1) | 1,418 (0%) | 14mo | $74,900 | $53 | 70 |
| 612 Altamont Rd | 0.24mi | 3/3.0 (-1) | 1,440 (+2%) | 11mo | $249,900 | $174 | 64 |
| 217 Montclair Ave | 0.64mi | 3/2.0 (-1) | 1,418 (0%) | 3mo | $227,500 | $160 | 59 |
| 401 Montclair Ave | 0.53mi | 3/2.0 (-1) | 1,402 (-1%) | 9mo | $230,000 | $164 | 57 |
| 1307 Highway Ave | 0.37mi | 3/2.0 (-1) | 1,524 (+8%) | 8mo | $229,800 | $151 | 55 |
| 435 Hazen St | 0.58mi | 4/2.0 | 1,578 (+11%) | 3mo | $259,900 | $165 | 48 |
| 221 Montclair Ave | 0.64mi | 4/1.0 | 1,342 (-5%) | 16mo | $219,000 | $163 | 48 |
| 1320 Hwy Ave | 0.43mi | 3/2.0 (-1) | 1,532 (+8%) | 12mo | $210,000 | $137 | 48 |
| 384 Altamont Rd | 0.40mi | 3/1.0 (-1) | 1,212 (-14%) | 15mo | $209,900 | $173 | 40 |
| 427 Highway Ave | 0.55mi | 3/1.0 (-1) | 1,596 (+13%) | 11mo | $183,000 | $115 | 39 |
| 134 Highway Ave | 0.70mi | 3/1.5 (-1) | 1,255 (-12%) | 6mo | $250,000 | $199 | 36 |
Match score weights: distance 35% · size 25% · config 20% · recency 20%. Top-matched comps best support the ARV.
Projected returns pro-forma
-3.0% appreciation · 3.0% rent growth · sell at horizon
- IRR
- 51.1%
- Equity multiple
- 3.24×
- Total profit
- $68,880
- Equity at exit
- $16,386
- IRR
- 56.5%
- Equity multiple
- 6.58×
- Total profit
- $171,675
- Equity at exit
- $9,502
Cash invested: $30,772 (down + closing). Projections, not guarantees.
Landlord ↔ Tenant lean methodology
- Overall (STATE)
- 83 Strongly Landlord-Friendly
- State Kentucky
- 83 Strongly Landlord-Friendly · R+16
- County
- — inherits STATE
- City
- — inherits STATE
ZIP-level market 41016
- Active inventory
- 92
- Price-to-rent
- 3.5×
Monthly cashflow live
- Estimated rent
- $2,654 high interval (Pro) →
- Mortgage (P&I)
- −$576
- Tax from tax record
- −$114 /mo · $1,368/yr
- Insurance
- −$46
- HOA
- −$0
- Vacancy / Maint / Mgmt
- −$557
- Net cashflow
- $1,361
Break-even live
UW: 25.0% down · 7.5% · 30yr · 1.5% tax · 5.0% vac · 8.0% maint · 8.0% mgmt
Financing live
Cash to close
- Down payment
- $27,475
- Closing costs
- $3,297
- Reserves months
- —
- Total cash needed
- —
Loan-product check · same deal, 3 products live
Conventional
25% down · 7.5% · 30yr
- Down + closing
- —
- Monthly P&I
- —
- Monthly cashflow
- —
- DSCR
- —
- Eligible?
- —
Personal DTI + credit; lowest rate.
DSCR
20% down · 8.5% · 30yr
- Down + closing
- —
- Monthly P&I
- —
- Monthly cashflow
- —
- DSCR
- —
- Eligible?
- —
No personal income docs; deal must DSCR.
Hard money
10% down · 12.0% · 12mo
- Down + closing
- —
- Monthly P&I
- —
- Monthly cashflow
- —
- DSCR
- —
- Eligible?
- —
Short-term bridge; refi at stabilization.
Rent comps 6 comps
| Address | Beds | Baths | Sqft | Rent | $/sqft | DOM | Units | Dist |
|---|---|---|---|---|---|---|---|---|
| 22 Swain Ct Covington, KY | 1.0–3.0 | 1.0–2.0 | 951 | $2,295 | $2.41 | 1d | 3 | 0.30mi |
| 1205 Lee St Unit 3 Covington, KY | 3.0 | 2.5 | 1850 | $3,000 | $1.62 | 23d | 1 | 1.08mi |
| 309 Vine St Cincinnati, OH | 1.0–3.0 | 1.0–2.0 | 955 | $3,334 | $3.49 | 1d | 15 | 1.15mi |
| 239 Forest Ave Ludlow, KY | 3.0 | 1.0 | 1146 | $1,395 | $1.22 | 17d | 1 | 1.16mi |
| 1 W 4th St Cincinnati, OH | 3.0 | 1.0–3.5 | 1675 | $9,200 | $5.49 | 2d | 96 | 1.18mi |
| 417 Vine St Cincinnati, OH | 3.0 | 2.0 | 1602 | $2,950 | $1.84 | 14d | 1 | 1.21mi |
Listing history 10 events
-
2026-06-15statusdays on market $109,900 Pending 17 DOM
-
2026-06-09days on market $109,900 Active 14 DOM
-
2026-06-08days on market $109,900 Active 13 DOM
-
2026-06-07days on market $109,900 Active 12 DOM
-
2026-06-03days on market $109,900 Active 8 DOM
-
2026-06-02days on market $109,900 Active 7 DOM
-
2026-06-01days on market $109,900 Active 6 DOM
-
2026-05-31days on market $109,900 Active 5 DOM
-
2026-05-26$109,900 Active
-
2022-03-02soldstatus $75,000
ⓘ Source: listings_history table (triggers on properties + properties_extension) + one-shot
backfill from property_details.listing_events for pre-trigger history.
Tax reassessment forecast KY · Resets to sale price
- Current annual tax
- $1,368 · $114/mo
- Projected year-2 tax
- $1,368 · $114/mo
- Expected delta
- $0/yr ($0/mo · 0.0%)
ⓘ Screening estimate from a state-policy table — verify with the county assessor before closing.
Climate risk First Street
- Flood 1/10 Low FEMA zone X (unshaded) · 0% chance over 30 yrs
- Wildfire 1/10 Low
- Heat 4/10 Moderate 7 d/yr ≥103°F today · 19 d/yr by 30 yrs out
- Wind 2/10 Low 100% chance of damaging wind over 30 yrs
- Air quality 3/10 Moderate 2 unhealthy d/yr today · 3 by 30 yrs out
Nearby sold comps map
Loading sold comps map…
Walkable amenities ~0.75 mi
Loading nearby amenities…
Taxation est. · year 1
- Rental income
- $31,851
- − Mortgage interest
- −$6,156
- − Property taxes
- −$1,368
- − Insurance
- −$550
- − Repairs & maintenance
- −$2,548
- − Management
- −$2,548
- − Depreciation
- −$3,197
- Taxable income
- $15,483
- Est. tax owed @ 24.0%
- −$3,716
- After-tax cash flow
- $12,612/yr
For passive investors: Depreciation is non-cash, so a rental often shows a tax loss while cash-flowing — sheltering income. Rental losses are passive: they offset passive income freely, and up to $25,000/yr can offset ordinary (W-2) income if you actively participate and your MAGI is under $100k (phasing out to $0 by $150k); unused losses carry forward. On sale, claimed depreciation is recaptured at up to 25%, and gains may owe capital-gains tax (a 1031 exchange can defer both). Figures are a year-1 estimate at your 24.0% rate — not tax advice; consult a CPA.
Schools (NCES district)
- District
- Covington Independent
- NCES district ID
- 2101350
- Math proficiency
- 10% ▼ -20.00%
- Reading proficiency
- 27% ▼ -14.00%
- Median HH income
- $33,681
- Composite
- 15.04/100
- National rank
- #9353
- State rank
- #162 of 165 in KY
Livability — Covington
- Score
- 86/100
- State rank
- #40
- US rank
- #376
Category grades
Schools grade is shown separately in the Schools card above.
Census & demographics
- Census place
- Covington, KY
- County
- Kenton County · 142,881 people
- City population
- 34,373
- Metro
- Cincinnati, OH-KY-IN
- Population (ZIP)
- 5,795
- Household income
- $71,172
- Rent vs Own
- Severe rent burden
- 95.0
Population outlook (Kenton County) Hauer SSP2
- Today (2025)
- 174,205 people
- By 2030
- 177,897 · +2.1%
- By 2040
- 182,671 · +4.9%
- By 2050
- 183,543 · +5.4%
- By 2075
- 178,977 · +2.7%
- By 2100
- 159,920 · -8.2%
Race, ethnicity, and origin ACS 2023
- Neighborhood character
- Predominantly White (79%)
- Race & ethnicity
- White 79% Two or more races 10% Hispanic / Latino 8% Black 2%
- Hispanic origin (detail)
- Mexican 5%
- Common ancestry
- Slovak 2% Romanian 1% Serbian 1%
- Foreign-born
- 1% · Canada
- Languages at home
- 95% English-only · Spanish 3% German/W. Germanic 1%
Political lean MEDSL · Kenton
- 2024 margin
- Strong R (+21.7) · D 38.2% · R 59.9% · Other 1.9%
- 2008→2024 swing
- -0.9pp no change · 2008: -20.9pp · 2024: -21.7pp
- All cycles
- 2024: R+21.7 2020: R+19.3 2016: R+26.1 2012: R+24.3 2008: R+20.9
Not yet ingested
- Civics
- —
Market trends
- HPI YoY
- ▼ -141.84%
- Current HPI
- 215.1436
- Rent YoY
- —
- Metro
- Cincinnati, OH-KY-IN
- State GDP YoY
- ▲ 1.81%
- F500 in state
- 4
Industry mix (Fortune 500 HQ in KY)
| Industry | F500 HQs | Revenue |
|---|---|---|
| Healthcare | 1 | $118B |
|
||
| Food / Beverage | 1 | $7B |
|
||
Price history
+46.5% since first listed2 events — show timeline
- 2026-05-26 Listed $109,900 NKMLS
- 2022-03-02 Sold (Public Records) $75,000 Public Records
Property tax history
+3.6%/yrLatest (2025): $1,368 · +0.7% YoY. Source: county tax records.
Cash-flow waterfall
monthlySold comps — $/sqft
last 12 mo · ≤1 miLoading sold comps…