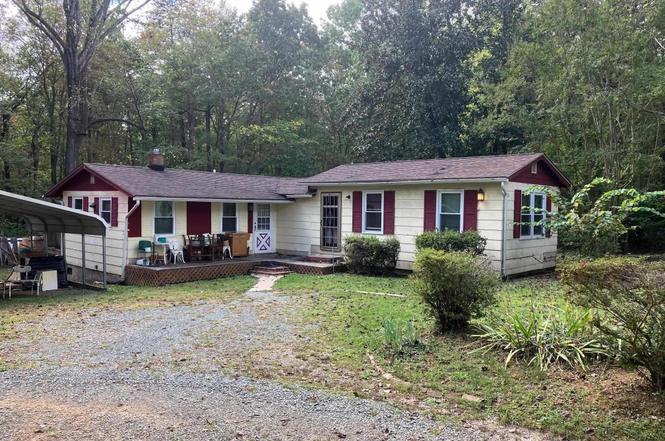
8203 Chestnut Grove Rd · Esmont, VA
Flood risk 1/10 · Minimal
- FEMA flood zone
- X (unshaded)
- Chance of flooding over 30 yrs
- 0.0%
- Est. flood insurance / yr
- $473 – $860
Fire risk 4/10 · Minor
- Est. fire insurance / yr
- $666 – $1,236
Heat risk 5/10 · Moderate
- Hot days now (above 104°F)
- 7 days/yr
- Hot days in 30 yrs
- 17 days/yr
Wind risk 2/10 · Minimal
- Chance of severe wind over 30 yrs
- 2.0%
Air-quality risk 2/10 · Minimal
- Unhealthy air days now
- 0 days/yr
- Unhealthy air days in 30 yrs
- 1 days/yr
Risk factors via First Street. Map © Google.
Why this score? — see what drove the B+ grade
The composite is a weighted blend of 9 inputs, each scored 0–100. Each bar is that input's sub-score; the figure is the points it added to the 100-point composite (weight × sub-score).
- Cash flow +30.0/30.0
- DSCR +10.0/10.0
- 1% rule +9.6/10.0
- ARV discount +7.5/15.0
- Schools +6.2/10.0
- Appreciation +6.0/10.0
- Livability +2.9/5.0
- Rent growth +2.5/5.0
- Condition / age +2.5/5.0
$129,900
🖨 Deal sheet 📄 Offer letter ✓ Due diligence
Listing remarks
Handyman Special! Affordable, livable ranch style home off Rt. 6. Beautiful lot. Great opportunity for some sweat equity! Recently replaced roof and windows. Flooring is wood, carpet and vinyl. Property is sold as-is.
Key facts
- Replaced windows
- Wood flooring
- Carpet flooring
Tags
Neighborhood map
What this means for you Summary
Snapshot
- This is a 3-bed/1.0-bath single-family listed at $130k.
Deal economics
- At list price, monthly cash flow is $679 ($8k/yr) — positive.
- The deal already cash-flows at list — no discount required.
- Meets the 1% rule at list price ($2k rent vs $130k).
- Recommended offer: $122k (6.0% below list) — sets the bar for market timing.
Location & tenants
- Location reads 58/100 on livability (#488 in VA) — a working-class tenant base; expect higher turnover. Strengths: cost of living A+, housing A+; Watch: employment D+, amenities F, commute F.
- Albemarle County Public School District (rural): math 66% / reading 77% proficiency, ranked #14 of 131 in VA (top 11%) — strong family-tenant draw, lease renewals of 3-5y typical.
- Zoned schools: Scottsville Elementary (math 47% / reading 67%, grade C+, #597 of 1,108 statewide, top 57%, 227 students, 59% FRL); Leslie H. Walton Middle (math 77% / reading 77%, grade A, #38 of 342 statewide, top 11%, 339 students, 38% FRL); Monticello High (math 49% / reading 81%, grade B, #210 of 319 statewide, top 66%, 1,229 students, 56% FRL) — zoned schools average 51% FRL vs 23% district-wide (27 pts higher); higher-poverty schools than district average — tighter screening recommended.
- Market conditions: 13 active listings in the ZIP; 810 units permitted in Albemarle County in 2024 (188 in 5+ unit buildings).
Forward outlook
- In year one you build about $3k of equity ($898 loan paydown + $3k appreciation (2.0% local appreciation)).
- Albemarle County population projected at +24% by 2050 — long-run rental-demand tailwind backs the buy-and-hold thesis.
- At projected returns (2.0% appreciation + 3.0% rent growth), your $36k cash investment doubles in ~3 years — after that, you're playing with house money.
- By year 10, paydown + projected appreciation supports a ~$34k cash-out refi (75% LTV) — recoverable capital for the next deal without selling this one.
Negotiation context
- It's been on market 76 days — a 6% lower offer ($122k) is reasonable based on typical stale-listing flexibility.
- 2 sale attempts; this cycle's ask has dropped $30k (19%) from the opening price — seller is motivated, your offer sets the floor, not the list.
Risks & watch-outs
- Climate carrying-cost: extreme-heat days projected 7→17/yr by 2055 (HVAC capex compounding) — expect insurance premiums to compound above CPI over the hold.
Questions for the listing agent
- It's been on market 76 days. Have you received any prior offers? Is the seller open to a 6% concession, seller financing, or rate buy-down credit?
- Built in 1965 — when were the roof, HVAC, electrical panel, plumbing, and water heater last replaced?
- Why hasn't it sold? Are there any deal-killer items the seller is aware of (foundation, flood, title, zoning, code violations)?
- Is there a deadline driving the sale (1031 exchange, divorce, estate, relocation)? That informs how much negotiation room exists.
- Schools are F-rated, which usually means shorter tenancies and higher turnover. Who's the typical renter profile here, and what's been the actual vacancy rate?
- What's the average days-on-market for RENTAL listings here right now (not sales)? A rising rental-DOM trend means longer vacancies and softer asking-rent achievability than the comps imply.
- What's the recent tenant-quality profile in this submarket — average credit score on applications, eviction rate, late-payment / NSF rate, and stable-employment percentage? A property-management company in the area should have these aggregated.
- How much new for-sale + rental construction is in the pipeline within 1–3 miles? Heavy new supply typically softens prices + rents 12–24 months out; constrained supply supports both.
Investment metrics
- 1% rule
- 1.46% ✓
- Cap rate
- 12.56%
- Cash-on-cash
- 22.40%
- DSCR
- 2.00
- GRM
- 5.7
CMA / ARV
No comps found within radius.
Projected returns pro-forma
1.98% appreciation · 3.0% rent growth · sell at horizon
- IRR
- 26.6%
- Equity multiple
- 2.43×
- Total profit
- $51,999
- Equity at exit
- $51,105
- IRR
- 28.2%
- Equity multiple
- 4.67×
- Total profit
- $133,419
- Equity at exit
- $73,491
Cash invested: $36,372 (down + closing). Projections, not guarantees.
Landlord ↔ Tenant lean methodology
- Overall (STATE)
- 55 Moderately Landlord-Leaning
- State Virginia
- 55 Moderately Landlord-Leaning · D+2
- County
- — inherits STATE
- City
- — inherits STATE
ZIP-level market 22937
- Home prices YoY
- 1.2%
- Active inventory
- 13
- Price-to-rent
- 5.7×
Monthly cashflow live
- Estimated rent
- $1,895 medium interval (Pro) →
- Mortgage (P&I)
- −$681
- Tax from tax record
- −$83 /mo · $999/yr
- Insurance
- −$54
- HOA
- −$0
- Vacancy / Maint / Mgmt
- −$398
- Net cashflow
- $679
Break-even live
UW: 25.0% down · 7.5% · 30yr · 1.5% tax · 5.0% vac · 8.0% maint · 8.0% mgmt
Financing live
Cash to close
- Down payment
- $32,475
- Closing costs
- $3,897
- Reserves months
- —
- Total cash needed
- —
Loan-product check · same deal, 3 products live
Conventional
25% down · 7.5% · 30yr
- Down + closing
- —
- Monthly P&I
- —
- Monthly cashflow
- —
- DSCR
- —
- Eligible?
- —
Personal DTI + credit; lowest rate.
DSCR
20% down · 8.5% · 30yr
- Down + closing
- —
- Monthly P&I
- —
- Monthly cashflow
- —
- DSCR
- —
- Eligible?
- —
No personal income docs; deal must DSCR.
Hard money
10% down · 12.0% · 12mo
- Down + closing
- —
- Monthly P&I
- —
- Monthly cashflow
- —
- DSCR
- —
- Eligible?
- —
Short-term bridge; refi at stabilization.
Listing history 5 events
-
2026-03-07status Pending
-
2026-02-03price $129,900
-
2026-01-14status Active
-
2025-11-06status Pending
-
2025-10-14$159,900 Active
ⓘ Source: listings_history table (triggers on properties + properties_extension) + one-shot
backfill from property_details.listing_events for pre-trigger history.
Tax reassessment forecast VA · Resets to sale price
- Current annual tax
- $999 · $83/mo
- Projected year-2 tax
- $1,065 · $89/mo
- Expected delta
- +$67/yr (+$6/mo · 6.7%)
ⓘ Screening estimate from a state-policy table — verify with the county assessor before closing.
Climate risk First Street
- Flood 1/10 Low FEMA zone X (unshaded) · 0% chance over 30 yrs
- Wildfire 4/10 Moderate
- Heat 5/10 Major 7 d/yr ≥104°F today · 17 d/yr by 30 yrs out
- Wind 2/10 Low 2% chance of damaging wind over 30 yrs
- Air quality 2/10 Low 0 unhealthy d/yr today · 1 by 30 yrs out
Nearby sold comps map
Loading sold comps map…
Walkable amenities ~0.75 mi
Loading nearby amenities…
Taxation est. · year 1
- Rental income
- $22,745
- − Mortgage interest
- −$7,276
- − Property taxes
- −$999
- − Insurance
- −$650
- − Repairs & maintenance
- −$1,820
- − Management
- −$1,820
- − Depreciation
- −$3,779
- Taxable income
- $6,403
- Est. tax owed @ 24.0%
- −$1,537
- After-tax cash flow
- $6,610/yr
For passive investors: Depreciation is non-cash, so a rental often shows a tax loss while cash-flowing — sheltering income. Rental losses are passive: they offset passive income freely, and up to $25,000/yr can offset ordinary (W-2) income if you actively participate and your MAGI is under $100k (phasing out to $0 by $150k); unused losses carry forward. On sale, claimed depreciation is recaptured at up to 25%, and gains may owe capital-gains tax (a 1031 exchange can defer both). Figures are a year-1 estimate at your 24.0% rate — not tax advice; consult a CPA.
Schools (NCES district)
- District
- Albemarle County Public School District
- NCES district ID
- 5100090
- Math proficiency
- 66% ▼ -16.00%
- Reading proficiency
- 77% ▼ -2.00%
- Median HH income
- $67,851
- Composite
- 62.28/100
- National rank
- #698
- State rank
- #14 of 131 in VA
Livability — Esmont
- Score
- 58/100
- State rank
- #488
- US rank
- #21526
Category grades
Schools grade is shown separately in the Schools card above.
Census & demographics
- Population (ZIP)
- 1,556
Population outlook (Albemarle County) Hauer SSP2
- Today (2025)
- 119,403 people
- By 2030
- 125,829 · +5.4%
- By 2040
- 137,705 · +15.3%
- By 2050
- 148,058 · +24.0%
- By 2075
- 172,223 · +44.2%
- By 2100
- 185,628 · +55.5%
Race, ethnicity, and origin ACS 2023
- Neighborhood character
- Predominantly White (71%)
- Race & ethnicity
- White 71% Black 17% Hispanic / Latino 6% Two or more races 5% Pacific Islander 2%
- Hispanic origin (detail)
- Mexican 5%
- Common ancestry
- Lithuanian 6% Slovak 2% Italian 1%
- Foreign-born
- 9% · Canada, Vietnam
- Languages at home
- 97% English-only · Spanish 2% German/W. Germanic 1%
Political lean MEDSL · Albemarle
- 2024 margin
- Solid D (+34.1) · D 66.3% · R 32.2% · Other 1.4%
- 2008→2024 swing
- +16.1pp toward D · 2008: 18.0pp · 2024: 34.1pp
- All cycles
- 2024: D+34.1 2020: D+33.5 2016: D+25.1 2012: D+12.0 2008: D+18.0
Not yet ingested
- Civics
- —
Market trends
- HPI YoY
- ▲ 1.98%
- Current HPI
- 170.0385
- Rent YoY
- —
- Metro
- —
- State GDP YoY
- ▲ 2.40%
- F500 in state
- 50
Industry mix (Fortune 500 HQ in VA)
| Industry | F500 HQs | Revenue |
|---|---|---|
| Aerospace / Defense | 4 | $236B |
|
||
| Technology / Defense | 3 | $32B |
|
||
| Financial Services | 2 | $176B |
|
||
| Utilities | 2 | $27B |
|
||
| Insurance | 2 | $25B |
|
||
| Technology | 2 | $15B |
|
||
Price history
-18.8% since first listed5 events — show timeline
- 2026-03-07 Pending — CAAR
- 2026-02-03 Price Changed $129,900 CAAR
- 2026-01-14 Relisted — CAAR
- 2025-11-06 Pending — CAAR
- 2025-10-14 Listed $159,900 CAAR
Property tax history
+2.8%/yrLatest (2025): $999 · +15.1% YoY. Source: county tax records.
Cash-flow waterfall
monthlySold comps — $/sqft
last 12 mo · ≤1 miLoading sold comps…