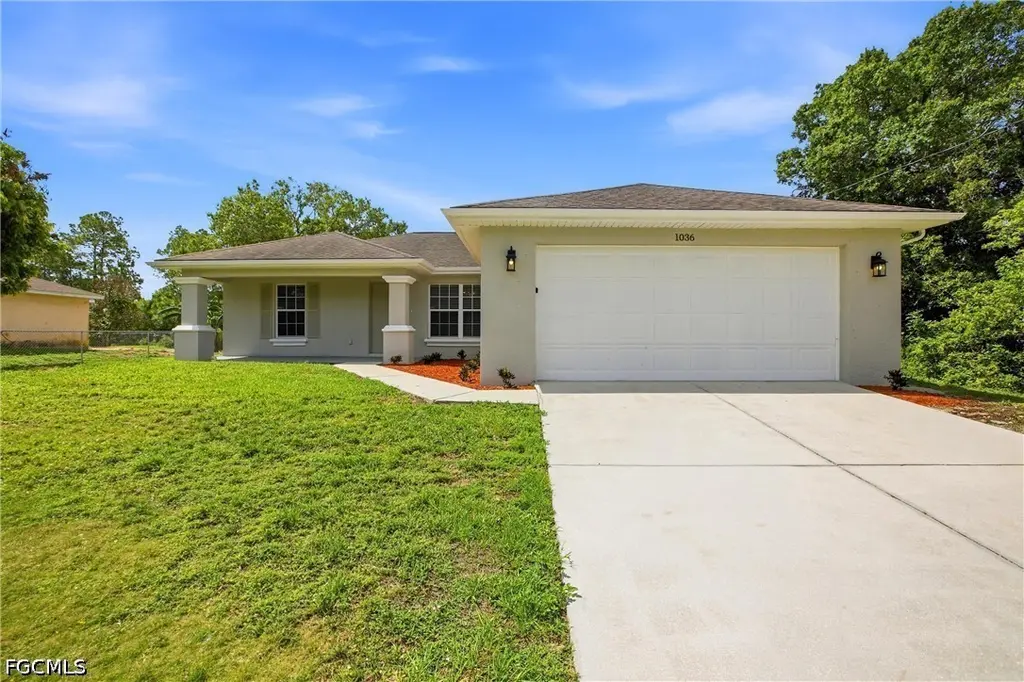
1036 Belmont St E · Lehigh Acres, FL
Flood risk 1/10 · Minimal
- FEMA flood zone
- X (unshaded)
- Chance of flooding over 30 yrs
- 0.0%
- Est. flood insurance / yr
- $507 – $1,088
Fire risk 3/10 · Minor
- Est. fire insurance / yr
- $947 – $1,759
Heat risk 10/10 · Severe
- Hot days now (above 108°F)
- 7 days/yr
- Hot days in 30 yrs
- 28 days/yr
Wind risk 10/10 · Severe
- Chance of severe wind over 30 yrs
- 99.0%
Air-quality risk 2/10 · Minimal
- Unhealthy air days now
- 1 days/yr
- Unhealthy air days in 30 yrs
- 2 days/yr
Risk factors via First Street. Map © Google.
Why this score? — see what drove the C grade
The composite is a weighted blend of 9 inputs, each scored 0–100. Each bar is that input's sub-score; the figure is the points it added to the 100-point composite (weight × sub-score).
- Cash flow +14.5/30.0
- ARV discount +12.4/15.0
- Appreciation +10.0/10.0
- DSCR +4.4/10.0
- Schools +4.1/10.0
- 1% rule +3.6/10.0
- Livability +3.0/5.0
- Condition / age +2.5/5.0
- Rent growth +1.3/5.0
$259,900
🖨 Deal sheet 📄 Offer letter ✓ Due diligence
Listing remarks
FISH FROM YOUR BACKYARD! Come enjoy this this updated 3-bedroom, 2-bath home - where you you can fish and watch the wildlife from your own backyard. The freshly painted home pairs inviting Florida living with thoughtful updates, including a 2022 hot water heater. From the moment you arrive, the long covered front porch welcomes you in with refreshed landscaping, updated mulch beds, and curb appeal that feels warm and well cared for — the perfect spot to enjoy morning coffee or unwind after a long day. Inside, vaulted ceilings and an open great room create an airy feel, while triple sliding glass doors draw your attention straight to the backyard and canal beyond. Tile flooring throug
Key facts
- Tile flooring
- 0.26 acre lot
- 2 garage spots
Tags
Property features AI
Finance
- Financial info: Pets allowed
- HOA & community: Non-gated community; No association fee
Exterior
- Parking: Attached 2-car garage
- Utilities: Cable available; High-speed internet available; Septic tank; Well water
- Home design: Single-story home; Entry at level 1; Faces north; Resale property
- Construction: Block, concrete and stucco construction; Shingle roof
- Exterior features: Lanai; Patio; Screened porch; Porch; Room for a pool; Manual shutters; Canal access waterfront
Interior
- Kitchen: Kitchen island; Dishwasher; Microwave; Range
- Bedrooms: Bedroom located on the main level
- Flooring: Carpet; Tile
- Bathrooms: 2 full bathrooms
- Heating & cooling: Central heating (electric); Central air conditioning (electric); Ceiling fans
- Interior features: Vaulted ceilings; Split bedroom layout; Bedroom on main level; Living/dining room; Pantry; Tub with shower; Single-hung windows; Unfurnished
- Laundry & utility: Inside laundry
Neighborhood map
What this means for you Summary
Snapshot
- This is a 3-bed/2.0-bath single-family listed at $260k.
Deal economics
- At list price, monthly cash flow is $57 ($681/yr) — positive.
- The deal already cash-flows at list — no discount required.
- To meet the 1% rule (rent ≥ 1% of price), the offer needs to be $223k (14.3% below list).
- Recommended offer: $223k (14.3% below list) — sets the bar for 1% rule.
- Cap rate 6.6% vs local median 4.7% in Lehigh Acres — top-decile yield for the area; either an underpriced asset or a hidden risk that comps aren't pricing in. Stress-test before assuming the spread holds.
Location & tenants
- Location reads 59/100 on livability (#826 in FL) — a working-class tenant base; expect higher turnover. Strengths: cost of living A+, housing A+; Watch: crime C-, employment D+, schools D-.
- Lee (suburban): math 47% / reading 50% proficiency, ranked #42 of 73 in FL (top 58%) — families likely to look elsewhere, expect single-tenant / working-renter base with shorter leases.
- Market conditions: Rents falling (-4.7%/yr); 2460 active listings in the ZIP; 36 comparable units currently listed for rent nearby; rentals at typical pace (median 17d on market — plan ~3-4 weeks tenant-placement turnaround); 15,411 units permitted in Lee County in 2024 (4,686 in 5+ unit buildings).
- This rent runs 37% of the median local income ($72k/yr) — at the standard rent-burdened threshold; future hikes will face affordability resistance.
Forward outlook
- In year one you build about $28k of equity ($2k loan paydown + $26k appreciation (10.0% local appreciation)).
- Lee County population projected at +44% by 2050 — long-run rental-demand tailwind backs the buy-and-hold thesis.
- At projected returns (10.0% appreciation + 0.0% rent growth), your $73k cash investment doubles in ~3 years — after that, you're playing with house money.
- By year 2, paydown + projected appreciation supports a ~$45k cash-out refi (75% LTV) — recoverable capital for the next deal without selling this one.
Negotiation context
- It's been on market 20 days — a 2% lower offer ($256k) is reasonable based on typical stale-listing flexibility.
Risks & watch-outs
- Climate carrying-cost: severe wind risk, 99% chance of damaging wind over 30y; extreme-heat days projected 7→28/yr by 2055 (HVAC capex compounding) — expect insurance premiums to compound above CPI over the hold.
Questions for the listing agent
- Is there a deadline driving the sale (1031 exchange, divorce, estate, relocation)? That informs how much negotiation room exists.
- Schools are D-rated, which usually means shorter tenancies and higher turnover. Who's the typical renter profile here, and what's been the actual vacancy rate?
- What's the average days-on-market for RENTAL listings here right now (not sales)? A rising rental-DOM trend means longer vacancies and softer asking-rent achievability than the comps imply.
- What's the recent tenant-quality profile in this submarket — average credit score on applications, eviction rate, late-payment / NSF rate, and stable-employment percentage? A property-management company in the area should have these aggregated.
- How much new for-sale + rental construction is in the pipeline within 1–3 miles? Heavy new supply typically softens prices + rents 12–24 months out; constrained supply supports both.
Investment metrics
- 1% rule
- 0.86% ✗
- Cap rate
- 6.56%
- Cash-on-cash
- 0.94%
- DSCR
- 1.04
- GRM
- 9.7
CMA / ARV
- ARV (on-the-fly)
- $291,408
- Comps found
- 4
Show comp detail 4 sales within ~0.75 mi
| Address | Dist | Beds/Ba | Sqft | Sold | Price | $/sf | Match |
|---|---|---|---|---|---|---|---|
| 1010 Sunrise Blvd | 0.25mi | 3/2.0 | 1,387 (-1%) | 13mo | $320,000 | $231 | 76 |
| 1019 Carroll St E | 0.27mi | 3/2.0 | 1,503 (+7%) | 5mo | $260,000 | $173 | 72 |
| 1203 Grant Blvd | 0.19mi | 2/2.0 (-1) | 1,208 (-14%) | 3mo | $245,000 | $203 | 60 |
| 210 Aurora Ave S | 0.64mi | 3/2.0 | 1,536 (+10%) | 10mo | $320,000 | $208 | 46 |
Match score weights: distance 35% · size 25% · config 20% · recency 20%. Top-matched comps best support the ARV.
Projected returns pro-forma
10.0% appreciation · 0.0% rent growth · sell at horizon
- IRR
- 24.0%
- Equity multiple
- 2.90×
- Total profit
- $138,616
- Equity at exit
- $234,139
- IRR
- 20.6%
- Equity multiple
- 6.41×
- Total profit
- $393,626
- Equity at exit
- $504,929
Cash invested: $72,772 (down + closing). Projections, not guarantees.
Landlord ↔ Tenant lean methodology
- Overall (STATE)
- 87 Strongly Landlord-Friendly
- State Florida
- 87 Strongly Landlord-Friendly · R+3
- County
- — inherits STATE
- City
- — inherits STATE
ZIP-level market 33974
- Home prices YoY
- 5.8%
- Rents YoY
- -4.7%
- Active inventory
- 2460
- Price-to-rent
- 9.7×
Monthly cashflow live
- Estimated rent
- $2,226 high interval (Pro) →
- Mortgage (P&I)
- −$1,363
- Tax from tax record
- −$231 /mo · $2,770/yr
- Insurance
- −$108
- HOA
- −$0
- Vacancy / Maint / Mgmt
- −$468
- Net cashflow
- $57
Break-even live
UW: 25.0% down · 7.5% · 30yr · 1.5% tax · 5.0% vac · 8.0% maint · 8.0% mgmt
Financing live
Cash to close
- Down payment
- $64,975
- Closing costs
- $7,797
- Reserves months
- —
- Total cash needed
- —
Loan-product check · same deal, 3 products live
Conventional
25% down · 7.5% · 30yr
- Down + closing
- —
- Monthly P&I
- —
- Monthly cashflow
- —
- DSCR
- —
- Eligible?
- —
Personal DTI + credit; lowest rate.
DSCR
20% down · 8.5% · 30yr
- Down + closing
- —
- Monthly P&I
- —
- Monthly cashflow
- —
- DSCR
- —
- Eligible?
- —
No personal income docs; deal must DSCR.
Hard money
10% down · 12.0% · 12mo
- Down + closing
- —
- Monthly P&I
- —
- Monthly cashflow
- —
- DSCR
- —
- Eligible?
- —
Short-term bridge; refi at stabilization.
Rent comps 36 comps
| Address | Beds | Baths | Sqft | Rent | $/sqft | DOM | Units | Dist |
|---|---|---|---|---|---|---|---|---|
| 232 Fowler Ave Lehigh Acres, FL | 3.0 | 2.0 | 1582 | $2,664 | $1.68 | 24d | 1 | 0.23mi |
| 940 Belmont St E Lehigh Acres, FL | 4.0 | 2.0 | 1838 | $2,850 | $1.55 | 24d | 1 | 0.34mi |
| 1122 Randolph St Lehigh Acres, FL | 3.0 | 2.0 | 1550 | $2,100 | $1.35 | 24d | 1 | 0.60mi |
| 1125 Chipley St Unit 1 Lehigh Acres, FL | 2.0 | 1.0 | 950 | $1,350 | $1.42 | 3d | 1 | 0.66mi |
| 444 Genoa Ave S Lehigh Acres, FL | 4.0 | 2.0 | 1389 | $1,750 | $1.26 | 21d | 1 | 0.67mi |
| 912 Anthony St E Lehigh Acres, FL | 3.0 | 2.5 | 1548 | $1,890 | $1.22 | 16d | 1 | 0.69mi |
| 947 Grant Blvd Lehigh Acres, FL | 4.0 | 2.0 | 1650 | $2,145 | $1.30 | 24d | 1 | 0.91mi |
| 327 Lester Ave S Lehigh Acres, FL | 4.0 | 2.0 | 1577 | $2,195 | $1.39 | 2d | 1 | 0.92mi |
| 382 McArthur Blvd Lehigh Acres, FL | 3.0 | 2.0 | 1055 | $2,200 | $2.09 | 24d | 1 | 1.04mi |
| 1226 Chrisholm St Lehigh Acres, FL | 4.0 | 2.0 | 1811 | $2,500 | $1.38 | 2d | 1 | 1.10mi |
| 18 Scott Ave Lehigh Acres, FL | 4.0 | 3.0 | 1822 | $3,200 | $1.76 | 2d | 1 | 1.10mi |
| 1228 Chrisholm St Lehigh Acres, FL | 4.0 | 2.0 | 1811 | $2,500 | $1.38 | 2d | 1 | 1.12mi |
| 442 Genoa Ave S Lehigh Acres, FL | 4.0 | 2.0 | 1365 | $1,750 | $1.28 | 3d | 1 | 1.14mi |
| 119 Wellington Ave Lehigh Acres, FL | 4.0 | 3.0 | 1822 | $3,200 | $1.76 | 2d | 1 | 1.15mi |
| 101 Edward Ave Lehigh Acres, FL | 3.0 | 2.0 | 1531 | $3,200 | $2.09 | 24d | 1 | 1.16mi |
| 313 Melissa Ave Unit A Lehigh Acres, FL | 3.0 | 2.0 | 1199 | $1,575 | $1.31 | 3d | 1 | 1.22mi |
| 219 Beckley Dr Lehigh Acres, FL | 3.0 | 2.5 | 1548 | $1,890 | $1.22 | 16d | 1 | 1.22mi |
| 315 Melissa Ave Unit A Lehigh Acres, FL | 3.0 | 2.0 | 1199 | $1,550 | $1.29 | 3d | 1 | 1.23mi |
| 1440 Graham Cir Lehigh Acres, FL | 3.0 | 2.0 | 1767 | $2,300 | $1.30 | 24d | 1 | 1.23mi |
| 333 Bell Blvd S Lehigh Acres, FL | 3.0 | 2.0 | 1114 | $1,300 | $1.17 | 3d | 1 | 1.25mi |
| 1018 Kent St E Lehigh Acres, FL | 3.0 | 2.0 | 1600 | $2,000 | $1.25 | 16d | 1 | 1.26mi |
| 350 Limerick Ave S Lehigh Acres, FL | 3.0 | 2.0 | 1199 | $1,800 | $1.50 | 3d | 1 | 1.26mi |
| 825 Carbon St E Lehigh Acres, FL | 3.0 | 2.0 | 1582 | $2,300 | $1.45 | 24d | 1 | 1.30mi |
| 970 Lakeside Dr Lehigh Acres, FL | 3.0 | 2.0 | 1325 | $1,800 | $1.36 | 19d | 1 | 1.30mi |
| 346 Bell Blvd S Lehigh Acres, FL | 3.0 | 2.0 | 1185 | $1,495 | $1.26 | 15d | 1 | 1.32mi |
| 346 Bell Blvd S Lehigh Acres, FL | 3.0 | 2.0 | 1185 | $1,495 | $1.26 | 3d | 1 | 1.32mi |
| 129 Wanatah Ave Lehigh Acres, FL | 4.0 | 2.0 | 1798 | $1,911 | $1.06 | 3d | 1 | 1.34mi |
| 459 Lockport Ave S Lehigh Acres, FL | 3.0 | 2.0 | 1650 | $2,000 | $1.21 | 24d | 1 | 1.37mi |
| 230 E Malden Ave S Lehigh Acres, FL | 4.0 | 2.0 | 1833 | $1,875 | $1.02 | 24d | 1 | 1.38mi |
| 388 Bell Blvd S Lehigh Acres, FL | 3.0 | 2.0 | 1200 | $1,780 | $1.48 | 24d | 1 | 1.39mi |
| 940 Sterling St E Lehigh Acres, FL | 4.0 | 2.0 | 1389 | $1,750 | $1.26 | 3d | 1 | 1.41mi |
| 759 Cane St E Lehigh Acres, FL | 3.0 | 2.0 | 1169 | $1,950 | $1.67 | 3d | 1 | 1.41mi |
| 459 Lackey Ave S Lehigh Acres, FL | 4.0 | 2.0 | 1833 | $1,825 | $1.00 | 2d | 1 | 1.42mi |
| 815 Porter St E Lehigh Acres, FL | 3.0 | 2.0 | 1659 | $1,800 | $1.08 | 24d | 1 | 1.42mi |
| 1252 County St E Lehigh Acres, FL | 4.0 | 2.0 | 1571 | $1,995 | $1.27 | 24d | 1 | 1.47mi |
| 750 Cane St E Lehigh Acres, FL | 4.0 | 3.0 | 1537 | $2,800 | $1.82 | 3d | 1 | 1.48mi |
Listing history 13 events
-
2026-06-18days on market $259,900 Active 20 DOM
-
2026-06-17days on market $259,900 Active 19 DOM
-
2026-06-16days on market $259,900 Active 18 DOM
-
2026-06-15days on market $259,900 Active 17 DOM
-
2026-06-13days on market $259,900 Active 15 DOM
-
2026-06-10days on market $259,900 Active 12 DOM
-
2026-06-09days on market $259,900 Active 11 DOM
-
2026-06-08days on market $259,900 Active 10 DOM
-
2026-06-07days on market $259,900 Active 9 DOM
-
2026-06-03days on market $259,900 Active 5 DOM
-
2026-06-02days on market $259,900 Active 4 DOM
-
2026-06-01days on market $259,900 Active 3 DOM
-
2026-05-31days on market $259,900 Active 2 DOM
ⓘ Source: listings_history table (triggers on properties + properties_extension) + one-shot
backfill from property_details.listing_events for pre-trigger history.
Tax reassessment forecast FL · Resets to sale price
- Current annual tax
- $2,770 · $231/mo
- Projected year-2 tax
- $2,770 · $231/mo
- Expected delta
- $0/yr ($0/mo · 0.0%)
ⓘ Screening estimate from a state-policy table — verify with the county assessor before closing.
Climate risk First Street
- Flood 1/10 Low FEMA zone X (unshaded) · 0% chance over 30 yrs
- Wildfire 3/10 Moderate
- Heat 10/10 Extreme 7 d/yr ≥108°F today · 28 d/yr by 30 yrs out
- Wind 10/10 Extreme 99% chance of damaging wind over 30 yrs
- Air quality 2/10 Low 1 unhealthy d/yr today · 2 by 30 yrs out
Nearby sold comps map
Loading sold comps map…
Walkable amenities ~0.75 mi
Loading nearby amenities…
Taxation est. · year 1
- Rental income
- $26,717
- − Mortgage interest
- −$14,558
- − Property taxes
- −$2,770
- − Insurance
- −$1,300
- − Repairs & maintenance
- −$2,137
- − Management
- −$2,137
- − Depreciation
- −$7,561
- Taxable loss
- −$3,747
- Est. tax savings @ 24.0%
- +$899
- After-tax cash flow
- $1,581/yr
For passive investors: Depreciation is non-cash, so a rental often shows a tax loss while cash-flowing — sheltering income. Rental losses are passive: they offset passive income freely, and up to $25,000/yr can offset ordinary (W-2) income if you actively participate and your MAGI is under $100k (phasing out to $0 by $150k); unused losses carry forward. On sale, claimed depreciation is recaptured at up to 25%, and gains may owe capital-gains tax (a 1031 exchange can defer both). Figures are a year-1 estimate at your 24.0% rate — not tax advice; consult a CPA.
Schools (NCES district)
- District
- Lee
- NCES district ID
- 1201080
- Math proficiency
- 47% ▼ -11.00%
- Reading proficiency
- 50% ▼ -4.00%
- Median HH income
- $49,518
- Composite
- 41.49/100
- National rank
- #3458
- State rank
- #42 of 73 in FL
Livability — Lehigh Acres
- Score
- 59/100
- State rank
- #826
- US rank
- #20055
Category grades
Schools grade is shown separately in the Schools card above.
Census & demographics
- Census place
- Lehigh Acres, FL
- County
- Lee County · 788,662 people
- City population
- 130,638
- Metro
- Cape Coral-Fort Myers, FL
- Population (ZIP)
- 19,927
- Household income
- $72,192
- Rent vs Own
- Severe rent burden
- 434.0
Population outlook (Lee County) Hauer SSP2
- Today (2025)
- 871,946 people
- By 2030
- 955,468 · +9.6%
- By 2040
- 1,113,587 · +27.7%
- By 2050
- 1,256,891 · +44.1%
- By 2075
- 1,560,270 · +78.9%
- By 2100
- 1,726,848 · +98.0%
Race, ethnicity, and origin ACS 2023
- Neighborhood character
- Diverse neighborhood (Simpson 0.64)
- Race & ethnicity
- Hispanic / Latino 52% Two or more races 31% White 26% Black 18%
- Hispanic origin (detail)
- Mexican 12% Puerto Rican 7% Cuban 20% Dominican 4%
- Common ancestry
- Hispanic 7% Italian 1% Portuguese 1%
- Foreign-born
- 32% · Canada, Jamaica
- Languages at home
- 48% English-only · Spanish 43% French/Haitian/Cajun 7% Other Indo-European 1%
Political lean MEDSL · Lee
- 2024 margin
- Strong R (+28.4) · D 35.5% · R 63.9%
- 2008→2024 swing
- -18.0pp toward R · 2008: -10.4pp · 2024: -28.4pp
- All cycles
- 2024: R+28.4 2020: R+19.2 2016: R+20.4 2012: R+16.6 2008: R+10.4
Not yet ingested
- Civics
- —
Market trends
- HPI YoY
- ▲ 16.53%
- Current HPI
- 303.3399
- Rent YoY
- ▼ -4.68%
- Metro
- Cape Coral-Fort Myers, FL
- State GDP YoY
- ▲ 3.28%
- F500 in state
- 36
Industry mix (Fortune 500 HQ in FL)
| Industry | F500 HQs | Revenue |
|---|---|---|
| Industrial Technology | 2 | $29B |
|
||
| Insurance | 2 | $17B |
|
||
| Retail | 1 | $60B |
|
||
| Technology Distribution | 1 | $58B |
|
||
| Homebuilding | 1 | $35B |
|
||
| Technology Manufacturing | 1 | $35B |
|
||
Price history
1 event — show timeline
- 2026-05-28 Listed $259,900 FORTMLS
Property tax history
+9.3%/yrLatest (2022): $2,770 · +17.5% YoY. Source: county tax records.
Cash-flow waterfall
monthlySold comps — $/sqft
last 12 mo · ≤1 miLoading sold comps…