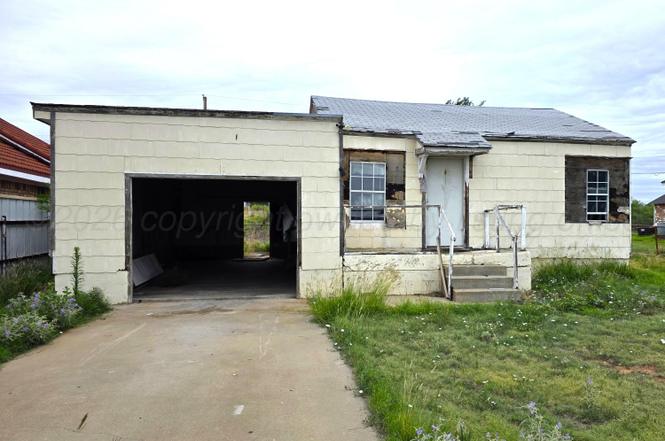
213 Clubhouse Dr · Borger, TX
Flood risk 1/10 · Minimal
- FEMA flood zone
- —
- Chance of flooding over 30 yrs
- 0.0%
- Est. flood insurance / yr
- —
Fire risk 10/10 · Severe
- Est. fire insurance / yr
- $1,222 – $2,270
Heat risk 5/10 · Moderate
- Hot days now (above 100°F)
- 7 days/yr
- Hot days in 30 yrs
- 19 days/yr
Wind risk 2/10 · Minimal
- Chance of severe wind over 30 yrs
- —
Air-quality risk 2/10 · Minimal
- Unhealthy air days now
- 1 days/yr
- Unhealthy air days in 30 yrs
- 1 days/yr
Risk factors via First Street. Map © Google.
Why this score? — see what drove the D grade
The composite is a weighted blend of 9 inputs, each scored 0–100. Each bar is that input's sub-score; the figure is the points it added to the 100-point composite (weight × sub-score).
- Cash flow +15.0/30.0
- ARV discount +7.5/15.0
- 1% rule +5.0/10.0
- DSCR +5.0/10.0
- Schools +3.6/10.0
- Livability +3.6/5.0
- Rent growth +2.5/5.0
- Condition / age +2.5/5.0
- Appreciation +0.0/10.0
$14,500
🖨 Deal sheet (PDF) 📄 Offer letter ✓ Due diligence
Listing remarks
Bring your vision and tools to this exceptional investment opportunity. Situated on a generous lot, this property offers endless potential for renovation, restoration, or redevelopment. The existing home requires extensive repairs and is being sold strictly as-is. Due to its condition, entry should be exercised with caution. Whether you're an investor, contractor, or buyer seeking your next project, this property provides the chance to create something new. Don't miss the opportunity to unlock the value and possibilities this property has to offer.
Key facts
- Garage
- Listed 3 days
Property features AI
Exterior
- Parking: Attached garage
- Home design: Single-family residential property
- Construction: Residential construction
- Exterior features: Composition roof
Interior
- Kitchen: Range, Oven, Refrigerator
- Bathrooms: One three-quarter bathroom
- Interior features: Range, Oven, Refrigerator
Neighborhood map
What this means for you Summary
Snapshot
- This is a 2-bed/1.0-bath single-family listed at $14k.
Deal economics
- At list price, monthly cash flow is $429 ($5k/yr) — positive.
- The deal already cash-flows at list — no discount required.
- Meets the 1% rule at list price ($708 rent vs $14k).
Location & tenants
- Location reads 72/100 on livability (#268 in TX) — a middle-class / working-renter tenant base. Strengths: cost of living A+, housing A+, health & safety A+; Watch: crime D+, employment D, commute F.
- Borger ISD (town): math 43% / reading 41% proficiency, ranked #348 of 826 in TX (top 42%) — families likely to look elsewhere, expect single-tenant / working-renter base with shorter leases.
- Zoned schools: Gateway El (372 students, 64% FRL); Borger Middle (math 50% / reading 45%, grade C-, #408 of 1,662 statewide, top 25%, 381 students, 59% FRL); Borger H S (math 27% / reading 49%, grade F, #880 of 1,632 statewide, top 54%, 761 students, 50% FRL).
- Market conditions: 88 active listings in the ZIP; 3 comparable units currently listed for rent nearby; rentals lingering (median 46d on market — plan ~5-8 weeks vacancy on turnover, expect pricing pressure); 67% of comp listings sitting > 30 days — soft ceiling on asking rent; 2 units permitted in Hutchinson County in 2024 (0 in 5+ unit buildings).
Forward outlook
- Local home prices are declining (-3.0%/yr); year-one equity from $100 of loan paydown is wiped out by about $435 of value loss. Plan a longer hold.
- At projected returns (-3.0% appreciation + 3.0% rent growth), your $4k cash investment doubles in ~1 year — after that, you're playing with house money.
Negotiation context
- Only 4 days on market — expect competitive offers; lowballing is unlikely to land.
Risks & watch-outs
- Watch-outs: property tax is 4.0% of price.
- Climate carrying-cost: severe wildfire risk; extreme-heat days projected 7→19/yr by 2055 (HVAC capex compounding) — expect insurance premiums to compound above CPI over the hold.
Questions for the listing agent
- Property tax is high relative to price — has the assessment been appealed recently, and will the sale trigger a re-assessment?
- Is there a deadline driving the sale (1031 exchange, divorce, estate, relocation)? That informs how much negotiation room exists.
- Schools are D-rated, which usually means shorter tenancies and higher turnover. Who's the typical renter profile here, and what's been the actual vacancy rate?
- Crime grade is D in this area — have there been break-ins, vandalism, or insurance claims at this property in the last 3 years? What carrier currently insures it and at what premium?
- The area grade is low — what's the realistic commute time and amenity access for the typical tenant pool here? Any planned neighborhood developments (good or bad) we should know about?
- What's the average days-on-market for RENTAL listings here right now (not sales)? A rising rental-DOM trend means longer vacancies and softer asking-rent achievability than the comps imply.
- What's the recent tenant-quality profile in this submarket — average credit score on applications, eviction rate, late-payment / NSF rate, and stable-employment percentage? A property-management company in the area should have these aggregated.
- How much new for-sale + rental construction is in the pipeline within 1–3 miles? Heavy new supply typically softens prices + rents 12–24 months out; constrained supply supports both.
Investment metrics
- 1% rule
- 4.88% ✓
- Cap rate
- 41.76%
- Cash-on-cash
- 126.68%
- DSCR
- 6.64
- GRM
- 1.7
CMA / ARV
No comps found within radius.
Projected returns pro-forma
-3.0% appreciation · 3.0% rent growth · sell at horizon
- IRR
- —
- Equity multiple
- 7.15×
- Total profit
- $24,978
- Equity at exit
- $2,162
- IRR
- —
- Equity multiple
- 15.04×
- Total profit
- $57,021
- Equity at exit
- $1,254
Cash invested: $4,060 (down + closing). Projections, not guarantees.
Landlord ↔ Tenant lean methodology
- Overall (STATE)
- 87 Strongly Landlord-Friendly
- State Texas
- 87 Strongly Landlord-Friendly · R+5
- County
- — inherits STATE
- City
- — inherits STATE
ZIP-level market 79007
- Active inventory
- 88
- Price-to-rent
- 1.7×
Monthly cashflow live
- Estimated rent
- $708 medium interval (Pro) →
- Mortgage (P&I)
- −$76
- Tax from tax record
- −$49 /mo · $587/yr
- Insurance
- −$6
- HOA
- −$0
- Lot rent
- −$0
- Vacancy / Maint / Mgmt
- −$149
- Net cashflow
- $429
Break-even live
Sensitivity live
| Price | -10% $437 | -5% $433 | +0% $429 | +5% $424 | +10% $420 |
|---|---|---|---|---|---|
| Rent | -10% $373 | -5% $401 | +0% $429 | +5% $457 | +10% $485 |
| Rate | -1.0pp $436 | -0.5pp $432 | base $429 | +0.5pp $425 | +1.0pp $421 |
UW: 25.0% down · 7.5% · 30yr · 1.5% tax · 5.0% vac · 8.0% maint · 8.0% mgmt
Financing live
Cash to close
- Down payment
- $3,625
- Closing costs
- $435
- Reserves months
- —
- Total cash needed
- —
Loan-product check · same deal, 3 products live
Conventional
25% down · 7.5% · 30yr
- Down + closing
- —
- Monthly P&I
- —
- Monthly cashflow
- —
- DSCR
- —
- Eligible?
- —
Personal DTI + credit; lowest rate.
DSCR
20% down · 8.5% · 30yr
- Down + closing
- —
- Monthly P&I
- —
- Monthly cashflow
- —
- DSCR
- —
- Eligible?
- —
No personal income docs; deal must DSCR.
Hard money
10% down · 12.0% · 12mo
- Down + closing
- —
- Monthly P&I
- —
- Monthly cashflow
- —
- DSCR
- —
- Eligible?
- —
Short-term bridge; refi at stabilization.
Rent comps 3 comps
| Address | Beds | Baths | Sqft | Rent | $/sqft | DOM | Units | Dist |
|---|---|---|---|---|---|---|---|---|
| 1401 Boyd St Unit NP-1404-C Borger, TX | 1.0 | 1.0 | 650 | $600 | $0.92 | 46d | 1 | 0.79mi |
| 1401 Boyd St Unit NP-706-D Borger, TX | 2.0 | 1.0 | 850 | $750 | $0.88 | 15d | 1 | 0.79mi |
| 702 Deahl St Borger, TX | 1.0 | 1.0 | 700 | $800 | $1.14 | 46d | 1 | 1.46mi |
Listing history 5 events
-
2026-06-22days on market $14,500 Active 4 DOM
-
2026-06-21days on market $14,500 Active 3 DOM
-
2026-06-21days on market $14,500 Active 2 DOM
-
2026-06-18remarks 554-char remark
-
2026-06-18$14,500 Active 1 DOM
ⓘ Source: listings_history table (triggers on properties + properties_extension) + one-shot
backfill from property_details.listing_events for pre-trigger history.
Tax reassessment forecast TX · Resets to sale price
- Current annual tax
- $587 · $49/mo
- Projected year-2 tax
- $587 · $49/mo
- Expected delta
- $0/yr ($0/mo · 0.0%)
ⓘ Screening estimate from a state-policy table — verify with the county assessor before closing.
Climate risk First Street
- Flood 1/10 Low 0% chance over 30 yrs
- Wildfire 10/10 Extreme
- Heat 5/10 Major 7 d/yr ≥100°F today · 19 d/yr by 30 yrs out
- Wind 2/10 Low
- Air quality 2/10 Low 1 unhealthy d/yr today · 1 by 30 yrs out
Nearby sold comps map
Loading sold comps map…
Walkable amenities ~0.75 mi
Loading nearby amenities…
Taxation est. · year 1
- Rental income
- $8,500
- − Mortgage interest
- −$812
- − Property taxes
- −$587
- − Insurance
- −$72
- − Repairs & maintenance
- −$680
- − Management
- −$680
- − Depreciation
- −$422
- Taxable income
- $5,247
- Est. tax owed @ 24.0%
- −$1,259
- After-tax cash flow
- $3,884/yr
For passive investors: Depreciation is non-cash, so a rental often shows a tax loss while cash-flowing — sheltering income. Rental losses are passive: they offset passive income freely, and up to $25,000/yr can offset ordinary (W-2) income if you actively participate and your MAGI is under $100k (phasing out to $0 by $150k); unused losses carry forward. On sale, claimed depreciation is recaptured at up to 25%, and gains may owe capital-gains tax (a 1031 exchange can defer both). Figures are a year-1 estimate at your 24.0% rate — not tax advice; consult a CPA.
Schools (NCES district)
- District
- Borger ISD
- NCES district ID
- 4810890
- Math proficiency
- 43% ▼ -4.00%
- Reading proficiency
- 41% ▼ -1.00%
- Median HH income
- $44,714
- Composite
- 35.66/100
- National rank
- #4879
- State rank
- #348 of 826 in TX
Livability — Borger
- Score
- 72/100
- State rank
- #268
- US rank
- #6266
Category grades
Schools grade is shown separately in the Schools card above.
Census & demographics
- Population (ZIP)
- 13,927
Population outlook (Hutchinson County) Hauer SSP2
- Today (2025)
- 21,274 people
- By 2030
- 21,089 · -0.9%
- By 2040
- 20,938 · -1.6%
- By 2050
- 20,999 · -1.3%
- By 2075
- 21,433 · +0.7%
- By 2100
- 21,243 · -0.1%
Race, ethnicity, and origin ACS 2023
- Neighborhood character
- Majority White (61%)
- Race & ethnicity
- White 61% Hispanic / Latino 32% Two or more races 19% Black 3% Native American 2%
- Hispanic origin (detail)
- Mexican 29%
- Common ancestry
- Slovak 2% Italian 1% Iranian 1%
- Foreign-born
- 7% · Canada
- Languages at home
- 79% English-only · Spanish 20%
Political lean MEDSL · Hutchinson
- 2024 margin
- Solid R (+77.2) · D 11.1% · R 88.2%
- 2008→2024 swing
- -8.2pp toward R · 2008: -68.9pp · 2024: -77.2pp
- All cycles
- 2024: R+77.2 2020: R+76.6 2016: R+76.1 2012: R+72.7 2008: R+68.9
Not yet ingested
- Civics
- —
Market trends
- HPI YoY
- ▼ -76.35%
- Current HPI
- 114.1111
- Rent YoY
- —
- Metro
- —
- State GDP YoY
- ▲ 3.95%
- F500 in state
- 110
Industry mix (Fortune 500 HQ in TX)
| Industry | F500 HQs | Revenue |
|---|---|---|
| Energy | 16 | $1,198B |
|
||
| Technology | 5 | $198B |
|
||
| Engineering / Construction | 4 | $72B |
|
||
| Energy Services | 3 | $60B |
|
||
| Utilities | 3 | $41B |
|
||
| Healthcare | 2 | $330B |
|
||
Price history
4 events — show timeline
- 2026-06-18 Listed $14,500 PBOR
- 2024-01-31 Sold (Public Records) — Public Records
- 2023-12-06 Sold (Public Records) — Public Records
- 2023-11-16 Sold (Public Records) — Public Records
Property tax history
+3.7%/yrLatest (2025): $587 · +43.9% YoY. Source: county tax records.
Cash-flow waterfall
monthlySold comps — $/sqft
last 12 mo · ≤1 miLoading sold comps…