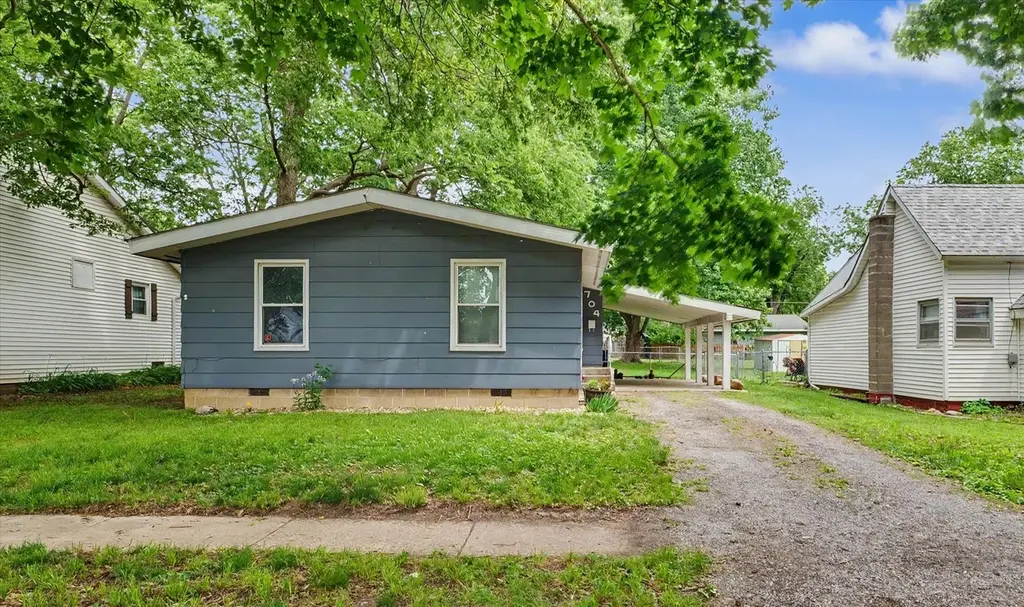
704 E Lincoln St · Monticello, IL
Flood risk 1/10 · Minimal
- FEMA flood zone
- X (unshaded)
- Chance of flooding over 30 yrs
- 0.0%
- Est. flood insurance / yr
- $473 – $860
Fire risk 1/10 · Minimal
- Est. fire insurance / yr
- $804 – $1,492
Heat risk 3/10 · Minor
- Hot days now (above 104°F)
- 7 days/yr
- Hot days in 30 yrs
- 19 days/yr
Wind risk 2/10 · Minimal
- Chance of severe wind over 30 yrs
- 1.0%
Air-quality risk 2/10 · Minimal
- Unhealthy air days now
- 1 days/yr
- Unhealthy air days in 30 yrs
- 1 days/yr
Risk factors via First Street. Map © Google.
Why this score? — see what drove the C grade
The composite is a weighted blend of 9 inputs, each scored 0–100. Each bar is that input's sub-score; the figure is the points it added to the 100-point composite (weight × sub-score).
- Cash flow +21.0/30.0
- ARV discount +10.0/15.0
- DSCR +6.7/10.0
- 1% rule +5.3/10.0
- Livability +4.1/5.0
- Schools +3.7/10.0
- Rent growth +2.5/5.0
- Condition / age +2.5/5.0
- Appreciation +0.0/10.0
$159,900
🖨 Deal sheet 📄 Offer letter ✓ Due diligence
Listing remarks MLS
Welcome Home! This is a well-maintained ranch-style home with a large living room, 2 bedrooms, 1 bathroom, and an eat-in kitchen with new flooring throughout. Off the back, there is a deck/grill area along with a fire pit that is perfect for entertaining and relaxing. The home is completely fenced in, in the back making it perfect for a cute dog or two. The home also has a shed for more storage/yard equipment. Fence (2023), vinyl flooring (2023), roof (2020), paint (2022), all outlets (2022).
Key facts
- 6,385 sq ft lot
- 2 parking spots
- Built 1919
Property features AI
Finance
- Other: Property taxes reported for 2024 (information available); Parcel number on record
- HOA & community: No master association fee required
Exterior
- Parking: Two owned parking spaces
- Utilities: Public water; Public sewer
- Home design: Detached single-family home; One-story; Fee simple ownership; Home built more than 100 years ago; Asphalt roof
- Construction: Constructed with other (non-specified) materials; Property not listed as rebuilt or rehabbed
- Exterior features: Deck; Fenced yard; Mature trees
Interior
- Kitchen: Range; Microwave; Dishwasher; Refrigerator; Eating area with breakfast bar and table space
- Bedrooms: Master bedroom on main level (15 x 12); Additional bedroom on main level (10 x 12); Two other bedroom designations listed
- Flooring: Vinyl flooring throughout main rooms listed
- Bathrooms: One full bathroom
- Heating & cooling: Natural gas forced-air heating; Central air conditioning
- Interior features: Five rooms total; Crawl space basement
- Laundry & utility: Laundry room; Washer; Dryer
Neighborhood map
What this means for you Summary
Snapshot
- This is a 2-bed/1.0-bath single-family listed at $160k.
Deal economics
- At list price, monthly cash flow is $227 ($3k/yr) — positive.
- The deal already cash-flows at list — no discount required.
- Meets the 1% rule at list price ($2k rent vs $160k).
- Cap rate 8.0% vs local median 3.5% in Monticello — top-decile yield for the area; either an underpriced asset or a hidden risk that comps aren't pricing in. Stress-test before assuming the spread holds.
Location & tenants
- Location reads 82/100 on livability (#69 in IL, #1,132 nationally) — a professional / high-income tenant draw. Strengths: crime A+, employment A+, cost of living A+; Watch: amenities F, commute F.
- Monticello CUSD 25 (town): math 30% / reading 51% proficiency, ranked #123 of 620 in IL (top 20%) — families likely to look elsewhere, expect single-tenant / working-renter base with shorter leases; only 15% free/reduced lunch — higher-income household profile.
- Zoned schools: Monticello Middle School (math 25% / reading 56%, grade F, #136 of 665 statewide, top 21%, 379 students, 0% FRL); Monticello High School (math 32% / reading 42%, grade F, #107 of 693 statewide, top 17%, 476 students, 0% FRL) — zoned schools average 0% FRL vs 15% district-wide (15 pts lower); this property's tenant base skews higher-income than the district average.
- Market conditions: 47 active listings in the ZIP; 1 comparable units currently listed for rent nearby; 34 units permitted in Piatt County in 2024 (0 in 5+ unit buildings).
Forward outlook
- Local home prices are declining (-3.0%/yr); year-one equity from $1k of loan paydown is wiped out by about $5k of value loss. Plan a longer hold.
- Piatt County population projected at -19% by 2050 — secular population decline; favor cash flow + early exit over multi-decade hold.
Negotiation context
- Only 8 days on market — expect competitive offers; lowballing is unlikely to land.
- 4 sale attempts since 19y ago with the ask held roughly flat each time — persistent listings suggest the price (not the market) is what's stuck; bring a comps-based counter.
- Current owner paid $136k; 18% above their basis — modest negotiation headroom, anchor on the comps not their cost.
Risks & watch-outs
- Watch-outs: built in 1919 — expect roof / HVAC / electrical / plumbing capex.
Questions for the listing agent
- Built in 1919 — when were the roof, HVAC, electrical panel, plumbing, and water heater last replaced?
- Is there a deadline driving the sale (1031 exchange, divorce, estate, relocation)? That informs how much negotiation room exists.
- Schools are B-rated — typically a magnet for longer-tenancy family renters. What's the average tenant stay here, and is there a school-zone premium baked into asking?
- What's the average days-on-market for RENTAL listings here right now (not sales)? A rising rental-DOM trend means longer vacancies and softer asking-rent achievability than the comps imply.
- What's the recent tenant-quality profile in this submarket — average credit score on applications, eviction rate, late-payment / NSF rate, and stable-employment percentage? A property-management company in the area should have these aggregated.
- How much new for-sale + rental construction is in the pipeline within 1–3 miles? Heavy new supply typically softens prices + rents 12–24 months out; constrained supply supports both.
Investment metrics
- 1% rule
- 1.03% ✓
- Cap rate
- 7.99%
- Cash-on-cash
- 6.08%
- DSCR
- 1.27
- GRM
- 8.1
CMA / ARV
- ARV (on-the-fly)
- $169,320
- Comps found
- 12
Show comp detail 12 sales within ~0.75 mi
| Address | Dist | Beds/Ba | Sqft | Sold | Price | $/sf | Match |
|---|---|---|---|---|---|---|---|
| 918 E Lincoln St | 0.11mi | 2/1.0 | 1,004 (-2%) | 10mo | $143,000 | $142 | 84 |
| 413 E Lincoln St | 0.10mi | 2/1.0 | 902 (-12%) | 3mo | $160,000 | $177 | 74 |
| 309 E Lincoln St | 0.15mi | 2/1.0 | 953 (-7%) | 14mo | $135,000 | $142 | 70 |
| 813 E Washington St | 0.30mi | 2/1.0 | 1,132 (+11%) | 5mo | $111,100 | $98 | 63 |
| 419 S Hamilton St | 0.51mi | 2/1.0 | 956 (-6%) | 6mo | $85,000 | $89 | 61 |
| 914 E Washington St | 0.29mi | 3/1.0 (+1) | 1,150 (+13%) | 7mo | $154,000 | $134 | 54 |
| 809 S Longview Rd | 0.69mi | 3/1.0 (+1) | 986 (-3%) | 7mo | $210,000 | $213 | 52 |
| 442 S Hamilton St | 0.57mi | 2/1.0 | 873 (-14%) | 0mo | $145,000 | $166 | 50 |
| 713 Madison St | 0.66mi | 3/1.0 (+1) | 1,108 (+9%) | 10mo | $204,000 | $184 | 42 |
| 319 W Bond St | 0.74mi | 2/1.0 | 1,148 (+12%) | 6mo | $173,500 | $151 | 39 |
| 708 S Emerson St | 0.62mi | 3/1.0 (+1) | 880 (-14%) | 6mo | $179,000 | $203 | 38 |
| 903 S Longview Rd | 0.72mi | 3/2.0 (+1) | 1,167 (+14%) | 6mo | $195,000 | $167 | 28 |
Match score weights: distance 35% · size 25% · config 20% · recency 20%. Top-matched comps best support the ARV.
Projected returns pro-forma
-3.0% appreciation · 3.0% rent growth · sell at horizon
- IRR
- -6.9%
- Equity multiple
- 0.74×
- Total profit
- $-11,465
- Equity at exit
- $23,842
- IRR
- 2.7%
- Equity multiple
- 1.19×
- Total profit
- $8,639
- Equity at exit
- $13,825
Cash invested: $44,772 (down + closing). Projections, not guarantees.
Landlord ↔ Tenant lean methodology
- Overall (STATE)
- 43 Moderately Tenant-Leaning
- State Illinois
- 43 Moderately Tenant-Leaning · D+7
- County
- — inherits STATE
- City
- — inherits STATE
ZIP-level market 61856
- Active inventory
- 47
- Price-to-rent
- 8.1×
Monthly cashflow live
- Estimated rent
- $1,650 medium interval (Pro) →
- Mortgage (P&I)
- −$839
- Tax from tax record
- −$172 /mo · $2,060/yr
- Insurance
- −$67
- HOA
- −$0
- Vacancy / Maint / Mgmt
- −$346
- Net cashflow
- $227
Break-even live
UW: 25.0% down · 7.5% · 30yr · 1.5% tax · 5.0% vac · 8.0% maint · 8.0% mgmt
Financing live
Cash to close
- Down payment
- $39,975
- Closing costs
- $4,797
- Reserves months
- —
- Total cash needed
- —
Loan-product check · same deal, 3 products live
Conventional
25% down · 7.5% · 30yr
- Down + closing
- —
- Monthly P&I
- —
- Monthly cashflow
- —
- DSCR
- —
- Eligible?
- —
Personal DTI + credit; lowest rate.
DSCR
20% down · 8.5% · 30yr
- Down + closing
- —
- Monthly P&I
- —
- Monthly cashflow
- —
- DSCR
- —
- Eligible?
- —
No personal income docs; deal must DSCR.
Hard money
10% down · 12.0% · 12mo
- Down + closing
- —
- Monthly P&I
- —
- Monthly cashflow
- —
- DSCR
- —
- Eligible?
- —
Short-term bridge; refi at stabilization.
Rent comps 1 comps
| Address | Beds | Baths | Sqft | Rent | $/sqft | DOM | Units | Dist |
|---|---|---|---|---|---|---|---|---|
| 813 E Washington St Monticello, IL | 2.0 | 1.0 | 1132 | $1,650 | $1.46 | 43d | 1 | 0.29mi |
Listing history 5 events
-
2026-06-05statusdays on market $159,900 Pending 8 DOM
-
2026-06-02days on market $159,900 Active 6 DOM
-
2026-06-01days on market $159,900 Active 5 DOM
-
2026-05-31days on market $159,900 Active 4 DOM
-
2026-05-30days on market $159,900 Active 3 DOM
ⓘ Source: listings_history table (triggers on properties + properties_extension) + one-shot
backfill from property_details.listing_events for pre-trigger history.
Tax reassessment forecast IL · Partial reset (capped growth)
- Current annual tax
- $2,060 · $172/mo
- Projected year-2 tax
- $2,845 · $237/mo
- Expected delta
- +$785/yr (+$65/mo · 38.1%)
ⓘ Screening estimate from a state-policy table — verify with the county assessor before closing.
Climate risk First Street
- Flood 1/10 Low FEMA zone X (unshaded) · 0% chance over 30 yrs
- Wildfire 1/10 Low
- Heat 3/10 Moderate 7 d/yr ≥104°F today · 19 d/yr by 30 yrs out
- Wind 2/10 Low 100% chance of damaging wind over 30 yrs
- Air quality 2/10 Low 1 unhealthy d/yr today · 1 by 30 yrs out
Nearby sold comps map
Loading sold comps map…
Walkable amenities ~0.75 mi
Loading nearby amenities…
Taxation est. · year 1
- Rental income
- $19,800
- − Mortgage interest
- −$8,957
- − Property taxes
- −$2,060
- − Insurance
- −$800
- − Repairs & maintenance
- −$1,584
- − Management
- −$1,584
- − Depreciation
- −$4,652
- Taxable income
- $164
- Est. tax owed @ 24.0%
- −$39
- After-tax cash flow
- $2,681/yr
For passive investors: Depreciation is non-cash, so a rental often shows a tax loss while cash-flowing — sheltering income. Rental losses are passive: they offset passive income freely, and up to $25,000/yr can offset ordinary (W-2) income if you actively participate and your MAGI is under $100k (phasing out to $0 by $150k); unused losses carry forward. On sale, claimed depreciation is recaptured at up to 25%, and gains may owe capital-gains tax (a 1031 exchange can defer both). Figures are a year-1 estimate at your 24.0% rate — not tax advice; consult a CPA.
Schools (NCES district)
- District
- Monticello CUSD 25
- NCES district ID
- 1726550
- Math proficiency
- 30% ▼ -10.00%
- Reading proficiency
- 51% ▼ -5.00%
- Median HH income
- $69,919
- Composite
- 36.73/100
- National rank
- #4590
- State rank
- #123 of 620 in IL
Livability — Monticello
- Score
- 82/100
- State rank
- #69
- US rank
- #1132
Category grades
Schools grade is shown separately in the Schools card above.
Census & demographics
- Census place
- Monticello, IL
- City population
- 8,110
- Population (ZIP)
- 8,110
Population outlook (Piatt County) Hauer SSP2
- Today (2025)
- 15,501 people
- By 2030
- 14,978 · -3.4%
- By 2040
- 13,805 · -10.9%
- By 2050
- 12,563 · -19.0%
- By 2075
- 9,916 · -36.0%
- By 2100
- 7,295 · -52.9%
Race, ethnicity, and origin ACS 2023
- Neighborhood character
- Predominantly White (95%)
- Race & ethnicity
- White 95% Black 3% Two or more races 2% Hispanic / Latino 1%
- Common ancestry
- Slovak 3% Italian 3% Iranian 1%
- Foreign-born
- 1% · Canada
- Languages at home
- 99% English-only · Spanish 1%
Political lean MEDSL · Piatt
- 2024 margin
- Solid R (+30.5) · D 33.7% · R 64.3% · Other 2.0%
- 2008→2024 swing
- -18.0pp toward R · 2008: -12.6pp · 2024: -30.5pp
- All cycles
- 2024: R+30.5 2020: R+29.6 2016: R+33.6 2012: R+26.8 2008: R+12.6
Not yet ingested
- Civics
- —
Market trends
- HPI YoY
- ▼ -100.96%
- Current HPI
- 160.6145
- Rent YoY
- —
- Metro
- —
- State GDP YoY
- ▲ 1.59%
- F500 in state
- 60
Industry mix (Fortune 500 HQ in IL)
| Industry | F500 HQs | Revenue |
|---|---|---|
| Insurance | 4 | $201B |
|
||
| Consumer Goods | 4 | $87B |
|
||
| Industrial Machinery | 3 | $64B |
|
||
| Healthcare | 2 | $55B |
|
||
| Retail / Pharmacy | 1 | $148B |
|
||
| Agriculture / Food | 1 | $86B |
|
||
Price history
+77.9% since first listed13 events — show timeline
- 2026-05-27 Listed $159,900 MRED as Distributed by MLS Grid
- 2024-05-22 Sold (Public Records) $136,000 Public Records
- 2024-05-17 Sold (MLS) $136,000 MRED as Distributed by MLS Grid
- 2024-03-31 Contingent — MRED as Distributed by MLS Grid
- 2024-03-30 Listed $145,000 MRED as Distributed by MLS Grid
- 2021-12-29 Sold (Public Records) $93,000 Public Records
- 2021-12-29 Sold (MLS) $93,000 MRED as Distributed by MLS Grid
- 2021-11-26 Pending — MRED as Distributed by MLS Grid
- 2021-11-15 Price Changed $99,999 MRED as Distributed by MLS Grid
- 2021-10-26 Listed $105,000 MRED as Distributed by MLS Grid
- 2014-08-05 Sold (Public Records) $87,000 Public Records
- 2007-06-15 Sold (MLS) $87,000 MRED as Distributed by MLS Grid
- 2007-04-30 Listed $89,900 MRED as Distributed by MLS Grid
Property tax history
+3.7%/yrLatest (2024): $2,060 · +3.1% YoY. Source: county tax records.
Cash-flow waterfall
monthlySold comps — $/sqft
last 12 mo · ≤1 miLoading sold comps…